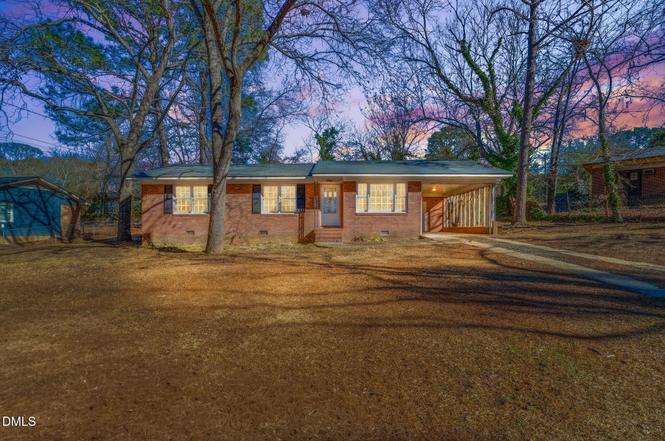
7560 Carrollburg Dr · Fayetteville, NC
Flood risk 6/10 · Moderate
- FEMA flood zone
- X (unshaded)
- Chance of flooding over 30 yrs
- 0.75%
- Est. flood insurance / yr
- $473 – $860
Fire risk 3/10 · Minor
- Est. fire insurance / yr
- $906 – $1,684
Heat risk 7/10 · Major
- Hot days now (above 106°F)
- 7 days/yr
- Hot days in 30 yrs
- 16 days/yr
Wind risk 7/10 · Major
- Chance of severe wind over 30 yrs
- 78.0%
Air-quality risk 2/10 · Minimal
- Unhealthy air days now
- 0 days/yr
- Unhealthy air days in 30 yrs
- 1 days/yr
Risk factors via First Street. Map © Google.
Why this score? — see what drove the D+ grade
The composite is a weighted blend of 9 inputs, each scored 0–100. Each bar is that input's sub-score; the figure is the points it added to the 100-point composite (weight × sub-score).
- ARV discount +15.0/15.0
- Cash flow +13.9/30.0
- DSCR +4.2/10.0
- 1% rule +4.0/10.0
- Livability +3.8/5.0
- Rent growth +3.3/5.0
- Schools +3.1/10.0
- Condition / age +2.5/5.0
- Appreciation +0.0/10.0
$155,000
🖨 Deal sheet (PDF) 📄 Offer letter ✓ Due diligence
Listing remarks
Opportunity awaits with this 4-bedroom, 2-bath brick home in Fayetteville, located just 3 miles from Fort Bragg. This one-level property offers a solid foundation and a functional layout, making it an ideal candidate for a fix-and-flip project or a great addition to a rental portfolio. The fenced-in yard and durable brick exterior add long-term value, while the interior is ready for renovation and customization. With the right updates, this home has the potential to shine. Property is being sold as is and is suitable for cash or conventional financing only. Whether you're an experienced investor or someone looking to build equity through renovation, this is a property worth a look.
Key facts
- Brick home
- Functional layout
- Fenced-in yard
Tags
Property features AI
Finance
- HOA & community: No homeowners association
Exterior
- Utilities: Water: See remarks; Sewer: Unknown
- Home design: Single-story house; Site-built structure
- Construction: Brick construction; Shingle roof; Permanent foundation; Built as a house (site built)
- Exterior features: Lot approximately 0.34 acres; Publicly maintained road access
Interior
- Bedrooms: Three bedrooms (all on the main level)
- Flooring: Carpet; Hardwood; Linoleum; Tile; Vinyl
- Bathrooms: Two full bathrooms and one half bathroom
- Heating & cooling: Electric heating with heat pump; Electric cooling
- Interior features: Carpet, hardwood, linoleum, tile, and vinyl flooring
Neighborhood map
What this means for you Summary
Snapshot
- This is a 3-bed/3.0-bath single-family listed at $155k.
Deal economics
- At list price, monthly cash flow is $18 ($221/yr) — positive.
- The deal already cash-flows at list — no discount required.
- To meet the 1% rule (rent ≥ 1% of price), the offer needs to be $139k (10.4% below list).
- Recommended offer: $136k (12.0% below list) — sets the bar for market timing.
- Cap rate 6.4% vs local median 4.8% in Fayetteville — top-decile yield for the area; either an underpriced asset or a hidden risk that comps aren't pricing in. Stress-test before assuming the spread holds.
Location & tenants
- Location reads 75/100 on livability (#45 in NC, #4,031 nationally) — a middle-class / working-renter tenant base. Strengths: commute A+, cost of living A+, housing A+; Watch: schools C-, crime F, employment D-.
- Cumberland County Schools (urban): math 32% / reading 41% proficiency, ranked #126 of 178 in NC (top 71%) — families likely to look elsewhere, expect single-tenant / working-renter base with shorter leases.
- Market conditions: Rents rising (+3.0%/yr); 285 active listings in the ZIP; 40 comparable units currently listed for rent nearby; rentals at typical pace (median 25d on market — plan ~3-4 weeks tenant-placement turnaround); 1,125 units permitted in Cumberland County in 2024 (104 in 5+ unit buildings).
Forward outlook
- Local home prices are declining (-3.0%/yr); year-one equity from $1k of loan paydown is wiped out by about $5k of value loss. Plan a longer hold.
Negotiation context
- It's been on market 131 days — a 12% lower offer ($136k) is reasonable based on typical stale-listing flexibility.
- Current owner paid $125k; 24% above their basis — modest negotiation headroom, anchor on the comps not their cost.
Risks & watch-outs
- Climate carrying-cost: major flood risk; major wind risk, 78% chance of damaging wind over 30y; extreme-heat days projected 7→16/yr by 2055 (HVAC capex compounding) — expect insurance premiums to compound above CPI over the hold.
Questions for the listing agent
- It's been on market 131 days. Have you received any prior offers? Is the seller open to a 12% concession, seller financing, or rate buy-down credit?
- Built in 1964 — when were the roof, HVAC, electrical panel, plumbing, and water heater last replaced?
- Why hasn't it sold? Are there any deal-killer items the seller is aware of (foundation, flood, title, zoning, code violations)?
- Is there a deadline driving the sale (1031 exchange, divorce, estate, relocation)? That informs how much negotiation room exists.
- Crime grade is F in this area — have there been break-ins, vandalism, or insurance claims at this property in the last 3 years? What carrier currently insures it and at what premium?
- The area grade is low — what's the realistic commute time and amenity access for the typical tenant pool here? Any planned neighborhood developments (good or bad) we should know about?
- What's the average days-on-market for RENTAL listings here right now (not sales)? A rising rental-DOM trend means longer vacancies and softer asking-rent achievability than the comps imply.
- What's the recent tenant-quality profile in this submarket — average credit score on applications, eviction rate, late-payment / NSF rate, and stable-employment percentage? A property-management company in the area should have these aggregated.
- How much new for-sale + rental construction is in the pipeline within 1–3 miles? Heavy new supply typically softens prices + rents 12–24 months out; constrained supply supports both.
Investment metrics
- 1% rule
- 0.90% ✗
- Cap rate
- 6.44%
- Cash-on-cash
- 0.51%
- DSCR
- 1.02
- GRM
- 9.3
CMA / ARV
- ARV (on-the-fly)
- $204,435
- Comps found
- 12
Show comp detail 12 sales within ~0.75 mi
| Address | Dist | Beds/Ba | Sqft | Sold | Price | $/sf | Match |
|---|---|---|---|---|---|---|---|
| 7513 Paxton Dr | 0.33mi | 3/2.0 | 1,231 (-1%) | 1mo | $219,900 | $179 | 79 |
| 7651 Fletcher Ave | 0.36mi | 3/2.0 | 1,242 (+0%) | 6mo | $234,900 | $189 | 74 |
| 284 Channing Dr | 0.15mi | 3/1.0 | 1,175 (-5%) | 3mo | $167,000 | $142 | 74 |
| 7519 Telfair Dr | 0.26mi | 3/1.0 | 1,189 (-4%) | 5mo | $179,900 | $151 | 69 |
| 7623 Sable Dr | 0.44mi | 3/2.0 | 1,282 (+4%) | 4mo | $235,000 | $183 | 67 |
| 7530 Decatur Dr | 0.28mi | 3/1.0 | 1,175 (-5%) | 6mo | $130,000 | $111 | 65 |
| 7522 Decatur Dr | 0.31mi | 3/1.0 | 1,175 (-5%) | 6mo | $130,000 | $111 | 64 |
| 7538 Hargrove Ct | 0.52mi | 3/2.0 | 1,320 (+6%) | 1mo | $218,000 | $165 | 60 |
| 277 Ramona Dr | 0.36mi | 3/2.0 | 1,404 (+13%) | 6mo | $224,000 | $160 | 52 |
| 281 Ramona Dr | 0.37mi | 3/1.5 | 1,069 (-14%) | 4mo | $188,000 | $176 | 51 |
| 7533 Cliffbourne | 0.52mi | 3/1.0 | 1,114 (-10%) | 3mo | $204,900 | $184 | 49 |
| 147 Brocton Dr | 0.69mi | 3/1.5 | 1,066 (-14%) | 2mo | $149,000 | $140 | 37 |
Match score weights: distance 35% · size 25% · config 20% · recency 20%. Top-matched comps best support the ARV.
Projected returns pro-forma
-3.0% appreciation · 3.01% rent growth · sell at horizon
- IRR
- -15.5%
- Equity multiple
- 0.45×
- Total profit
- $-23,906
- Equity at exit
- $23,111
- IRR
- -6.9%
- Equity multiple
- 0.56×
- Total profit
- $-19,147
- Equity at exit
- $13,402
Cash invested: $43,400 (down + closing). Projections, not guarantees.
Landlord ↔ Tenant lean methodology
- Overall (STATE)
- 85 Strongly Landlord-Friendly
- State North Carolina
- 85 Strongly Landlord-Friendly · R+3
- County
- — inherits STATE
- City
- — inherits STATE
ZIP-level market 28303
- Home prices YoY
- -25.4%
- Rents YoY
- 3.0%
- Active inventory
- 285
- Price-to-rent
- 9.3×
Monthly cashflow live
- Estimated rent
- $1,389 high interval (Pro) →
- Mortgage (P&I)
- −$813
- Tax from tax record
- −$201 /mo · $2,414/yr
- Insurance
- −$65
- HOA
- −$0
- Vacancy / Maint / Mgmt
- −$292
- Net cashflow
- $18
Break-even live
Sensitivity live
| Price | -10% $106 | -5% $62 | +0% $18 | +5% $-25 | +10% $-69 |
|---|---|---|---|---|---|
| Rent | -10% $-91 | -5% $-36 | +0% $18 | +5% $73 | +10% $128 |
| Rate | -1.0pp $96 | -0.5pp $58 | base $18 | +0.5pp $-22 | +1.0pp $-63 |
UW: 25.0% down · 7.5% · 30yr · 1.5% tax · 5.0% vac · 8.0% maint · 8.0% mgmt
Financing live
Cash to close
- Down payment
- $38,750
- Closing costs
- $4,650
- Reserves months
- —
- Total cash needed
- —
Loan-product check · same deal, 3 products live
Conventional
25% down · 7.5% · 30yr
- Down + closing
- —
- Monthly P&I
- —
- Monthly cashflow
- —
- DSCR
- —
- Eligible?
- —
Personal DTI + credit; lowest rate.
DSCR
20% down · 8.5% · 30yr
- Down + closing
- —
- Monthly P&I
- —
- Monthly cashflow
- —
- DSCR
- —
- Eligible?
- —
No personal income docs; deal must DSCR.
Hard money
10% down · 12.0% · 12mo
- Down + closing
- —
- Monthly P&I
- —
- Monthly cashflow
- —
- DSCR
- —
- Eligible?
- —
Short-term bridge; refi at stabilization.
Rent comps 40 comps
| Address | Beds | Baths | Sqft | Rent | $/sqft | DOM | Units | Dist |
|---|---|---|---|---|---|---|---|---|
| 7639 Fletcher Ave Fayetteville, NC | 3.0 | 2.0 | 1300 | $1,400 | $1.08 | 24d | 1 | 0.29mi |
| 7514 Telfair Dr Fayetteville, NC | 3.0 | 1.5 | 1204 | $1,300 | $1.08 | 24d | 1 | 0.30mi |
| 278 Crabapple Cir #57 Fayetteville, NC | 2.0 | 1.0 | 796 | $990 | $1.24 | 24d | 1 | 0.33mi |
| 7526 Bridgeman Dr Fayetteville, NC | 3.0 | 2.0 | 1300 | $1,450 | $1.12 | 24d | 1 | 0.34mi |
| 307 Family Lodge Dr Unit 5 Fayetteville, NC | 2.0 | 2.5 | 1200 | $1,100 | $0.92 | 15d | 1 | 0.56mi |
| 909 Applewood Ln Fayetteville, NC | 2.0 | 2.0 | 915 | $925 | $1.01 | 24d | 1 | 0.58mi |
| 7176 Fillyaw Rd Fayetteville, NC | 2.0 | 2.0 | 900 | $925 | $1.03 | 24d | 1 | 0.58mi |
| 841 Applewood Ln Unit 1 Fayetteville, NC | 2.0 | 2.0 | 1000 | $925 | $0.93 | 24d | 1 | 0.60mi |
| 6510 Cissna Dr Fayetteville, NC | 3.0 | 1.5 | 1100 | $1,095 | $1.00 | 15d | 1 | 0.75mi |
| 6521 Cissna Dr Fayetteville, NC | 3.0 | 2.0 | 1456 | $1,375 | $0.94 | 15d | 1 | 0.75mi |
| 6445 Independence Pl Dr Fayetteville, NC | 1.0–3.0 | 1.0–3.0 | 1106 | $1,779 | $1.61 | 15d | 18 | 0.83mi |
| 513 Roundtree Dr Fayetteville, NC | 3.0 | 2.0 | 1337 | $1,775 | $1.33 | 24d | 1 | 0.92mi |
| 894 Danish Dr Fayetteville, NC | 3.0 | 2.0 | 1475 | $1,695 | $1.15 | 24d | 1 | 1.03mi |
| 894 Danish Dr Unit 1 Fayetteville, NC | 3.0 | 2.5 | 1475 | $1,695 | $1.15 | 24d | 1 | 1.03mi |
| 726 Windy Hill Cir Unit 726-C Fayetteville, NC | 2.0 | 1.5 | 1100 | $1,099 | $1.00 | 24d | 1 | 1.05mi |
| 718 Windy Hill Cir Unit 718-B Fayetteville, NC | 2.0 | 1.5 | 1100 | $1,099 | $1.00 | 15d | 1 | 1.06mi |
| 872 Danish Dr Fayetteville, NC | 3.0 | 2.0 | 1285 | $1,600 | $1.25 | 24d | 1 | 1.08mi |
| 709 Windy Hill Cir Unit 709-D Fayetteville, NC | 2.0 | 1.5 | 1100 | $1,099 | $1.00 | 24d | 1 | 1.08mi |
| 716 Windy Hill Cir Unit 716-A Fayetteville, NC | 2.0 | 1.5 | 1100 | $1,025 | $0.93 | 24d | 1 | 1.08mi |
| 824 Danish Dr Fayetteville, NC | 3.0 | 2.5 | 1310 | $1,400 | $1.07 | 24d | 1 | 1.14mi |
| 6466 Kelmscot Ct Fayetteville, NC | 3.0 | 3.0 | 1409 | $1,635 | $1.16 | 24d | 1 | 1.23mi |
| 3639 Dornoch Dr Fayetteville, NC | 2.0 | 2.0 | 1000 | $1,025 | $1.02 | 24d | 1 | 1.25mi |
| 3633 Dornoch Dr Apt E Fayetteville, NC | 2.0 | 2.0 | 1000 | $1,025 | $1.02 | 24d | 1 | 1.29mi |
| 338 Summer Hill Rd Fayetteville, NC | 4.0 | 2.0 | 1474 | $1,550 | $1.05 | 24d | 1 | 1.30mi |
| 942 Stewarts Creek Dr #8 Fayetteville, NC | 2.0 | 2.0 | 1020 | $1,055 | $1.03 | 24d | 1 | 1.32mi |
| 942 Stewarts Creek Dr #9 Fayetteville, NC | 3.0 | 2.0 | 1250 | $1,250 | $1.00 | 24d | 1 | 1.32mi |
| 3627 Dornoch Dr Apt E Fayetteville, NC | 2.0 | 2.0 | 1000 | $950 | $0.95 | 24d | 1 | 1.32mi |
| 3627 Dornoch Dr Apt A Fayetteville, NC | 2.0 | 2.0 | 1000 | $1,025 | $1.02 | 24d | 1 | 1.32mi |
| 1429 Bozeman Loop Fayetteville, NC | 1.0–3.0 | 1.0–2.0 | 1001 | $1,500 | $1.50 | 15d | 24 | 1.34mi |
| 205 Brookford Ct Fayetteville, NC | 3.0 | 2.0 | 1196 | $1,640 | $1.37 | 24d | 1 | 1.34mi |
| 3619 Dornoch Dr Apt A Fayetteville, NC | 2.0 | 2.0 | 1000 | $1,025 | $1.02 | 15d | 1 | 1.38mi |
| 6471 Yadkin Rd Fayetteville, NC | 2.0 | 1.5 | 900 | $750 | $0.83 | 24d | 1 | 1.41mi |
| 890 Bedrock Dr Fayetteville, NC | 4.0 | 2.5 | 1484 | $1,650 | $1.11 | 24d | 1 | 1.43mi |
| 6809 Willowbrook Dr Fayetteville, NC | 2.0 | 2.0 | 1050 | $990 | $0.94 | 24d | 1 | 1.43mi |
| 111 Grande Oaks Dr Fayetteville, NC | 1.0–3.0 | 1.0–2.0 | 1205 | $1,645 | $1.37 | 15d | 46 | 1.43mi |
| 6467 Yadkin Rd Fayetteville, NC | 2.0 | 1.5 | 900 | $850 | $0.94 | 24d | 1 | 1.44mi |
| 6748 Willowbrook Dr #9 Fayetteville, NC | 2.0 | 2.0 | 1157 | $1,100 | $0.95 | 24d | 1 | 1.46mi |
| 1000 Wood Creek Dr #9 Fayetteville, NC | 2.0 | 2.0 | 1100 | $1,175 | $1.07 | 24d | 1 | 1.47mi |
| 1018 Wood Creek Dr #9 Fayetteville, NC | 3.0 | 2.0 | 1101 | $1,195 | $1.09 | 24d | 1 | 1.47mi |
| 6213 Sabine Dr Fayetteville, NC | 3.0 | 1.5 | 1092 | $1,175 | $1.08 | 24d | 1 | 1.48mi |
Listing history 21 events
-
2026-06-21days on market $155,000 Active 131 DOM
-
2026-06-18days on market $155,000 Active 128 DOM
-
2026-06-17days on market $155,000 Active 127 DOM
-
2026-06-16days on market $155,000 Active 126 DOM
-
2026-06-15days on market $155,000 Active 125 DOM
-
2026-06-14days on market $155,000 Active 123 DOM
-
2026-06-13days on market $155,000 Active 122 DOM
-
2026-06-10days on market $155,000 Active 120 DOM
-
2026-06-09days on market $155,000 Active 119 DOM
-
2026-06-08days on market $155,000 Active 118 DOM
-
2026-06-07days on market $155,000 Active 117 DOM
-
2026-06-03pricedays on market $155,000 Active 113 DOM
-
2026-06-02days on market $160,000 Active 112 DOM
-
2026-06-01days on market $160,000 Active 111 DOM
-
2026-05-31days on market $160,000 Active 110 DOM
-
2026-05-30days on market $160,000 Active 109 DOM
-
2026-04-28price $160,000
-
2026-04-09price $168,000
-
2026-03-09price $172,000
-
2026-02-10$180,000 Active
-
2026-02-06soldstatus $125,000
ⓘ Source: listings_history table (triggers on properties + properties_extension) + one-shot
backfill from property_details.listing_events for pre-trigger history.
Tax reassessment forecast NC · Resets to sale price
- Current annual tax
- $2,414 · $201/mo
- Projected year-2 tax
- $2,414 · $201/mo
- Expected delta
- $0/yr ($0/mo · 0.0%)
ⓘ Screening estimate from a state-policy table — verify with the county assessor before closing.
Climate risk First Street
- Flood 6/10 Major FEMA zone X (unshaded) · 75% chance over 30 yrs
- Wildfire 3/10 Moderate
- Heat 7/10 Severe 7 d/yr ≥106°F today · 16 d/yr by 30 yrs out
- Wind 7/10 Severe 78% chance of damaging wind over 30 yrs
- Air quality 2/10 Low 0 unhealthy d/yr today · 1 by 30 yrs out
Nearby sold comps map
Loading sold comps map…
Walkable amenities ~0.75 mi
Loading nearby amenities…
Taxation est. · year 1
- Rental income
- $16,664
- − Mortgage interest
- −$8,682
- − Property taxes
- −$2,414
- − Insurance
- −$775
- − Repairs & maintenance
- −$1,333
- − Management
- −$1,333
- − Depreciation
- −$4,509
- Taxable loss
- −$2,384
- Est. tax savings @ 24.0%
- +$572
- After-tax cash flow
- $793/yr
For passive investors: Depreciation is non-cash, so a rental often shows a tax loss while cash-flowing — sheltering income. Rental losses are passive: they offset passive income freely, and up to $25,000/yr can offset ordinary (W-2) income if you actively participate and your MAGI is under $100k (phasing out to $0 by $150k); unused losses carry forward. On sale, claimed depreciation is recaptured at up to 25%, and gains may owe capital-gains tax (a 1031 exchange can defer both). Figures are a year-1 estimate at your 24.0% rate — not tax advice; consult a CPA.
Schools (NCES district)
- District
- Cumberland County Schools
- NCES district ID
- 3700011
- Math proficiency
- 32% ▼ -2.00%
- Reading proficiency
- 41% ▼ -1.00%
- Median HH income
- $44,168
- Composite
- 31.0/100
- National rank
- #6096
- State rank
- #126 of 178 in NC
Livability — Fayetteville
- Score
- 75/100
- State rank
- #45
- US rank
- #4031
Category grades
Schools grade is shown separately in the Schools card above.
Census & demographics
- Census place
- Fayetteville, NC
- County
- Cumberland County · 265,314 people
- City population
- 226,118
- Metro
- Fayetteville, NC
- Population (ZIP)
- 30,965
- Household income
- $58,223
- Rent vs Own
- Severe rent burden
- 1370.0
Population outlook (Cumberland County) Hauer SSP2
- Today (2025)
- 330,855 people
- By 2030
- 333,523 · +0.8%
- By 2040
- 335,583 · +1.4%
- By 2050
- 335,325 · +1.4%
- By 2075
- 342,853 · +3.6%
- By 2100
- 340,698 · +3.0%
Race, ethnicity, and origin ACS 2023
- Neighborhood character
- Diverse neighborhood (Simpson 0.70)
- Race & ethnicity
- White 39% Black 37% Two or more races 11% Hispanic / Latino 10% Asian 4% Pacific Islander 1%
- Hispanic origin (detail)
- Mexican 2% Puerto Rican 3%
- Common ancestry
- Slovak 3% Serbian 1% Lithuanian 1%
- Foreign-born
- 9% · Canada, South Korea, Vietnam
- Languages at home
- 86% English-only · Spanish 7% Other Asian/Pacific 2% Korean 1%
Political lean MEDSL · Cumberland
- 2024 margin
- D (+13.4) · D 56.1% · R 42.7% · Other 1.2%
- 2008→2024 swing
- -4.3pp toward R · 2008: 17.7pp · 2024: 13.4pp
- All cycles
- 2024: D+13.4 2020: D+16.6 2016: D+16.0 2012: D+19.7 2008: D+17.7
Not yet ingested
- Civics
- —
Market trends
- HPI YoY
- ▼ -77.14%
- Current HPI
- 226.5097
- Rent YoY
- ▲ 3.01%
- Metro
- Fayetteville, NC
- State GDP YoY
- ▲ 3.28%
- F500 in state
- 26
Industry mix (Fortune 500 HQ in NC)
| Industry | F500 HQs | Revenue |
|---|---|---|
| Financial Services | 2 | $213B |
|
||
| Retail | 2 | $95B |
|
||
| Industrial Conglomerate | 1 | $38B |
|
||
| Metals / Steel | 1 | $35B |
|
||
| Utilities | 1 | $30B |
|
||
| Industrial Machinery | 1 | $19B |
|
||
Price history
+28.0% since first listed5 events — show timeline
- 2026-04-28 Price Changed $160,000 TMLS
- 2026-04-09 Price Changed $168,000 TMLS
- 2026-03-09 Price Changed $172,000 TMLS
- 2026-02-10 Listed $180,000 TMLS
- 2026-02-06 Sold (Public Records) $125,000 Public Records
Property tax history
+4.6%/yrLatest (2025): $2,414 · +37.7% YoY. Source: county tax records.
Cash-flow waterfall
monthlySold comps — $/sqft
last 12 mo · ≤1 miLoading sold comps…