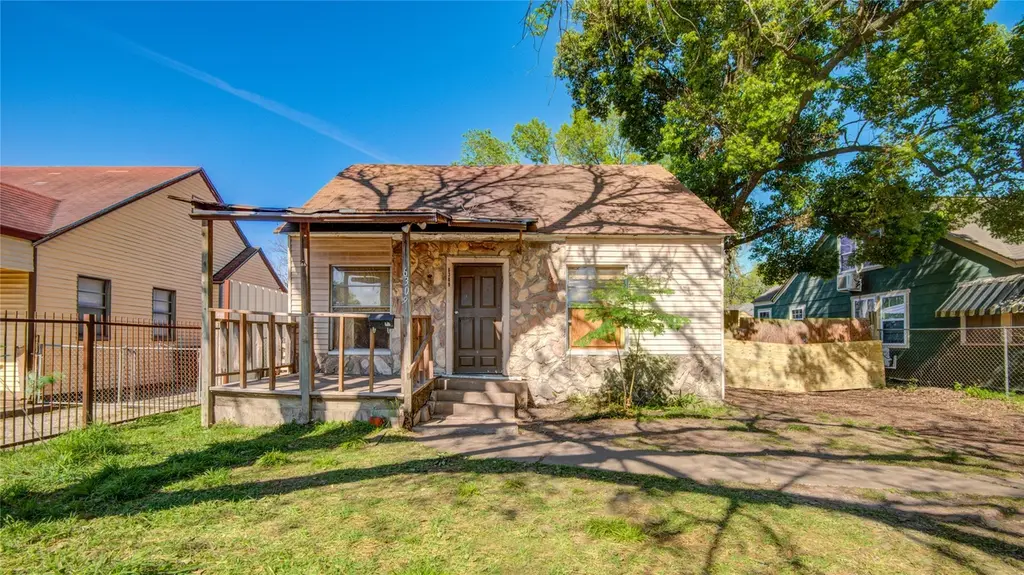
6309 Buford St · Houston, TX
Flood risk 4/10 · Minor
- FEMA flood zone
- X (unshaded)
- Chance of flooding over 30 yrs
- 0.24%
- Est. flood insurance / yr
- $507 – $1,088
Fire risk 1/10 · Minimal
- Est. fire insurance / yr
- $1,222 – $2,270
Heat risk 9/10 · Severe
- Hot days now (above 109°F)
- 7 days/yr
- Hot days in 30 yrs
- 22 days/yr
Wind risk 9/10 · Severe
- Chance of severe wind over 30 yrs
- 99.0%
Air-quality risk 2/10 · Minimal
- Unhealthy air days now
- 2 days/yr
- Unhealthy air days in 30 yrs
- 2 days/yr
Risk factors via First Street. Map © Google.
Why this score? — see what drove the C- grade
The composite is a weighted blend of 9 inputs, each scored 0–100. Each bar is that input's sub-score; the figure is the points it added to the 100-point composite (weight × sub-score).
- Cash flow +15.3/30.0
- ARV discount +15.0/15.0
- 1% rule +4.8/10.0
- DSCR +4.7/10.0
- Livability +3.7/5.0
- Rent growth +3.1/5.0
- Schools +2.7/10.0
- Condition / age +2.5/5.0
- Appreciation +0.0/10.0
$115,000
🖨 Deal sheet (PDF) 📄 Offer letter ✓ Due diligence
Listing remarks MLS
Opportunity in a revitalizing Houston area! This property offers strong potential for owner-occupants looking to renovate and build equity, as well as investors seeking their next project. Situated on a spacious lot with mature trees, the home features a functional layout ready for a full rehab. Extensive repairs are needed, providing a blank canvas to customize and add value. Conveniently located with easy access to major freeways, Downtown Houston, employment centers, shopping, and dining. Surrounded by ongoing redevelopment and new construction, supporting future upside. Property is sold as-is, where-is. Ideal for buyers with vision looking to transform this property into a primary residence or income-producing asset. This property has been placed in an upcoming auction event. Please contact your realtor/listing agent for guidance in submitting your bid.
Key facts
- 5,501 sq ft lot
- Parking
- Built 1938
Neighborhood map
What this means for you Summary
Snapshot
- This is a 2-bed/1.0-bath single-family listed at $115k.
Deal economics
- At list price, monthly cash flow is $42 ($509/yr) — positive.
- The deal already cash-flows at list — no discount required.
- To meet the 1% rule (rent ≥ 1% of price), the offer needs to be $112k (2.3% below list).
- Recommended offer: $112k (2.3% below list) — sets the bar for 1% rule.
- Cap rate 6.7% vs local median 3.2% in Houston — top-decile yield for the area; either an underpriced asset or a hidden risk that comps aren't pricing in. Stress-test before assuming the spread holds.
Location & tenants
- Location reads 74/100 on livability (#184 in TX, #4,771 nationally) — a middle-class / working-renter tenant base. Strengths: amenities A+, cost of living A+, housing A+; Watch: crime F.
- Houston ISD (urban): math 27% / reading 35% proficiency, ranked #593 of 826 in TX (top 72%) — families likely to look elsewhere, expect single-tenant / working-renter base with shorter leases; 71% free/reduced lunch — lower-income household profile, screen leases tightly.
- Zoned schools: Brookline El (math 38% / reading 45%, grade F, #1,437 of 4,322 statewide, top 34%, 732 students, 98% FRL); Navarro Middle (math 8% / reading 13%, grade F, #1,639 of 1,662 statewide, top 99%, 547 students, 98% FRL); Austin H S (math 9% / reading 18%, grade F, #1,530 of 1,632 statewide, top 94%, 1,448 students, 97% FRL) — zoned schools average 98% FRL vs 71% district-wide (27 pts higher); higher-poverty schools than district average — tighter screening recommended.
- Market conditions: Rents rising (+2.4%/yr); 170 active listings in the ZIP; 40 comparable units currently listed for rent nearby; rentals at typical pace (median 22d on market — plan ~3-4 weeks tenant-placement turnaround); 29,883 units permitted in Harris County in 2024 (8,621 in 5+ unit buildings).
Forward outlook
- Local home prices are declining (-3.0%/yr); year-one equity from $795 of loan paydown is wiped out by about $3k of value loss. Plan a longer hold.
- Harris County population projected at +47% by 2050 — long-run rental-demand tailwind backs the buy-and-hold thesis.
Negotiation context
- Only 1 days on market — expect competitive offers; lowballing is unlikely to land.
Risks & watch-outs
- Watch-outs: built in 1938 — expect roof / HVAC / electrical / plumbing capex.
- Climate carrying-cost: severe wind risk, 99% chance of damaging wind over 30y; extreme-heat days projected 7→22/yr by 2055 (HVAC capex compounding) — expect insurance premiums to compound above CPI over the hold.
Questions for the listing agent
- Built in 1938 — when were the roof, HVAC, electrical panel, plumbing, and water heater last replaced?
- Is there a deadline driving the sale (1031 exchange, divorce, estate, relocation)? That informs how much negotiation room exists.
- Schools are D-rated, which usually means shorter tenancies and higher turnover. Who's the typical renter profile here, and what's been the actual vacancy rate?
- Crime grade is F in this area — have there been break-ins, vandalism, or insurance claims at this property in the last 3 years? What carrier currently insures it and at what premium?
- What's the average days-on-market for RENTAL listings here right now (not sales)? A rising rental-DOM trend means longer vacancies and softer asking-rent achievability than the comps imply.
- What's the recent tenant-quality profile in this submarket — average credit score on applications, eviction rate, late-payment / NSF rate, and stable-employment percentage? A property-management company in the area should have these aggregated.
- How much new for-sale + rental construction is in the pipeline within 1–3 miles? Heavy new supply typically softens prices + rents 12–24 months out; constrained supply supports both.
Investment metrics
- 1% rule
- 0.98% ✗
- Cap rate
- 6.74%
- Cash-on-cash
- 1.58%
- DSCR
- 1.07
- GRM
- 8.5
CMA / ARV
- ARV (on-the-fly)
- $178,464
- Comps found
- 4
Show comp detail 4 sales within ~0.75 mi
| Address | Dist | Beds/Ba | Sqft | Sold | Price | $/sf | Match |
|---|---|---|---|---|---|---|---|
| 6309 Buford St | 0.00mi | 2/1.0 | 858 (0%) | 3mo | $70,000 | $82 | 98 |
| 6415 Stillwell St | 0.13mi | 2/1.0 | 840 (-2%) | 9mo | $175,000 | $208 | 83 |
| 2715 Oakcliff St | 0.52mi | 2/1.0 | 810 (-6%) | 2mo | $130,000 | $160 | 65 |
| 4042 Wynona St | 0.54mi | 2/1.0 | 930 (+8%) | 13mo | $224,900 | $242 | 50 |
Match score weights: distance 35% · size 25% · config 20% · recency 20%. Top-matched comps best support the ARV.
Projected returns pro-forma
-3.0% appreciation · 2.43% rent growth · sell at horizon
- IRR
- -14.4%
- Equity multiple
- 0.49×
- Total profit
- $-16,528
- Equity at exit
- $17,147
- IRR
- -6.6%
- Equity multiple
- 0.59×
- Total profit
- $-13,321
- Equity at exit
- $9,943
Cash invested: $32,200 (down + closing). Projections, not guarantees.
Landlord ↔ Tenant lean methodology
- Overall (STATE)
- 87 Strongly Landlord-Friendly
- State Texas
- 87 Strongly Landlord-Friendly · R+5
- County
- — inherits STATE
- City
- — inherits STATE
ZIP-level market 77023
- Rents YoY
- 2.4%
- Active inventory
- 170
- Price-to-rent
- 8.5×
Monthly cashflow live
- Estimated rent
- $1,124 high interval (Pro) →
- Mortgage (P&I)
- −$603
- Tax from tax record
- −$195 /mo · $2,335/yr
- Insurance
- −$48
- HOA
- −$0
- Vacancy / Maint / Mgmt
- −$236
- Net cashflow
- $42
Break-even live
Sensitivity live
| Price | -10% $107 | -5% $75 | +0% $42 | +5% $10 | +10% $-23 |
|---|---|---|---|---|---|
| Rent | -10% $-46 | -5% $-2 | +0% $42 | +5% $87 | +10% $131 |
| Rate | -1.0pp $100 | -0.5pp $72 | base $42 | +0.5pp $13 | +1.0pp $-18 |
UW: 25.0% down · 7.5% · 30yr · 1.5% tax · 5.0% vac · 8.0% maint · 8.0% mgmt
Financing live
Cash to close
- Down payment
- $28,750
- Closing costs
- $3,450
- Reserves months
- —
- Total cash needed
- —
Loan-product check · same deal, 3 products live
Conventional
25% down · 7.5% · 30yr
- Down + closing
- —
- Monthly P&I
- —
- Monthly cashflow
- —
- DSCR
- —
- Eligible?
- —
Personal DTI + credit; lowest rate.
DSCR
20% down · 8.5% · 30yr
- Down + closing
- —
- Monthly P&I
- —
- Monthly cashflow
- —
- DSCR
- —
- Eligible?
- —
No personal income docs; deal must DSCR.
Hard money
10% down · 12.0% · 12mo
- Down + closing
- —
- Monthly P&I
- —
- Monthly cashflow
- —
- DSCR
- —
- Eligible?
- —
Short-term bridge; refi at stabilization.
Rent comps 40 comps
| Address | Beds | Baths | Sqft | Rent | $/sqft | DOM | Units | Dist |
|---|---|---|---|---|---|---|---|---|
| 2606 Beatty St Houston, TX | 2.0 | 1.0 | 700 | $950 | $1.36 | 26d | 1 | 0.06mi |
| 2606 Beatty St Unit 224 Houston, TX | 2.0 | 1.5 | 700 | $950 | $1.36 | 26d | 1 | 0.08mi |
| 3852 Telephone Rd Houston, TX | 1.0–3.0 | 1.0–2.0 | 911 | $1,308 | $1.43 | 0d | 16 | 0.22mi |
| 6534 Myrtle St Unit B Houston, TX | 1.0 | 1.0 | 529 | $999 | $1.89 | 24d | 1 | 0.54mi |
| 123 Winkler Dr Unit 1112 Houston, TX | 1.0 | 1.0 | 738 | $1,040 | $1.41 | 0d | 1 | 0.63mi |
| 123 Winkler Dr Unit 180 Houston, TX | 2.0 | 2.0 | 932 | $1,128 | $1.21 | 13d | 1 | 0.63mi |
| 123 Winkler Dr Unit 324 Houston, TX | 1.0 | 1.0 | 738 | $1,000 | $1.36 | 9d | 1 | 0.63mi |
| 123 Winkler Dr Unit 2165 Houston, TX | 2.0 | 2.0 | 932 | $1,139 | $1.22 | 0d | 1 | 0.63mi |
| 123 Winkler Dr Unit 144 Houston, TX | 1.0 | 1.0 | 738 | $1,035 | $1.40 | 16d | 1 | 0.63mi |
| 123 Winkler Dr Unit 422 Houston, TX | 2.0 | 2.0 | 932 | $1,104 | $1.18 | 9d | 1 | 0.63mi |
| 123 Winkler Dr Unit 197 Houston, TX | 1.0 | 1.0 | 738 | $1,039 | $1.41 | 13d | 1 | 0.63mi |
| 123 Winkler Dr Houston, TX | 1.0 | 1.0 | 738 | $989 | $1.34 | 14d | 1 | 0.64mi |
| 2801 Carrolton St Houston, TX | 1.0–2.0 | 1.0 | 650 | $849 | $1.31 | 45d | 2 | 0.65mi |
| 2801 Carrolton St Houston, TX | 1.0–2.0 | 1.0 | 650 | $899 | $1.38 | 3d | 4 | 0.65mi |
| 123 Winkler Dr Unit 2047 Houston, TX | 2.0 | 2.0 | 932 | $1,128 | $1.21 | 5d | 1 | 0.65mi |
| 123 Winkler Dr Unit 2047 Houston, TX | 2.0 | 2.0 | 932 | $1,139 | $1.22 | 13d | 1 | 0.65mi |
| 129 Winkler Dr Houston, TX | 2.0 | 1.0 | 932 | $1,130 | $1.21 | 45d | 1 | 0.70mi |
| 3040 Golfcrest Blvd Apt 11 Houston, TX | 1.0 | 1.0 | 644 | $745 | $1.16 | 45d | 1 | 0.76mi |
| 2518 Lidstone St #8 Houston, TX | 1.0 | 1.0 | 550 | $1,279 | $2.33 | 45d | 1 | 0.79mi |
| 2248 Marlo St Houston, TX | 2.0 | 1.0 | 1048 | $1,499 | $1.43 | 1d | 1 | 0.80mi |
| 3045 Golfcrest Blvd Houston, TX | 1.0 | 1.0 | 550 | $850 | $1.55 | 45d | 1 | 0.81mi |
| 2930 Plum Creek Ln Houston, TX | 1.0–2.0 | 1.0–2.0 | 820 | $1,500 | $1.83 | 1d | 7 | 0.85mi |
| 2936 Plum Creek Ln Houston, TX | 2.0 | 2.0 | 924 | $1,345 | $1.46 | 45d | 1 | 0.90mi |
| 916 Redwood St Houston, TX | 2.0 | 1.0 | 975 | $985 | $1.01 | 45d | 1 | 0.93mi |
| 916 Redwood St Houston, TX | 2.0 | 1.0 | 975 | $985 | $1.01 | 24d | 1 | 0.93mi |
| 6519 Sloan St #8 Houston, TX | 1.0 | 1.0 | 650 | $699 | $1.08 | 9d | 1 | 0.98mi |
| 5532 Eskridge St Houston, TX | 2.0 | 1.0 | 885 | $899 | $1.02 | 45d | 1 | 1.02mi |
| 5532 Eskridge St Houston, TX | 2.0 | 1.0 | 810 | $899 | $1.11 | 17d | 1 | 1.02mi |
| 6705 Fairway Dr Houston, TX | 1.0 | 1.0 | 550 | $750 | $1.36 | 15d | 2 | 1.02mi |
| 6601 Meadowlawn St Unit 3 Houston, TX | 1.0 | 1.0 | 785 | $989 | $1.26 | 20d | 1 | 1.04mi |
| 3810 Weslow St Unit B Houston, TX | 2.0 | 1.0 | 924 | $1,149 | $1.24 | 9d | 1 | 1.04mi |
| 3810 Weslow St Houston, TX | 2.0 | 1.0 | 924 | $1,449 | $1.57 | 45d | 1 | 1.04mi |
| 6620 Lawndale St Houston, TX | 2.0 | 1.0 | 901 | $1,700 | $1.89 | 45d | 1 | 1.05mi |
| 7132 Lawndale St Houston, TX | 1.0–2.0 | 1.0 | 725 | $1,297 | $1.79 | 0d | 7 | 1.21mi |
| 1023 Delmas St Unit B Houston, TX | 2.0 | 1.0 | 637 | $999 | $1.57 | 21d | 1 | 1.21mi |
| 7138 Lawndale St Houston, TX | 1.0 | 1.0 | 650 | $975 | $1.50 | 45d | 1 | 1.24mi |
| 1016 S Wayside Dr Houston, TX | 3.0 | 2.0 | 1021 | $1,425 | $1.40 | 45d | 1 | 1.24mi |
| 1010 S Wayside Dr Houston, TX | 1.0 | 1.0 | 700 | $1,255 | $1.79 | 45d | 1 | 1.28mi |
| 1010 S Wayside Dr Unit 504 Houston, TX | 2.0 | 1.0 | 844 | $1,398 | $1.66 | 45d | 1 | 1.28mi |
| 1010 S Wayside Dr Unit 505 Houston, TX | 2.0 | 1.0 | 844 | $1,602 | $1.90 | 45d | 1 | 1.28mi |
Listing history 2 events
-
2026-06-02remarks 502-char remark
-
2026-06-02$115,000 Coming Soon 1 DOM
ⓘ Source: listings_history table (triggers on properties + properties_extension) + one-shot
backfill from property_details.listing_events for pre-trigger history.
Tax reassessment forecast TX · Resets to sale price
- Current annual tax
- $2,335 · $195/mo
- Projected year-2 tax
- $2,335 · $195/mo
- Expected delta
- $0/yr ($0/mo · 0.0%)
ⓘ Screening estimate from a state-policy table — verify with the county assessor before closing.
Climate risk First Street
- Flood 4/10 Moderate FEMA zone X (unshaded) · 24% chance over 30 yrs
- Wildfire 1/10 Low
- Heat 9/10 Extreme 7 d/yr ≥109°F today · 22 d/yr by 30 yrs out
- Wind 9/10 Extreme 99% chance of damaging wind over 30 yrs
- Air quality 2/10 Low 2 unhealthy d/yr today · 2 by 30 yrs out
Nearby sold comps map
Loading sold comps map…
Walkable amenities ~0.75 mi
Loading nearby amenities…
Taxation est. · year 1
- Rental income
- $13,488
- − Mortgage interest
- −$6,442
- − Property taxes
- −$2,335
- − Insurance
- −$575
- − Repairs & maintenance
- −$1,079
- − Management
- −$1,079
- − Depreciation
- −$3,345
- Taxable loss
- −$1,367
- Est. tax savings @ 24.0%
- +$328
- After-tax cash flow
- $837/yr
For passive investors: Depreciation is non-cash, so a rental often shows a tax loss while cash-flowing — sheltering income. Rental losses are passive: they offset passive income freely, and up to $25,000/yr can offset ordinary (W-2) income if you actively participate and your MAGI is under $100k (phasing out to $0 by $150k); unused losses carry forward. On sale, claimed depreciation is recaptured at up to 25%, and gains may owe capital-gains tax (a 1031 exchange can defer both). Figures are a year-1 estimate at your 24.0% rate — not tax advice; consult a CPA.
Schools (NCES district)
- District
- Houston ISD
- NCES district ID
- 4823640
- Math proficiency
- 27% ▼ -18.00%
- Reading proficiency
- 35% ▼ -6.00%
- Median HH income
- $46,054
- Composite
- 26.63/100
- National rank
- #7173
- State rank
- #593 of 826 in TX
Livability — Houston
- Score
- 74/100
- State rank
- #184
- US rank
- #4771
Category grades
Schools grade is shown separately in the Schools card above.
Census & demographics
- Census place
- Houston, TX
- County
- Harris County · 4,702,590 people
- City population
- 3,226,434
- Metro
- Houston-The Woodlands-Sugar Land, TX
- Population (ZIP)
- 24,281
- Household income
- $51,430
- Rent vs Own
- Severe rent burden
- 1311.0
Population outlook (Harris County) Hauer SSP2
- Today (2025)
- 5,571,493 people
- By 2030
- 6,089,821 · +9.3%
- By 2040
- 7,142,806 · +28.2%
- By 2050
- 8,185,864 · +46.9%
- By 2075
- 10,574,329 · +89.8%
- By 2100
- 12,109,958 · +117.4%
Race, ethnicity, and origin ACS 2023
- Neighborhood character
- Predominantly Hispanic (77%)
- Race & ethnicity
- Hispanic / Latino 77% Two or more races 24% White 16% Black 4% Asian 2%
- Hispanic origin (detail)
- Mexican 64% Puerto Rican 1%
- Common ancestry
- Lithuanian 1% Italian 1% Romanian 1%
- Foreign-born
- 23% · Canada, China, Vietnam
- Languages at home
- 36% English-only · Spanish 62%
Political lean MEDSL · Harris
- 2024 margin
- Lean D (+5.5) · D 52.0% · R 46.4% · Other 1.6%
- 2008→2024 swing
- +3.9pp toward D · 2008: 1.6pp · 2024: 5.5pp
- All cycles
- 2024: D+5.5 2020: D+13.3 2016: D+12.4 2012: D+0.1 2008: D+1.6
Not yet ingested
- Civics
- —
Market trends
- HPI YoY
- ▼ -162.09%
- Current HPI
- 284.0587
- Rent YoY
- ▲ 2.43%
- Metro
- Houston-The Woodlands-Sugar Land, TX
- State GDP YoY
- ▲ 3.95%
- F500 in state
- 110
Industry mix (Fortune 500 HQ in TX)
| Industry | F500 HQs | Revenue |
|---|---|---|
| Energy | 16 | $1,198B |
|
||
| Technology | 5 | $198B |
|
||
| Engineering / Construction | 4 | $72B |
|
||
| Energy Services | 3 | $60B |
|
||
| Utilities | 3 | $41B |
|
||
| Healthcare | 2 | $330B |
|
||
Price history
+64.3% since first listed5 events — show timeline
- 2026-06-02 Coming Soon $115,000 HARMLS
- 2026-04-03 Sold (MLS) — HARMLS
- 2026-04-01 Pending — HARMLS
- 2026-03-26 Listed $70,000 HARMLS
- 1990-12-31 Sold (Public Records) — Public Records
Property tax history
+2.9%/yrLatest (2025): $2,335 · +21.8% YoY. Source: county tax records.
Cash-flow waterfall
monthlySold comps — $/sqft
last 12 mo · ≤1 miLoading sold comps…