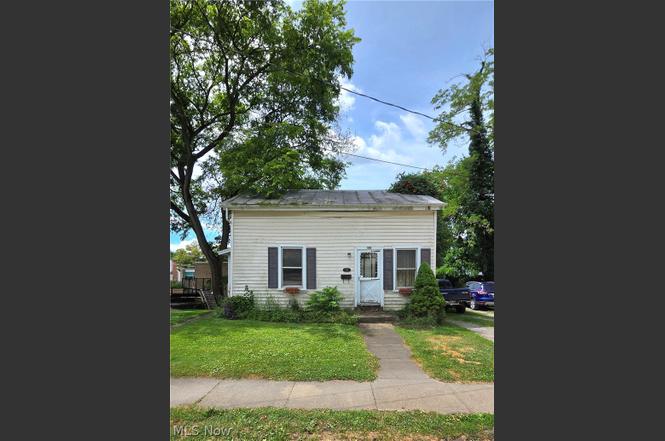
106 Mill St · Lodi, OH
Flood risk 1/10 · Minimal
- FEMA flood zone
- X (unshaded)
- Chance of flooding over 30 yrs
- 0.0%
- Est. flood insurance / yr
- $473 – $860
Fire risk 3/10 · Minor
- Est. fire insurance / yr
- $713 – $1,323
Heat risk 3/10 · Minor
- Hot days now (above 97°F)
- 7 days/yr
- Hot days in 30 yrs
- 16 days/yr
Wind risk 1/10 · Minimal
- Chance of severe wind over 30 yrs
- —
Air-quality risk 2/10 · Minimal
- Unhealthy air days now
- 0 days/yr
- Unhealthy air days in 30 yrs
- 1 days/yr
Risk factors via First Street. Map © Google.
Why this score? — see what drove the B grade
The composite is a weighted blend of 9 inputs, each scored 0–100. Each bar is that input's sub-score; the figure is the points it added to the 100-point composite (weight × sub-score).
- Cash flow +30.0/30.0
- DSCR +10.0/10.0
- 1% rule +9.9/10.0
- ARV discount +7.5/15.0
- Schools +5.6/10.0
- Livability +3.3/5.0
- Rent growth +2.5/5.0
- Condition / age +2.5/5.0
- Appreciation +0.0/10.0
$68,000
🖨 Deal sheet (PDF) 📄 Offer letter ✓ Due diligence
Listing remarks
Investor special! 3-bed 1-bath Located right in Lodi. Ready for your personal touch.
Key facts
- 3,598 sq ft lot
- Built 1905
- Listed 3 days
Property features AI
Exterior
- Parking: Unpaved parking area
- Utilities: Public water; Public sewer
- Home design: Single-story entry (main living on one level)
- Construction: Vinyl siding; Metal roof; Approximately 900 above-grade finished area
- Exterior features: Unpaved parking; Lot recorded at 0.0826 acres
Interior
- Bedrooms: 2 main-level bedrooms
- Bathrooms: 1 full bathroom on the main level
- Heating & cooling: Forced-air heating; Gas heating
- Interior features: Full basement
Neighborhood map
What this means for you Summary
Snapshot
- This is a 2-bed/1.0-bath single-family listed at $68k.
Deal economics
- At list price, monthly cash flow is $302 ($4k/yr) — positive.
- The deal already cash-flows at list — no discount required.
- Meets the 1% rule at list price ($1k rent vs $68k).
- Cap rate 11.6% vs local median 2.3% in Lodi — top-decile yield for the area; either an underpriced asset or a hidden risk that comps aren't pricing in. Stress-test before assuming the spread holds.
Location & tenants
- Location reads 66/100 on livability (#655 in OH) — a middle-class / working-renter tenant base. Strengths: crime A+, cost of living A+, housing A+; Watch: amenities F, commute F, employment D-.
- Cloverleaf Local (rural): math 61% / reading 68% proficiency, ranked #205 of 656 in OH (top 31%) — acceptable for families but not a draw, mixed tenant base, ~2y average lease.
- Market conditions: 34 active listings in the ZIP; 3 comparable units currently listed for rent nearby; rentals at typical pace (median 17d on market — plan ~3-4 weeks tenant-placement turnaround); 471 units permitted in Medina County in 2024 (0 in 5+ unit buildings).
Forward outlook
- Local home prices are declining (-3.0%/yr); year-one equity from $470 of loan paydown is wiped out by about $2k of value loss. Plan a longer hold.
- At projected returns (-3.0% appreciation + 3.0% rent growth), your $19k cash investment doubles in ~7 years — after that, you're playing with house money.
Negotiation context
- Only 4 days on market — expect competitive offers; lowballing is unlikely to land.
Risks & watch-outs
- Watch-outs: built in 1905 — expect roof / HVAC / electrical / plumbing capex.
Questions for the listing agent
- Built in 1905 — when were the roof, HVAC, electrical panel, plumbing, and water heater last replaced?
- Is there a deadline driving the sale (1031 exchange, divorce, estate, relocation)? That informs how much negotiation room exists.
- What's the average days-on-market for RENTAL listings here right now (not sales)? A rising rental-DOM trend means longer vacancies and softer asking-rent achievability than the comps imply.
- What's the recent tenant-quality profile in this submarket — average credit score on applications, eviction rate, late-payment / NSF rate, and stable-employment percentage? A property-management company in the area should have these aggregated.
- How much new for-sale + rental construction is in the pipeline within 1–3 miles? Heavy new supply typically softens prices + rents 12–24 months out; constrained supply supports both.
Investment metrics
- 1% rule
- 1.49% ✓
- Cap rate
- 11.63%
- Cash-on-cash
- 19.06%
- DSCR
- 1.85
- GRM
- 5.6
CMA / ARV
- ARV (on-the-fly)
- $191,700
- Comps found
- 4
Show comp detail 4 sales within ~0.75 mi
| Address | Dist | Beds/Ba | Sqft | Sold | Price | $/sf | Match |
|---|---|---|---|---|---|---|---|
| 107 Grandview Dr | 0.32mi | 2/1.5 | 912 (+1%) | 0mo | $210,000 | $230 | 80 |
| 207 Gaylord St | 0.26mi | 2/1.0 | 870 (-3%) | 7mo | $105,000 | $121 | 76 |
| 110 Grove St | 0.55mi | 3/2.0 (+1) | 988 (+10%) | 9mo | $210,000 | $213 | 42 |
| 121 Howe St | 0.59mi | 2/1.0 | 784 (-13%) | 17mo | $105,000 | $134 | 37 |
Match score weights: distance 35% · size 25% · config 20% · recency 20%. Top-matched comps best support the ARV.
Projected returns pro-forma
-3.0% appreciation · 3.0% rent growth · sell at horizon
- IRR
- 11.0%
- Equity multiple
- 1.43×
- Total profit
- $8,269
- Equity at exit
- $10,139
- IRR
- 20.0%
- Equity multiple
- 2.69×
- Total profit
- $32,122
- Equity at exit
- $5,879
Cash invested: $19,040 (down + closing). Projections, not guarantees.
Landlord ↔ Tenant lean methodology
- Overall (STATE)
- 73 Landlord-Friendly
- State Ohio
- 73 Landlord-Friendly · R+6
- County
- — inherits STATE
- City
- — inherits STATE
ZIP-level market 44254
- Home prices YoY
- -27.7%
- Active inventory
- 34
- Price-to-rent
- 5.6×
Monthly cashflow live
- Estimated rent
- $1,010 medium interval (Pro) →
- Mortgage (P&I)
- −$357
- Tax from tax record
- −$111 /mo · $1,327/yr
- Insurance
- −$28
- HOA
- −$0
- Vacancy / Maint / Mgmt
- −$212
- Net cashflow
- $302
Break-even live
Sensitivity live
| Price | -10% $341 | -5% $322 | +0% $302 | +5% $283 | +10% $264 |
|---|---|---|---|---|---|
| Rent | -10% $223 | -5% $262 | +0% $302 | +5% $342 | +10% $382 |
| Rate | -1.0pp $337 | -0.5pp $320 | base $302 | +0.5pp $285 | +1.0pp $267 |
UW: 25.0% down · 7.5% · 30yr · 1.5% tax · 5.0% vac · 8.0% maint · 8.0% mgmt
Financing live
Cash to close
- Down payment
- $17,000
- Closing costs
- $2,040
- Reserves months
- —
- Total cash needed
- —
Loan-product check · same deal, 3 products live
Conventional
25% down · 7.5% · 30yr
- Down + closing
- —
- Monthly P&I
- —
- Monthly cashflow
- —
- DSCR
- —
- Eligible?
- —
Personal DTI + credit; lowest rate.
DSCR
20% down · 8.5% · 30yr
- Down + closing
- —
- Monthly P&I
- —
- Monthly cashflow
- —
- DSCR
- —
- Eligible?
- —
No personal income docs; deal must DSCR.
Hard money
10% down · 12.0% · 12mo
- Down + closing
- —
- Monthly P&I
- —
- Monthly cashflow
- —
- DSCR
- —
- Eligible?
- —
Short-term bridge; refi at stabilization.
Rent comps 3 comps
| Address | Beds | Baths | Sqft | Rent | $/sqft | DOM | Units | Dist |
|---|---|---|---|---|---|---|---|---|
| 201 Elyria St Unit 5 Lodi, OH | 1.0 | 1.0 | 800 | $995 | $1.24 | 2d | 1 | 0.10mi |
| 145 Harris St Unit 145 1/2 Lodi, OH | 3.0 | 1.0 | 680 | $1,100 | $1.62 | 17d | 1 | 0.22mi |
| 614 Highland Dr Lodi, OH | 2.0 | 1.0 | 725 | $850 | $1.17 | 24d | 1 | 0.73mi |
Listing history 3 events
-
2026-06-21days on market $68,000 Active 4 DOM
-
2026-06-18remarks 84-char remark
-
2026-06-18$68,000 Active 1 DOM
ⓘ Source: listings_history table (triggers on properties + properties_extension) + one-shot
backfill from property_details.listing_events for pre-trigger history.
Tax reassessment forecast OH · Partial reset (capped growth)
- Current annual tax
- $1,327 · $111/mo
- Projected year-2 tax
- $1,327 · $111/mo
- Expected delta
- $0/yr ($0/mo · 0.0%)
ⓘ Screening estimate from a state-policy table — verify with the county assessor before closing.
Climate risk First Street
- Flood 1/10 Low FEMA zone X (unshaded) · 0% chance over 30 yrs
- Wildfire 3/10 Moderate
- Heat 3/10 Moderate 7 d/yr ≥97°F today · 16 d/yr by 30 yrs out
- Wind 1/10 Low
- Air quality 2/10 Low 0 unhealthy d/yr today · 1 by 30 yrs out
Nearby sold comps map
Loading sold comps map…
Walkable amenities ~0.75 mi
Loading nearby amenities…
Taxation est. · year 1
- Rental income
- $12,119
- − Mortgage interest
- −$3,809
- − Property taxes
- −$1,327
- − Insurance
- −$340
- − Repairs & maintenance
- −$970
- − Management
- −$970
- − Depreciation
- −$1,978
- Taxable income
- $2,726
- Est. tax owed @ 24.0%
- −$654
- After-tax cash flow
- $2,974/yr
For passive investors: Depreciation is non-cash, so a rental often shows a tax loss while cash-flowing — sheltering income. Rental losses are passive: they offset passive income freely, and up to $25,000/yr can offset ordinary (W-2) income if you actively participate and your MAGI is under $100k (phasing out to $0 by $150k); unused losses carry forward. On sale, claimed depreciation is recaptured at up to 25%, and gains may owe capital-gains tax (a 1031 exchange can defer both). Figures are a year-1 estimate at your 24.0% rate — not tax advice; consult a CPA.
Schools (NCES district)
- District
- Cloverleaf Local
- NCES district ID
- 3904848
- Math proficiency
- 61% ▼ -16.00%
- Reading proficiency
- 68% ▼ -6.00%
- Median HH income
- $58,407
- Composite
- 55.59/100
- National rank
- #1235
- State rank
- #205 of 656 in OH
Livability — Lodi
- Score
- 66/100
- State rank
- #655
- US rank
- #11612
Category grades
Schools grade is shown separately in the Schools card above.
Census & demographics
- Census place
- Lodi, OH
- County
- Medina · 181,928 people
- Metro
- Cleveland, OH
- Population (ZIP)
- 4,857
- Household income
- $64,511
- Rent vs Own
- Severe rent burden
- 7.9
Population outlook (Medina County) Hauer SSP2
- Today (2025)
- 185,249 people
- By 2030
- 188,174 · +1.6%
- By 2040
- 190,350 · +2.8%
- By 2050
- 187,283 · +1.1%
- By 2075
- 177,108 · -4.4%
- By 2100
- 151,304 · -18.3%
Race, ethnicity, and origin ACS 2023
- Neighborhood character
- Predominantly White (93%)
- Race & ethnicity
- White 93% Hispanic / Latino 3% Two or more races 2% Asian 1%
- Common ancestry
- Romanian 5% Slovak 3% Lithuanian 1%
- Foreign-born
- 2% · China
- Languages at home
- 94% English-only · German/W. Germanic 2% Spanish 2% Chinese 2%
Political lean MEDSL · Medina
- 2024 margin
- Strong R (+24.8) · D 37.2% · R 62.0%
- 2008→2024 swing
- -16.8pp toward R · 2008: -8.0pp · 2024: -24.8pp
- All cycles
- 2024: R+24.8 2020: R+23.4 2016: R+24.9 2012: R+13.1 2008: R+8.0
Not yet ingested
- Civics
- —
Market trends
- HPI YoY
- ▼ -82.87%
- Current HPI
- 216.6444
- Rent YoY
- —
- Metro
- —
- State GDP YoY
- ▲ 1.98%
- F500 in state
- 48
Industry mix (Fortune 500 HQ in OH)
| Industry | F500 HQs | Revenue |
|---|---|---|
| Insurance | 3 | $145B |
|
||
| Industrial Machinery | 3 | $49B |
|
||
| Financial Services | 3 | $24B |
|
||
| Consumer Goods | 2 | $93B |
|
||
| Aerospace / Defense | 2 | $47B |
|
||
| Utilities | 2 | $33B |
|
||
Price history
+3.2% since first listed2 events — show timeline
- 2026-06-17 Listed $68,000 MLSNOW
- 2004-08-06 Sold (Public Records) $65,900 Public Records
Property tax history
+1.8%/yrLatest (2025): $1,327 · +11.5% YoY. Source: county tax records.
Cash-flow waterfall
monthlySold comps — $/sqft
last 12 mo · ≤1 miLoading sold comps…