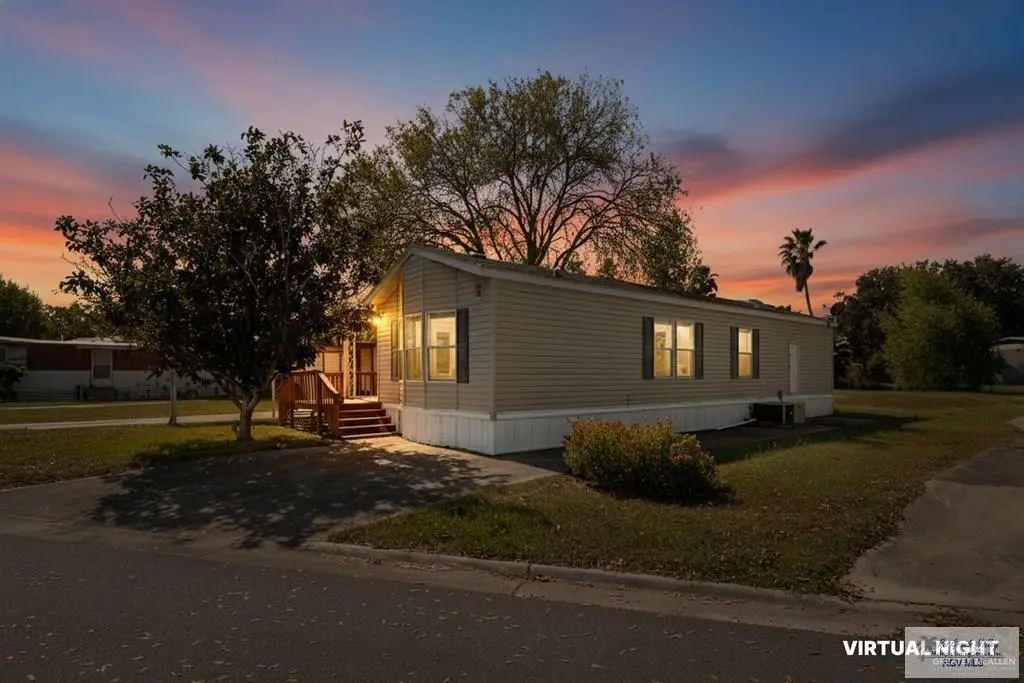
37 N Indian Lake Dr · Indian Lake, TX
Flood risk 1/10 · Minimal
- FEMA flood zone
- X (unshaded)
- Chance of flooding over 30 yrs
- 0.0%
- Est. flood insurance / yr
- $507 – $1,088
Fire risk 3/10 · Minor
- Est. fire insurance / yr
- $1,222 – $2,270
Heat risk 9/10 · Severe
- Hot days now (above 110°F)
- 5 days/yr
- Hot days in 30 yrs
- 18 days/yr
Wind risk 9/10 · Severe
- Chance of severe wind over 30 yrs
- 99.0%
Air-quality risk 2/10 · Minimal
- Unhealthy air days now
- 0 days/yr
- Unhealthy air days in 30 yrs
- 1 days/yr
Risk factors via First Street. Map © Google.
Why this score? — see what drove the D+ grade
The composite is a weighted blend of 9 inputs, each scored 0–100. Each bar is that input's sub-score; the figure is the points it added to the 100-point composite (weight × sub-score).
- Cash flow +13.6/30.0
- Appreciation +7.9/10.0
- ARV discount +7.5/15.0
- DSCR +4.1/10.0
- 1% rule +3.3/10.0
- Schools +3.3/10.0
- Livability +3.1/5.0
- Rent growth +2.5/5.0
- Condition / age +2.5/5.0
$150,000
🖨 Deal sheet 📄 Offer letter ✓ Due diligence
Listing remarks MLS
GREAT INVESTMENT OPPORTUNITY WITH 4 WATERFRONT LOTS FOR ONE PRICE!!! Look at this well-maintained 2-bedroom, 1-bath mobile home situated on three spacious lots along the resaca in the desirable Indian Lake community. This property offers ample outdoor space with beautiful water views, mature trees, and room for future expansion or outdoor living. The home features an open-concept layout, bright kitchen, and covered porch perfect for relaxing and enjoying the peaceful surroundings. Ideal for a permanent residence, vacation home, or investment opportunity. Buy this home and sell the two waterfront RV Lots if you want! This property is priced to sell and will not last long at this price!
Key facts
- Covered porch
- Water views
- Waterfront lots
Tags
Neighborhood map
What this means for you Summary
Snapshot
- This is a 2-bed/1.0-bath single-family listed at $150k.
Deal economics
- At list price, monthly cash flow is $9 ($112/yr) — positive.
- The deal already cash-flows at list — no discount required.
- To meet the 1% rule (rent ≥ 1% of price), the offer needs to be $125k (16.9% below list).
- Recommended offer: $125k (16.9% below list) — sets the bar for 1% rule.
Location & tenants
- Location reads 61/100 on livability (#1,012 in TX) — a middle-class / working-renter tenant base. Strengths: crime A+, cost of living A+, housing A+; Watch: schools F, amenities F, commute F.
- Los Fresnos CISD (suburban): math 34% / reading 44% proficiency, ranked #444 of 826 in TX (top 54%) — families likely to look elsewhere, expect single-tenant / working-renter base with shorter leases.
- Market conditions: 231 active listings in the ZIP; 2,326 units permitted in Cameron County in 2024 (503 in 5+ unit buildings).
Forward outlook
- In year one you build about $10k of equity ($1k loan paydown + $9k appreciation (5.8% local appreciation)).
- Cameron County population projected at +3% by 2050 — modest demand growth; plan on rents tracking national, not racing it.
- At projected returns (5.8% appreciation + 3.0% rent growth), your $42k cash investment doubles in ~4 years — after that, you're playing with house money.
- By year 4, paydown + projected appreciation supports a ~$33k cash-out refi (75% LTV) — recoverable capital for the next deal without selling this one.
Negotiation context
- It's been on market 122 days — a 12% lower offer ($132k) is reasonable based on typical stale-listing flexibility.
- 2 sale attempts; this cycle's ask has dropped $30k (17%) from the opening price — seller is motivated, your offer sets the floor, not the list.
Risks & watch-outs
- Climate carrying-cost: severe wind risk, 99% chance of damaging wind over 30y; extreme-heat days projected 5→18/yr by 2055 (HVAC capex compounding) — expect insurance premiums to compound above CPI over the hold.
Questions for the listing agent
- It's been on market 122 days. Have you received any prior offers? Is the seller open to a 17% concession, seller financing, or rate buy-down credit?
- Why hasn't it sold? Are there any deal-killer items the seller is aware of (foundation, flood, title, zoning, code violations)?
- Is there a deadline driving the sale (1031 exchange, divorce, estate, relocation)? That informs how much negotiation room exists.
- Schools are F-rated, which usually means shorter tenancies and higher turnover. Who's the typical renter profile here, and what's been the actual vacancy rate?
- The area grade is low — what's the realistic commute time and amenity access for the typical tenant pool here? Any planned neighborhood developments (good or bad) we should know about?
- What's the average days-on-market for RENTAL listings here right now (not sales)? A rising rental-DOM trend means longer vacancies and softer asking-rent achievability than the comps imply.
- What's the recent tenant-quality profile in this submarket — average credit score on applications, eviction rate, late-payment / NSF rate, and stable-employment percentage? A property-management company in the area should have these aggregated.
- How much new for-sale + rental construction is in the pipeline within 1–3 miles? Heavy new supply typically softens prices + rents 12–24 months out; constrained supply supports both.
Investment metrics
- 1% rule
- 0.83% ✗
- Cap rate
- 6.37%
- Cash-on-cash
- 0.27%
- DSCR
- 1.01
- GRM
- 10.0
CMA / ARV
- ARV (on-the-fly)
- $96,000
- Comps found
- 1
Show comp detail 1 sale within ~0.75 mi
| Address | Dist | Beds/Ba | Sqft | Sold | Price | $/sf | Match |
|---|---|---|---|---|---|---|---|
| 106 Resaca Shores Dr S | 0.35mi | 1/1.0 (-1) | 825 (+7%) | 12mo | $103,000 | $125 | 56 |
Match score weights: distance 35% · size 25% · config 20% · recency 20%. Top-matched comps best support the ARV.
Projected returns pro-forma
5.78% appreciation · 3.0% rent growth · sell at horizon
- IRR
- 15.0%
- Equity multiple
- 2.00×
- Total profit
- $41,943
- Equity at exit
- $92,228
- IRR
- 15.3%
- Equity multiple
- 3.94×
- Total profit
- $123,404
- Equity at exit
- $165,494
Cash invested: $42,000 (down + closing). Projections, not guarantees.
Landlord ↔ Tenant lean methodology
- Overall (STATE)
- 87 Strongly Landlord-Friendly
- State Texas
- 87 Strongly Landlord-Friendly · R+5
- County
- — inherits STATE
- City
- — inherits STATE
ZIP-level market 78566
- Home prices YoY
- 2.7%
- Active inventory
- 231
- Price-to-rent
- 10.0×
Monthly cashflow live
- Estimated rent
- $1,247 medium interval (Pro) →
- Mortgage (P&I)
- −$787
- Tax from tax record
- −$127 /mo · $1,520/yr
- Insurance
- −$62
- HOA
- −$0
- Vacancy / Maint / Mgmt
- −$262
- Net cashflow
- $9
Break-even live
UW: 25.0% down · 7.5% · 30yr · 1.5% tax · 5.0% vac · 8.0% maint · 8.0% mgmt
Financing live
Cash to close
- Down payment
- $37,500
- Closing costs
- $4,500
- Reserves months
- —
- Total cash needed
- —
Loan-product check · same deal, 3 products live
Conventional
25% down · 7.5% · 30yr
- Down + closing
- —
- Monthly P&I
- —
- Monthly cashflow
- —
- DSCR
- —
- Eligible?
- —
Personal DTI + credit; lowest rate.
DSCR
20% down · 8.5% · 30yr
- Down + closing
- —
- Monthly P&I
- —
- Monthly cashflow
- —
- DSCR
- —
- Eligible?
- —
No personal income docs; deal must DSCR.
Hard money
10% down · 12.0% · 12mo
- Down + closing
- —
- Monthly P&I
- —
- Monthly cashflow
- —
- DSCR
- —
- Eligible?
- —
Short-term bridge; refi at stabilization.
Listing history 22 events
-
2026-06-18days on market $150,000 Active 122 DOM
-
2026-06-17days on market $150,000 Active 121 DOM
-
2026-06-16days on market $150,000 Active 120 DOM
-
2026-06-15days on market $150,000 Active 119 DOM
-
2026-06-14days on market $150,000 Active 117 DOM
-
2026-06-13pricedays on market $150,000 Active 116 DOM
-
2026-06-10days on market $180,000 Active 114 DOM
-
2026-06-09days on market $180,000 Active 113 DOM
-
2026-06-08days on market $180,000 Active 112 DOM
-
2026-06-07days on market $180,000 Active 111 DOM
-
2026-06-05days on market $180,000 Active 108 DOM
-
2026-06-03days on market $180,000 Active 107 DOM
-
2026-06-02days on market $180,000 Active 106 DOM
-
2026-06-01days on market $180,000 Active 105 DOM
-
2026-05-31days on market $180,000 Active 104 DOM
-
2026-05-30days on market $180,000 Active 103 DOM
-
2026-02-16$180,000 Active 693-char remark
Show marketing remark (693 chars)
GREAT INVESTMENT OPPORTUNITY WITH 4 WATERFRONT LOTS FOR ONE PRICE!!! Look at this well-maintained 2-bedroom, 1-bath mobile home situated on three spacious lots along the resaca in the desirable Indian Lake community. This property offers ample outdoor space with beautiful water views, mature trees, and room for future expansion or outdoor living. The home features an open-concept layout, bright kitchen, and covered porch perfect for relaxing and enjoying the peaceful surroundings. Ideal for a permanent residence, vacation home, or investment opportunity. Buy this home and sell the two waterfront RV Lots if you want! This property is priced to sell and will not last long at this price!
-
2026-02-01price $180,000 693-char remark
Show marketing remark (693 chars)
GREAT INVESTMENT OPPORTUNITY WITH 4 WATERFRONT LOTS FOR ONE PRICE!!! Look at this well-maintained 2-bedroom, 1-bath mobile home situated on three spacious lots along the resaca in the desirable Indian Lake community. This property offers ample outdoor space with beautiful water views, mature trees, and room for future expansion or outdoor living. The home features an open-concept layout, bright kitchen, and covered porch perfect for relaxing and enjoying the peaceful surroundings. Ideal for a permanent residence, vacation home, or investment opportunity. Buy this home and sell the two waterfront RV Lots if you want! This property is priced to sell and will not last long at this price!
-
2025-11-17$199,999 Active 693-char remark
Show marketing remark (693 chars)
GREAT INVESTMENT OPPORTUNITY WITH 4 WATERFRONT LOTS FOR ONE PRICE!!! Look at this well-maintained 2-bedroom, 1-bath mobile home situated on three spacious lots along the resaca in the desirable Indian Lake community. This property offers ample outdoor space with beautiful water views, mature trees, and room for future expansion or outdoor living. The home features an open-concept layout, bright kitchen, and covered porch perfect for relaxing and enjoying the peaceful surroundings. Ideal for a permanent residence, vacation home, or investment opportunity. Buy this home and sell the two waterfront RV Lots if you want! This property is priced to sell and will not last long at this price!
-
2006-03-16soldstatus
-
2006-03-02soldstatus
-
1991-07-01soldstatus
ⓘ Source: listings_history table (triggers on properties + properties_extension) + one-shot
backfill from property_details.listing_events for pre-trigger history.
Tax reassessment forecast TX · Resets to sale price
- Current annual tax
- $1,520 · $127/mo
- Projected year-2 tax
- $2,745 · $229/mo
- Expected delta
- +$1,225/yr (+$102/mo · 80.6%)
ⓘ Screening estimate from a state-policy table — verify with the county assessor before closing.
Climate risk First Street
- Flood 1/10 Low FEMA zone X (unshaded) · 0% chance over 30 yrs
- Wildfire 3/10 Moderate
- Heat 9/10 Extreme 5 d/yr ≥110°F today · 18 d/yr by 30 yrs out
- Wind 9/10 Extreme 99% chance of damaging wind over 30 yrs
- Air quality 2/10 Low 0 unhealthy d/yr today · 1 by 30 yrs out
Nearby sold comps map
Loading sold comps map…
Walkable amenities ~0.75 mi
Loading nearby amenities…
Taxation est. · year 1
- Rental income
- $14,964
- − Mortgage interest
- −$8,402
- − Property taxes
- −$1,520
- − Insurance
- −$750
- − Repairs & maintenance
- −$1,197
- − Management
- −$1,197
- − Depreciation
- −$4,364
- Taxable loss
- −$2,466
- Est. tax savings @ 24.0%
- +$592
- After-tax cash flow
- $704/yr
For passive investors: Depreciation is non-cash, so a rental often shows a tax loss while cash-flowing — sheltering income. Rental losses are passive: they offset passive income freely, and up to $25,000/yr can offset ordinary (W-2) income if you actively participate and your MAGI is under $100k (phasing out to $0 by $150k); unused losses carry forward. On sale, claimed depreciation is recaptured at up to 25%, and gains may owe capital-gains tax (a 1031 exchange can defer both). Figures are a year-1 estimate at your 24.0% rate — not tax advice; consult a CPA.
Schools (NCES district)
- District
- Los Fresnos CISD
- NCES district ID
- 4828290
- Math proficiency
- 34% ▼ -30.00%
- Reading proficiency
- 44% ▼ -10.00%
- Median HH income
- $42,586
- Composite
- 32.92/100
- National rank
- #5601
- State rank
- #444 of 826 in TX
Livability — Indian Lake
- Score
- 61/100
- State rank
- #1012
- US rank
- #18023
Category grades
Schools grade is shown separately in the Schools card above.
Census & demographics
- Census place
- Indian Lake, TX
- Population (ZIP)
- 24,927
Population outlook (Cameron County) Hauer SSP2
- Today (2025)
- 441,603 people
- By 2030
- 448,113 · +1.5%
- By 2040
- 456,385 · +3.3%
- By 2050
- 456,294 · +3.3%
- By 2075
- 423,851 · -4.0%
- By 2100
- 342,787 · -22.4%
Race, ethnicity, and origin ACS 2023
- Neighborhood character
- Predominantly Hispanic (88%)
- Race & ethnicity
- Hispanic / Latino 88% Two or more races 45% White 10% Black 1%
- Hispanic origin (detail)
- Mexican 84%
- Foreign-born
- 22% · Canada
- Languages at home
- 33% English-only · Spanish 67%
Political lean MEDSL · Cameron
- 2024 margin
- Lean R (+5.8) · D 46.7% · R 52.5%
- 2008→2024 swing
- -34.6pp toward R · 2008: 28.8pp · 2024: -5.8pp
- All cycles
- 2024: R+5.8 2020: D+13.2 2016: D+32.5 2012: D+32.4 2008: D+28.8
Not yet ingested
- Civics
- —
Market trends
- HPI YoY
- ▲ 5.78%
- Current HPI
- 218.1236
- Rent YoY
- —
- Metro
- —
- State GDP YoY
- ▲ 3.95%
- F500 in state
- 110
Industry mix (Fortune 500 HQ in TX)
| Industry | F500 HQs | Revenue |
|---|---|---|
| Energy | 16 | $1,198B |
|
||
| Technology | 5 | $198B |
|
||
| Engineering / Construction | 4 | $72B |
|
||
| Energy Services | 3 | $60B |
|
||
| Utilities | 3 | $41B |
|
||
| Healthcare | 2 | $330B |
|
||
Price history
-10.0% since first listed6 events — show timeline
- 2026-02-16 Listed $180,000 MCALLENMLS
- 2026-02-01 Price Changed $180,000 RGVMLS
- 2025-11-17 Listed $199,999 RGVMLS
- 2006-03-16 Sold (Public Records) — Public Records
- 2006-03-02 Sold (Public Records) — Public Records
- 1991-07-01 Sold (Public Records) — Public Records
Property tax history
+10.6%/yrLatest (2025): $1,520 · +19.5% YoY. Source: county tax records.
Cash-flow waterfall
monthlySold comps — $/sqft
last 12 mo · ≤1 miLoading sold comps…