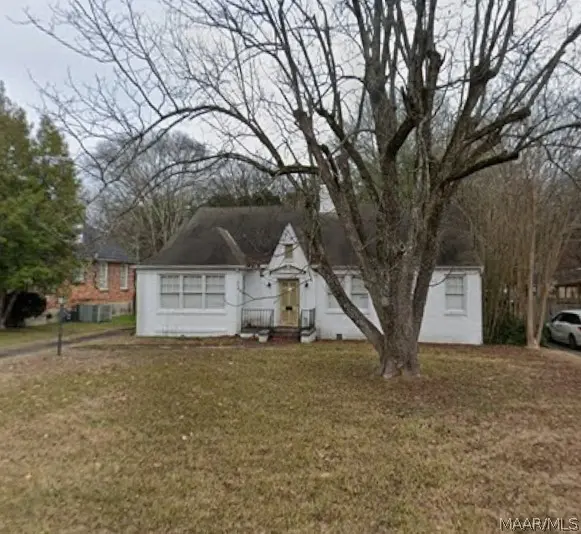
3325 Lexington Rd · Montgomery, AL
Flood risk 1/10 · Minimal
- FEMA flood zone
- X (unshaded)
- Chance of flooding over 30 yrs
- 0.0%
- Est. flood insurance / yr
- $507 – $1,088
Fire risk 1/10 · Minimal
- Est. fire insurance / yr
- $916 – $1,700
Heat risk 7/10 · Major
- Hot days now (above 108°F)
- 7 days/yr
- Hot days in 30 yrs
- 18 days/yr
Wind risk 8/10 · Major
- Chance of severe wind over 30 yrs
- 80.0%
Air-quality risk 2/10 · Minimal
- Unhealthy air days now
- 1 days/yr
- Unhealthy air days in 30 yrs
- 1 days/yr
Risk factors via First Street. Map © Google.
Why this score? — see what drove the C+ grade
The composite is a weighted blend of 9 inputs, each scored 0–100. Each bar is that input's sub-score; the figure is the points it added to the 100-point composite (weight × sub-score).
- Cash flow +23.1/30.0
- ARV discount +14.2/15.0
- DSCR +7.4/10.0
- 1% rule +4.9/10.0
- Rent growth +4.1/5.0
- Livability +3.2/5.0
- Condition / age +2.5/5.0
- Schools +1.7/10.0
- Appreciation +0.0/10.0
$135,350
🖨 Deal sheet 📄 Offer letter ✓ Due diligence
Listing remarks MLS
CLOVERDALE CHARM PLUS. INTERIOR IN FANTASTIC SHAPE. GORGEOUS LEVEL HARD FLOORS, WORKING TRANSOMS, VINTAGE CRYSTAL DOOR KNOBS, WOODEN BLINDS THOUGH OUT. ATTIC IS HUGE AND FLOORED WITH HARDWOOD. HOUSE NEAT AS A PIN. WORKING ATTIC FAN. BRIGHT AND AIRY SUNROOM. NICE BACKYARD. MUCH PRIDE OF OWNERSHIP.
Key facts
- Tall windows
- Crown molding
- Corner lot
Tags
Property features AI
Exterior
- Parking: Attached 2-car garage
- Utilities: Electricity available; Public water; Public sewer
- Home design: Single-story home
- Construction: Brick and wood siding construction; Slab foundation; Year built reported by owner
- Exterior features: City lot with mature trees; Lot dimensions approximately 75 x 164
Interior
- Flooring: Laminate; Plank; Vinyl; Wood
- Bathrooms: 2 full bathrooms
- Interior features: Laminate, plank, vinyl and wood flooring; Electric water heater
Neighborhood map
What this means for you Summary
Snapshot
- This is a 3-bed/2.0-bath single-family listed at $135k.
Deal economics
- At list price, monthly cash flow is $243 ($3k/yr) — positive.
- The deal already cash-flows at list — no discount required.
- To meet the 1% rule (rent ≥ 1% of price), the offer needs to be $133k (1.4% below list).
- Recommended offer: $131k (3.0% below list) — sets the bar for market timing.
- Cap rate 8.4% vs local median 6.0% in Montgomery — top-decile yield for the area; either an underpriced asset or a hidden risk that comps aren't pricing in. Stress-test before assuming the spread holds.
Location & tenants
- Location reads 65/100 on livability (#138 in AL) — a middle-class / working-renter tenant base. Strengths: cost of living A+, housing A+; Watch: schools C-, employment D, crime F.
- Montgomery County (urban): math 9% / reading 31% proficiency, ranked #106 of 129 in AL (top 82%) — low school quality limits family demand, transient renter base, plan for 1-2y turnover; 70% free/reduced lunch — lower-income household profile, screen leases tightly.
- Market conditions: Rents rising fast (+6.3%/yr); 137 active listings in the ZIP; 38 comparable units currently listed for rent nearby; rentals lingering (median 44d on market — plan ~5-8 weeks vacancy on turnover, expect pricing pressure); 50% of comp listings sitting > 30 days — soft ceiling on asking rent; 460 units permitted in Montgomery County in 2024 (37 in 5+ unit buildings).
Forward outlook
- Local home prices are declining (-3.0%/yr); year-one equity from $936 of loan paydown is wiped out by about $4k of value loss. Plan a longer hold.
- Montgomery County population projected to shrink 8% by 2050 — rents likely to lag national; underwrite the cash flow, not the appreciation.
- At projected returns (-3.0% appreciation + 6.3% rent growth), your $38k cash investment doubles in ~10 years — after that, you're playing with house money.
Negotiation context
- It's been on market 48 days — a 3% lower offer ($131k) is reasonable based on typical stale-listing flexibility.
- 4 sale attempts since 26y ago with the ask held roughly flat each time — persistent listings suggest the price (not the market) is what's stuck; bring a comps-based counter.
Risks & watch-outs
- Watch-outs: built in 1939 — expect roof / HVAC / electrical / plumbing capex.
- Climate carrying-cost: severe wind risk, 80% chance of damaging wind over 30y; extreme-heat days projected 7→18/yr by 2055 (HVAC capex compounding) — expect insurance premiums to compound above CPI over the hold.
Questions for the listing agent
- It's been on market 48 days. Have you received any prior offers? Is the seller open to a 3% concession, seller financing, or rate buy-down credit?
- Built in 1939 — when were the roof, HVAC, electrical panel, plumbing, and water heater last replaced?
- Is there a deadline driving the sale (1031 exchange, divorce, estate, relocation)? That informs how much negotiation room exists.
- Crime grade is F in this area — have there been break-ins, vandalism, or insurance claims at this property in the last 3 years? What carrier currently insures it and at what premium?
- What's the average days-on-market for RENTAL listings here right now (not sales)? A rising rental-DOM trend means longer vacancies and softer asking-rent achievability than the comps imply.
- What's the recent tenant-quality profile in this submarket — average credit score on applications, eviction rate, late-payment / NSF rate, and stable-employment percentage? A property-management company in the area should have these aggregated.
- How much new for-sale + rental construction is in the pipeline within 1–3 miles? Heavy new supply typically softens prices + rents 12–24 months out; constrained supply supports both.
Investment metrics
- 1% rule
- 0.99% ✗
- Cap rate
- 8.45%
- Cash-on-cash
- 7.69%
- DSCR
- 1.34
- GRM
- 8.4
CMA / ARV
- ARV (median comp)
- $159,163
- List price
- $135,350
- Delta
- -14.96%
- Verdict
- UNDERPRICED
- Comps
- 20 within 1.0 mi
Show comp detail 12 sales within ~0.75 mi
| Address | Dist | Beds/Ba | Sqft | Sold | Price | $/sf | Match |
|---|---|---|---|---|---|---|---|
| 3237 Cloverdale Rd | 0.34mi | 3/2.0 | 1,954 (+0%) | 2mo | $240,000 | $123 | 82 |
| 3357 Wilmington Rd | 0.15mi | 3/2.0 | 2,064 (+6%) | 2mo | $165,000 | $80 | 82 |
| 3455 Wellington Rd | 0.12mi | 4/2.0 (+1) | 2,038 (+4%) | 3mo | $100,000 | $49 | 79 |
| 3356 Cloverdale Rd | 0.31mi | 2/2.0 (-1) | 1,966 (+1%) | 1mo | $229,000 | $116 | 78 |
| 3469 Wellington Rd | 0.14mi | 3/2.0 | 1,782 (-9%) | 3mo | $49,900 | $28 | 77 |
| 3417 Wellington Rd | 0.11mi | 3/2.0 | 1,722 (-12%) | 1mo | $100,000 | $58 | 74 |
| 3134 S Hull St | 0.36mi | 3/2.0 | 1,830 (-6%) | 2mo | $115,000 | $63 | 71 |
| 3504 Cloverdale Rd | 0.46mi | 3/2.0 | 2,149 (+10%) | 2mo | $39,500 | $18 | 60 |
| 1908 Norman Bridge Ct | 0.52mi | 3/2.0 | 1,762 (-10%) | 2mo | $129,000 | $73 | 58 |
| 3607 S Court St | 0.61mi | 3/2.0 | 1,703 (-13%) | 2mo | $32,500 | $19 | 49 |
| 25 Arlington Rd | 0.63mi | 3/2.0 | 2,231 (+14%) | 0mo | $57,500 | $26 | 46 |
| 1028 Magnolia Curv | 0.66mi | 3/1.5 | 1,661 (-15%) | 1mo | $250,000 | $151 | 42 |
Match score weights: distance 35% · size 25% · config 20% · recency 20%. Top-matched comps best support the ARV.
Projected returns pro-forma
-3.0% appreciation · 6.29% rent growth · sell at horizon
- IRR
- -1.3%
- Equity multiple
- 0.95×
- Total profit
- $-1,955
- Equity at exit
- $20,181
- IRR
- 11.3%
- Equity multiple
- 2.00×
- Total profit
- $38,031
- Equity at exit
- $11,703
Cash invested: $37,898 (down + closing). Projections, not guarantees.
Landlord ↔ Tenant lean methodology
- Overall (STATE)
- 90 Strongly Landlord-Friendly
- State Alabama
- 90 Strongly Landlord-Friendly · R+15
- County
- — inherits STATE
- City
- — inherits STATE
ZIP-level market 36106
- Home prices YoY
- -13.1%
- Rents YoY
- 6.3%
- Active inventory
- 137
- Price-to-rent
- 8.4×
Monthly cashflow live
- Estimated rent
- $1,335 high interval (Pro) →
- Mortgage (P&I)
- −$710
- Tax from tax record
- −$45 /mo · $546/yr
- Insurance
- −$56
- HOA
- −$0
- Vacancy / Maint / Mgmt
- −$280
- Net cashflow
- $243
Break-even live
UW: 25.0% down · 7.5% · 30yr · 1.5% tax · 5.0% vac · 8.0% maint · 8.0% mgmt
Financing live
Cash to close
- Down payment
- $33,838
- Closing costs
- $4,060
- Reserves months
- —
- Total cash needed
- —
Loan-product check · same deal, 3 products live
Conventional
25% down · 7.5% · 30yr
- Down + closing
- —
- Monthly P&I
- —
- Monthly cashflow
- —
- DSCR
- —
- Eligible?
- —
Personal DTI + credit; lowest rate.
DSCR
20% down · 8.5% · 30yr
- Down + closing
- —
- Monthly P&I
- —
- Monthly cashflow
- —
- DSCR
- —
- Eligible?
- —
No personal income docs; deal must DSCR.
Hard money
10% down · 12.0% · 12mo
- Down + closing
- —
- Monthly P&I
- —
- Monthly cashflow
- —
- DSCR
- —
- Eligible?
- —
Short-term bridge; refi at stabilization.
Rent comps 38 comps
| Address | Beds | Baths | Sqft | Rent | $/sqft | DOM | Units | Dist |
|---|---|---|---|---|---|---|---|---|
| 3386 Lexington Rd Unit B Montgomery, AL | 2.0 | 1.0 | 1950 | $900 | $0.46 | 20d | 1 | 0.08mi |
| 3485 Wellington Rd Montgomery, AL | 3.0 | 2.0 | 2437 | $1,395 | $0.57 | 20d | 1 | 0.14mi |
| 3235 Norman Bridge Rd Montgomery, AL | 3.0 | 1.0 | 1873 | $900 | $0.48 | 43d | 1 | 0.15mi |
| 3369 Montezuma Rd Montgomery, AL | 3.0 | 1.0 | 1281 | $1,150 | $0.90 | 43d | 1 | 0.19mi |
| 3256 Montezuma Rd Montgomery, AL | 3.0 | 2.0 | 1515 | $1,450 | $0.96 | 43d | 1 | 0.19mi |
| 3338 S Hull St Montgomery, AL | 2.0 | 2.0 | 1311 | $1,150 | $0.88 | 20d | 1 | 0.27mi |
| 3304 Gilmer Ave Montgomery, AL | 4.0 | 2.0 | 2009 | $1,400 | $0.70 | 20d | 1 | 0.36mi |
| 3356 Audubon Rd Montgomery, AL | 2.0 | 1.5 | 1340 | $950 | $0.71 | 43d | 1 | 0.38mi |
| 139 Mount Vernon Dr Unit A Montgomery, AL | 4.0 | 2.5 | 1700 | $1,000 | $0.59 | 43d | 1 | 0.50mi |
| 1919 Norman Bridge Ct Unit 1043838P Montgomery, AL | 4.0 | 3.0 | 1539 | $4,108 | $2.67 | 43d | 1 | 0.52mi |
| 428 Thorn Pl Montgomery, AL | 2.0 | 1.0 | 1549 | $1,450 | $0.94 | 43d | 1 | 0.52mi |
| 3543 Berkley Dr Montgomery, AL | 4.0 | 2.0 | 2067 | $1,575 | $0.76 | 13d | 1 | 0.56mi |
| 519 Thorn Pl Montgomery, AL | 2.0 | 1.0 | 1632 | $650 | $0.40 | 20d | 1 | 0.56mi |
| 3510 Bankhead Ave Montgomery, AL | 3.0 | 3.0 | 2210 | $2,250 | $1.02 | 43d | 1 | 0.61mi |
| 3544 Southmont Dr Montgomery, AL | 4.0 | 1.5 | 1774 | $1,300 | $0.73 | 20d | 1 | 0.63mi |
| 2727 Boultier St Montgomery, AL | 1.0–3.0 | 1.0–2.0 | 1070 | $1,582 | $1.48 | 13d | 3 | 0.68mi |
| 334 Felder Ave Montgomery, AL | 3.0 | 2.0 | 2223 | $2,395 | $1.08 | 43d | 1 | 0.77mi |
| 3735 Bridlewood Dr Montgomery, AL | 3.0 | 1.0 | 1386 | $895 | $0.65 | 43d | 1 | 0.78mi |
| 3649 Princeton Rd Montgomery, AL | 3.0 | 1.0 | 1266 | $1,200 | $0.95 | 20d | 1 | 0.87mi |
| 3708 Princeton Rd Montgomery, AL | 2.0 | 2.0 | 1749 | $900 | $0.51 | 20d | 1 | 0.92mi |
| 3720 Stanley Dr Montgomery, AL | 4.0 | 2.0 | 1719 | $1,650 | $0.96 | 20d | 1 | 0.95mi |
| 1355 Magnolia Curv Montgomery, AL | 3.0 | 3.0 | 2260 | $1,800 | $0.80 | 13d | 1 | 0.96mi |
| 1450 Crenshaw Pl S Montgomery, AL | 3.0 | 2.0 | 1641 | $1,775 | $1.08 | 43d | 1 | 1.01mi |
| 1425 Blairwood Montgomery, AL | 3.0 | 2.0 | 1700 | $1,850 | $1.09 | 13d | 1 | 1.04mi |
| 1259 S Lawrence St Montgomery, AL | 3.0 | 1.0 | 1728 | $1,300 | $0.75 | 43d | 1 | 1.05mi |
| 1437 Beaumont Dr Montgomery, AL | 4.0 | 2.0 | 2029 | $1,500 | $0.74 | 43d | 1 | 1.06mi |
| 1067 Roslyn Dr Montgomery, AL | 4.0 | 2.0 | 1760 | $1,125 | $0.64 | 20d | 1 | 1.16mi |
| 548 Winston Dr Montgomery, AL | 2.0 | 2.5 | 1396 | $1,000 | $0.72 | 43d | 1 | 1.16mi |
| 1314 S Court St Montgomery, AL | 2.0 | 2.0 | 1650 | $1,495 | $0.91 | 13d | 1 | 1.19mi |
| 2043 Hazel Hedge Ln Montgomery, AL | 4.0 | 3.0 | 2001 | $1,650 | $0.82 | 13d | 1 | 1.21mi |
| 1020 S Lawrence St Montgomery, AL | 2.0 | 1.0 | 1711 | $2,000 | $1.17 | 13d | 1 | 1.24mi |
| 3616 Gaston Ave Montgomery, AL | 4.0 | 2.0 | 1629 | $1,300 | $0.80 | 43d | 1 | 1.26mi |
| 3577 Whiting Ave Montgomery, AL | 3.0 | 1.0 | 1269 | $1,150 | $0.91 | 43d | 1 | 1.30mi |
| 2226 Carter Hill Rd Montgomery, AL | 2.0 | 1.0 | 1506 | $905 | $0.60 | 43d | 1 | 1.31mi |
| 22 W Cromwell St Montgomery, AL | 4.0 | 2.0 | 1645 | $1,350 | $0.82 | 20d | 1 | 1.34mi |
| 2045 Bullard St Unit 1043526P Montgomery, AL | 3.0 | 2.0 | 1797 | $2,198 | $1.22 | 43d | 1 | 1.43mi |
| 2053 Gorgas St Montgomery, AL | 3.0 | 1.0 | 1955 | $1,200 | $0.61 | 20d | 1 | 1.49mi |
| 1434 E Audubon Rd Montgomery, AL | 4.0 | 2.0 | 2237 | $1,475 | $0.66 | 43d | 1 | 1.49mi |
Listing history 22 events
-
2026-06-18days on market $135,350 Active 48 DOM
-
2026-06-17days on market $135,350 Active 47 DOM
-
2026-06-16days on market $135,350 Active 46 DOM
-
2026-06-15days on market $135,350 Active 45 DOM
-
2026-06-14days on market $135,350 Active 43 DOM
-
2026-06-13days on market $135,350 Active 42 DOM
-
2026-06-10days on market $135,350 Active 40 DOM
-
2026-06-09days on market $135,350 Active 39 DOM
-
2026-06-08days on market $135,350 Active 38 DOM
-
2026-06-07days on market $135,350 Active 37 DOM
-
2026-06-03days on market $135,350 Active 33 DOM
-
2026-06-02days on market $135,350 Active 32 DOM
-
2026-06-01days on market $135,350 Active 31 DOM
-
2026-05-31days on market $135,350 Active 30 DOM
-
2026-05-30days on market $135,350 Active 29 DOM
-
2026-05-01$135,350 Active 1412-char remark
-
2005-08-31soldstatus $132,500 297-char remark
Show marketing remark (297 chars)
CLOVERDALE CHARM PLUS. INTERIOR IN FANTASTIC SHAPE. GORGEOUS LEVEL HARD FLOORS, WORKING TRANSOMS, VINTAGE CRYSTAL DOOR KNOBS, WOODEN BLINDS THOUGH OUT. ATTIC IS HUGE AND FLOORED WITH HARDWOOD. HOUSE NEAT AS A PIN. WORKING ATTIC FAN. BRIGHT AND AIRY SUNROOM. NICE BACKYARD. MUCH PRIDE OF OWNERSHIP.
-
2005-08-02$134,900 297-char remark
Show marketing remark (297 chars)
CLOVERDALE CHARM PLUS. INTERIOR IN FANTASTIC SHAPE. GORGEOUS LEVEL HARD FLOORS, WORKING TRANSOMS, VINTAGE CRYSTAL DOOR KNOBS, WOODEN BLINDS THOUGH OUT. ATTIC IS HUGE AND FLOORED WITH HARDWOOD. HOUSE NEAT AS A PIN. WORKING ATTIC FAN. BRIGHT AND AIRY SUNROOM. NICE BACKYARD. MUCH PRIDE OF OWNERSHIP.
-
2003-07-29soldstatus $120,000
Show marketing remark (282 chars)
FORMAL LIVING ROOM & DINING ROOM. .3RD BEDROOM BEING USED AS OFFICE. .VACANT IN AUGUST. .SHOWS BEAUTIFUL. .CEDAR CLOSET. .SINGLE GARAGE PLUS SINGLE CARPORT. .PRIVATE BACKYARD. .THIS ONE IS A JEWEL. .EXCELLENT CONDITION. .LEVEL HARDWOOD FLOORS GLISTEN. .LOTS OF LIGHT. .AIRY. .
-
2003-05-01$118,000
Show marketing remark (282 chars)
FORMAL LIVING ROOM & DINING ROOM. .3RD BEDROOM BEING USED AS OFFICE. .VACANT IN AUGUST. .SHOWS BEAUTIFUL. .CEDAR CLOSET. .SINGLE GARAGE PLUS SINGLE CARPORT. .PRIVATE BACKYARD. .THIS ONE IS A JEWEL. .EXCELLENT CONDITION. .LEVEL HARDWOOD FLOORS GLISTEN. .LOTS OF LIGHT. .AIRY. .
-
2001-03-14soldstatus $105,000
-
2000-09-07$109,000
ⓘ Source: listings_history table (triggers on properties + properties_extension) + one-shot
backfill from property_details.listing_events for pre-trigger history.
Tax reassessment forecast AL · Resets to sale price
- Current annual tax
- $546 · $45/mo
- Projected year-2 tax
- $555 · $46/mo
- Expected delta
- +$9/yr (+$1/mo · 1.7%)
ⓘ Screening estimate from a state-policy table — verify with the county assessor before closing.
Climate risk First Street
- Flood 1/10 Low FEMA zone X (unshaded) · 0% chance over 30 yrs
- Wildfire 1/10 Low
- Heat 7/10 Severe 7 d/yr ≥108°F today · 18 d/yr by 30 yrs out
- Wind 8/10 Severe 80% chance of damaging wind over 30 yrs
- Air quality 2/10 Low 1 unhealthy d/yr today · 1 by 30 yrs out
Nearby sold comps map
Loading sold comps map…
Walkable amenities ~0.75 mi
Loading nearby amenities…
Taxation est. · year 1
- Rental income
- $16,019
- − Mortgage interest
- −$7,582
- − Property taxes
- −$546
- − Insurance
- −$677
- − Repairs & maintenance
- −$1,281
- − Management
- −$1,281
- − Depreciation
- −$3,937
- Taxable income
- $714
- Est. tax owed @ 24.0%
- −$171
- After-tax cash flow
- $2,743/yr
For passive investors: Depreciation is non-cash, so a rental often shows a tax loss while cash-flowing — sheltering income. Rental losses are passive: they offset passive income freely, and up to $25,000/yr can offset ordinary (W-2) income if you actively participate and your MAGI is under $100k (phasing out to $0 by $150k); unused losses carry forward. On sale, claimed depreciation is recaptured at up to 25%, and gains may owe capital-gains tax (a 1031 exchange can defer both). Figures are a year-1 estimate at your 24.0% rate — not tax advice; consult a CPA.
Schools (NCES district)
- District
- Montgomery County
- NCES district ID
- 0102430
- Math proficiency
- 9% ▼ -21.00%
- Reading proficiency
- 31% ▼ -1.00%
- Median HH income
- $43,902
- Composite
- 17.24/100
- National rank
- #9093
- State rank
- #106 of 129 in AL
Livability — Montgomery
- Score
- 65/100
- State rank
- #138
- US rank
- #13416
Category grades
Schools grade is shown separately in the Schools card above.
Census & demographics
- Census place
- Montgomery, AL
- County
- Montgomery County · 190,016 people
- City population
- 175,913
- Metro
- Montgomery, AL
- Population (ZIP)
- 14,065
- Household income
- $69,087
- Rent vs Own
- Severe rent burden
- 876.0
Population outlook (Montgomery County) Hauer SSP2
- Today (2025)
- 224,008 people
- By 2030
- 221,460 · -1.1%
- By 2040
- 214,179 · -4.4%
- By 2050
- 204,912 · -8.5%
- By 2075
- 177,821 · -20.6%
- By 2100
- 145,134 · -35.2%
Race, ethnicity, and origin ACS 2023
- Neighborhood character
- Diverse neighborhood (Simpson 0.58)
- Race & ethnicity
- White 47% Black 43% Hispanic / Latino 5% Two or more races 4% Asian 1%
- Hispanic origin (detail)
- Mexican 3%
- Common ancestry
- Serbian 2% Slovak 2% Italian 1%
- Foreign-born
- 4% · Canada, China, South Korea
- Languages at home
- 94% English-only · Spanish 3%
Political lean MEDSL · Montgomery
- 2024 margin
- Solid D (+30.7) · D 64.8% · R 34.1% · Other 1.1%
- 2008→2024 swing
- +11.5pp toward D · 2008: 19.2pp · 2024: 30.7pp
- All cycles
- 2024: D+30.7 2020: D+31.5 2016: D+26.2 2012: D+24.3 2008: D+19.2
Not yet ingested
- Civics
- —
Market trends
- HPI YoY
- ▼ -22.82%
- Current HPI
- 151.1822
- Rent YoY
- ▲ 6.29%
- Metro
- Montgomery, AL
- State GDP YoY
- ▲ 2.94%
- F500 in state
- 4
Industry mix (Fortune 500 HQ in AL)
| Industry | F500 HQs | Revenue |
|---|---|---|
| Financial Services | 1 | $8B |
|
||
| Healthcare | 1 | $5B |
|
||
Price history
+24.2% since first listed7 events — show timeline
- 2026-05-01 Listed $135,350 MAAR
- 2005-08-31 Sold (MLS) $132,500 MAAR
- 2005-08-02 Listed $134,900 MAAR
- 2003-07-29 Sold (MLS) $120,000 MAAR
- 2003-05-01 Listed $118,000 MAAR
- 2001-03-14 Sold (MLS) $105,000 MAAR
- 2000-09-07 Listed $109,000 MAAR
Property tax history
-1.9%/yrLatest (2020): $546 · -7.9% YoY. Source: county tax records.
Cash-flow waterfall
monthlySold comps — $/sqft
last 12 mo · ≤1 miLoading sold comps…