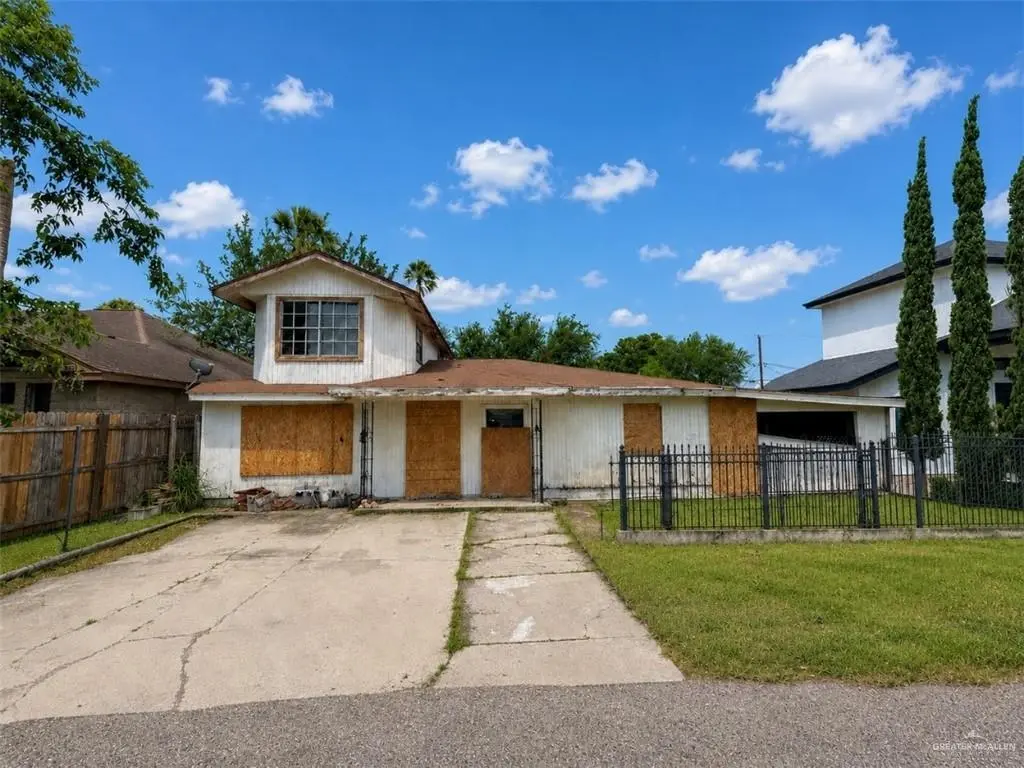
2122 J & V St · Scissors, TX
Flood risk 1/10 · Minimal
- FEMA flood zone
- X (shaded)
- Chance of flooding over 30 yrs
- 0.0%
- Est. flood insurance / yr
- $507 – $1,088
Fire risk 4/10 · Minor
- Est. fire insurance / yr
- $1,222 – $2,270
Heat risk 9/10 · Severe
- Hot days now (above 111°F)
- 7 days/yr
- Hot days in 30 yrs
- 23 days/yr
Wind risk 9/10 · Severe
- Chance of severe wind over 30 yrs
- 99.0%
Air-quality risk 1/10 · Minimal
- Unhealthy air days now
- 0 days/yr
- Unhealthy air days in 30 yrs
- 0 days/yr
Risk factors via First Street. Map © Google.
Why this score? — see what drove the B grade
The composite is a weighted blend of 9 inputs, each scored 0–100. Each bar is that input's sub-score; the figure is the points it added to the 100-point composite (weight × sub-score).
- Cash flow +26.9/30.0
- Appreciation +10.0/10.0
- 1% rule +9.3/10.0
- DSCR +9.3/10.0
- ARV discount +7.5/15.0
- Livability +2.9/5.0
- Rent growth +2.5/5.0
- Condition / age +2.5/5.0
- Schools +1.1/10.0
$90,000
🖨 Deal sheet (PDF) 📄 Offer letter ✓ Due diligence
Listing remarks
Investor special with tons of potential. This 4 bedroom/ 1 bathroom home offers an excellent opportunity for a fix and flip, rental investment, or full renovation project. With over 1,500 living sqft and a spacious layout, the property provides a solid canvas for investors looking to add value and maximize returns. Priced below the appraisal district value of $131,599, this is an opportunity you don't want to miss. Situated on a generously sized lot with mature trees and convenient access to schools, shopping, and major roadways. Property is being sold as is. Great opportunity to bring your vision and unlock this home's potential.
Key facts
- Generously sized lot
- Convenient access
- Spacious layout
Tags
Property features AI
Finance
- HOA & community: No homeowners association
Exterior
- Parking: 2 total parking spaces; 2 covered carport spaces; Attached parking
- Utilities: Public water; City sewer; Electric service for heating/cooling
- Home design: Single-story (one living area indicated); Facing direction not specified; Property type not specified
- Construction: Shingle roof; Wood siding and other construction materials; Slab foundation; Built area approximately 1,508
- Exterior features: Mature trees; Storage structure on property; Paved road access; Curbs
Interior
- Kitchen: Electric water heater; No conveying appliances
- Flooring: Tile; Other
- Bathrooms: 1 full bathroom
- Heating & cooling: Central heating (electric); Central air conditioning (electric)
- Interior features: Laminate countertops; Ceiling fan(s); No window coverings
- Laundry & utility: Laundry area with washer/dryer connection
Neighborhood map
What this means for you Summary
Snapshot
- This is a 3-bed/2.0-bath single-family listed at $90k.
Deal economics
- At list price, monthly cash flow is $250 ($3k/yr) — positive.
- The deal already cash-flows at list — no discount required.
- Meets the 1% rule at list price ($1k rent vs $90k).
- Recommended offer: $89k (1.5% below list) — sets the bar for market timing.
Location & tenants
- Location reads 57/100 on livability (#1,265 in TX) — a working-class tenant base; expect higher turnover. Strengths: cost of living A+; Watch: housing C-, amenities F, commute F.
- Donna ISD (suburban): math 11% / reading 18% proficiency, ranked #821 of 826 in TX (top 99%) — low school quality limits family demand, transient renter base, plan for 1-2y turnover.
- Zoned schools: Runn Virtual Learning Academy (math 8% / reading 17%); A P Solis Middle (math 8% / reading 19%, grade F, #1,602 of 1,662 statewide, top 97%, 666 students, 93% FRL); Donna H S (math 16% / reading 21%, grade F, #1,436 of 1,632 statewide, top 88%, 2,095 students, 92% FRL) — zoned schools average 93% FRL vs 48% district-wide (44 pts higher); higher-poverty schools than district average — tighter screening recommended.
- Market conditions: 323 active listings in the ZIP; 7,378 units permitted in Hidalgo County in 2024 (641 in 5+ unit buildings).
Forward outlook
- In year one you build about $10k of equity ($622 loan paydown + $9k appreciation (10.0% local appreciation)).
- Hidalgo County population projected at +28% by 2050 — long-run rental-demand tailwind backs the buy-and-hold thesis.
- At projected returns (10.0% appreciation + 3.0% rent growth), your $25k cash investment doubles in ~2 years — after that, you're playing with house money.
- By year 4, paydown + projected appreciation supports a ~$34k cash-out refi (75% LTV) — recoverable capital for the next deal without selling this one.
Negotiation context
- It's been on market 18 days — a 2% lower offer ($89k) is reasonable based on typical stale-listing flexibility.
Risks & watch-outs
- Watch-outs: property tax is 3.4% of price.
- Climate carrying-cost: severe wind risk, 99% chance of damaging wind over 30y; extreme-heat days projected 7→23/yr by 2055 (HVAC capex compounding) — expect insurance premiums to compound above CPI over the hold.
Questions for the listing agent
- Property tax is high relative to price — has the assessment been appealed recently, and will the sale trigger a re-assessment?
- Is there a deadline driving the sale (1031 exchange, divorce, estate, relocation)? That informs how much negotiation room exists.
- Schools are F-rated, which usually means shorter tenancies and higher turnover. Who's the typical renter profile here, and what's been the actual vacancy rate?
- What's the average days-on-market for RENTAL listings here right now (not sales)? A rising rental-DOM trend means longer vacancies and softer asking-rent achievability than the comps imply.
- What's the recent tenant-quality profile in this submarket — average credit score on applications, eviction rate, late-payment / NSF rate, and stable-employment percentage? A property-management company in the area should have these aggregated.
- How much new for-sale + rental construction is in the pipeline within 1–3 miles? Heavy new supply typically softens prices + rents 12–24 months out; constrained supply supports both.
Investment metrics
- 1% rule
- 1.43% ✓
- Cap rate
- 9.63%
- Cash-on-cash
- 11.91%
- DSCR
- 1.53
- GRM
- 5.8
CMA / ARV
- ARV (on-the-fly)
- $238,264
- Comps found
- 12
Show comp detail 12 sales within ~0.75 mi
| Address | Dist | Beds/Ba | Sqft | Sold | Price | $/sf | Match |
|---|---|---|---|---|---|---|---|
| 2102 Trinity St | 0.06mi | 3/2.0 | 1,394 (-8%) | 2mo | $237,000 | $170 | 83 |
| 1921 Trinity St | 0.20mi | 4/2.0 (+1) | 1,520 (+1%) | 2mo | $229,900 | $151 | 83 |
| 2126 Trinity St | 0.04mi | 3/2.0 | 1,393 (-8%) | 4mo | $205,000 | $147 | 82 |
| 1916 Trinity St | 0.20mi | 3/2.0 | 1,449 (-4%) | 4mo | $215,000 | $148 | 80 |
| 2020 Trinity St | 0.20mi | 3/2.0 | 1,414 (-6%) | 6mo | $229,000 | $162 | 76 |
| 2004 Trinity St | 0.05mi | 3/2.0 | 1,356 (-10%) | 7mo | $224,900 | $166 | 75 |
| 2114 Trinity St | 0.05mi | 3/2.0 | 1,319 (-12%) | 7mo | $209,000 | $158 | 71 |
| 2012 Trinity St | 0.20mi | 3/2.0 | 1,359 (-10%) | 9mo | $223,899 | $165 | 66 |
| 2122 Trinity St | 0.04mi | 3/2.0 | 1,292 (-14%) | 10mo | $202,200 | $157 | 66 |
| 2021 Trinity St | 0.20mi | 3/2.0 | 1,332 (-12%) | 9mo | $195,000 | $146 | 64 |
| 2208 Trinity St | 0.06mi | 3/1.5 | 1,295 (-14%) | 10mo | $229,900 | $178 | 63 |
| 1209 Bobby Dr | 0.54mi | 3/2.0 | 1,680 (+11%) | 8mo | $152,999 | $91 | 49 |
Match score weights: distance 35% · size 25% · config 20% · recency 20%. Top-matched comps best support the ARV.
Projected returns pro-forma
10.0% appreciation · 3.0% rent growth · sell at horizon
- IRR
- 33.1%
- Equity multiple
- 3.58×
- Total profit
- $65,051
- Equity at exit
- $81,079
- IRR
- 28.6%
- Equity multiple
- 8.11×
- Total profit
- $179,254
- Equity at exit
- $174,850
Cash invested: $25,200 (down + closing). Projections, not guarantees.
Landlord ↔ Tenant lean methodology
- Overall (STATE)
- 87 Strongly Landlord-Friendly
- State Texas
- 87 Strongly Landlord-Friendly · R+5
- County
- — inherits STATE
- City
- — inherits STATE
ZIP-level market 78537
- Home prices YoY
- 5.8%
- Active inventory
- 323
- Price-to-rent
- 5.8×
Monthly cashflow live
- Estimated rent
- $1,287 medium interval (Pro) →
- Mortgage (P&I)
- −$472
- Tax from tax record
- −$257 /mo · $3,085/yr
- Insurance
- −$38
- HOA
- −$0
- Vacancy / Maint / Mgmt
- −$270
- Net cashflow
- $250
Break-even live
Sensitivity live
| Price | -10% $301 | -5% $276 | +0% $250 | +5% $225 | +10% $199 |
|---|---|---|---|---|---|
| Rent | -10% $148 | -5% $199 | +0% $250 | +5% $301 | +10% $352 |
| Rate | -1.0pp $295 | -0.5pp $273 | base $250 | +0.5pp $227 | +1.0pp $203 |
UW: 25.0% down · 7.5% · 30yr · 1.5% tax · 5.0% vac · 8.0% maint · 8.0% mgmt
Financing live
Cash to close
- Down payment
- $22,500
- Closing costs
- $2,700
- Reserves months
- —
- Total cash needed
- —
Loan-product check · same deal, 3 products live
Conventional
25% down · 7.5% · 30yr
- Down + closing
- —
- Monthly P&I
- —
- Monthly cashflow
- —
- DSCR
- —
- Eligible?
- —
Personal DTI + credit; lowest rate.
DSCR
20% down · 8.5% · 30yr
- Down + closing
- —
- Monthly P&I
- —
- Monthly cashflow
- —
- DSCR
- —
- Eligible?
- —
No personal income docs; deal must DSCR.
Hard money
10% down · 12.0% · 12mo
- Down + closing
- —
- Monthly P&I
- —
- Monthly cashflow
- —
- DSCR
- —
- Eligible?
- —
Short-term bridge; refi at stabilization.
Listing history 14 events
-
2026-06-13statusdays on market $90,000 Pending 18 DOM
-
2026-06-10days on market $90,000 Active 16 DOM
-
2026-06-09days on market $90,000 Active 15 DOM
-
2026-06-08days on market $90,000 Active 14 DOM
-
2026-06-07days on market $90,000 Active 13 DOM
-
2026-06-05days on market $90,000 Active 10 DOM
-
2026-06-03days on market $90,000 Active 9 DOM
-
2026-06-02days on market $90,000 Active 8 DOM
-
2026-06-01days on market $90,000 Active 7 DOM
-
2026-05-31days on market $90,000 Active 6 DOM
-
2026-05-31days on market $90,000 Active 5 DOM
-
2026-05-21$90,000 Active
-
2021-11-15soldstatus
-
1998-12-15soldstatus
ⓘ Source: listings_history table (triggers on properties + properties_extension) + one-shot
backfill from property_details.listing_events for pre-trigger history.
Tax reassessment forecast TX · Resets to sale price
- Current annual tax
- $3,085 · $257/mo
- Projected year-2 tax
- $3,085 · $257/mo
- Expected delta
- $0/yr ($0/mo · 0.0%)
ⓘ Screening estimate from a state-policy table — verify with the county assessor before closing.
Climate risk First Street
- Flood 1/10 Low FEMA zone X (shaded) · 0% chance over 30 yrs
- Wildfire 4/10 Moderate
- Heat 9/10 Extreme 7 d/yr ≥111°F today · 23 d/yr by 30 yrs out
- Wind 9/10 Extreme 99% chance of damaging wind over 30 yrs
- Air quality 1/10 Low 0 unhealthy d/yr today · 0 by 30 yrs out
Nearby sold comps map
Loading sold comps map…
Walkable amenities ~0.75 mi
Loading nearby amenities…
Taxation est. · year 1
- Rental income
- $15,442
- − Mortgage interest
- −$5,041
- − Property taxes
- −$3,085
- − Insurance
- −$450
- − Repairs & maintenance
- −$1,235
- − Management
- −$1,235
- − Depreciation
- −$2,618
- Taxable income
- $1,777
- Est. tax owed @ 24.0%
- −$426
- After-tax cash flow
- $2,574/yr
For passive investors: Depreciation is non-cash, so a rental often shows a tax loss while cash-flowing — sheltering income. Rental losses are passive: they offset passive income freely, and up to $25,000/yr can offset ordinary (W-2) income if you actively participate and your MAGI is under $100k (phasing out to $0 by $150k); unused losses carry forward. On sale, claimed depreciation is recaptured at up to 25%, and gains may owe capital-gains tax (a 1031 exchange can defer both). Figures are a year-1 estimate at your 24.0% rate — not tax advice; consult a CPA.
Schools (NCES district)
- District
- Donna ISD
- NCES district ID
- 4817390
- Math proficiency
- 11% ▼ -30.00%
- Reading proficiency
- 18% ▼ -13.00%
- Median HH income
- $27,330
- Composite
- 11.16/100
- National rank
- #9728
- State rank
- #821 of 826 in TX
Livability — Scissors
- Score
- 57/100
- State rank
- #1265
- US rank
- #22024
Category grades
Schools grade is shown separately in the Schools card above.
Census & demographics
- Census place
- Scissors, TX
- Population (ZIP)
- 51,346
Population outlook (Hidalgo County) Hauer SSP2
- Today (2025)
- 955,232 people
- By 2030
- 1,009,774 · +5.7%
- By 2040
- 1,120,332 · +17.3%
- By 2050
- 1,225,036 · +28.2%
- By 2075
- 1,439,189 · +50.7%
- By 2100
- 1,533,429 · +60.5%
Race, ethnicity, and origin ACS 2023
- Neighborhood character
- Predominantly Hispanic (95%)
- Race & ethnicity
- Hispanic / Latino 95% Two or more races 49% White 4%
- Hispanic origin (detail)
- Mexican 91%
- Foreign-born
- 27% · Canada
- Languages at home
- 15% English-only · Spanish 84%
Political lean MEDSL · Hidalgo
- 2024 margin
- Toss-up / Even · D 48.1% · R 51.0%
- 2008→2024 swing
- -41.6pp toward R · 2008: 38.7pp · 2024: -2.9pp
- All cycles
- 2024: R+2.9 2020: D+17.1 2016: D+40.5 2012: D+41.8 2008: D+38.7
Not yet ingested
- Civics
- —
Market trends
- HPI YoY
- ▲ 13.30%
- Current HPI
- 243.3933
- Rent YoY
- —
- Metro
- —
- State GDP YoY
- ▲ 3.95%
- F500 in state
- 110
Industry mix (Fortune 500 HQ in TX)
| Industry | F500 HQs | Revenue |
|---|---|---|
| Energy | 16 | $1,198B |
|
||
| Technology | 5 | $198B |
|
||
| Engineering / Construction | 4 | $72B |
|
||
| Energy Services | 3 | $60B |
|
||
| Utilities | 3 | $41B |
|
||
| Healthcare | 2 | $330B |
|
||
Price history
3 events — show timeline
- 2026-05-21 Listed $90,000 MCALLENMLS
- 2021-11-15 Sold (Public Records) — Public Records
- 1998-12-15 Sold (Public Records) — Public Records
Property tax history
+10.6%/yrLatest (2025): $3,085 · +71.2% YoY. Source: county tax records.
Cash-flow waterfall
monthlySold comps — $/sqft
last 12 mo · ≤1 miLoading sold comps…