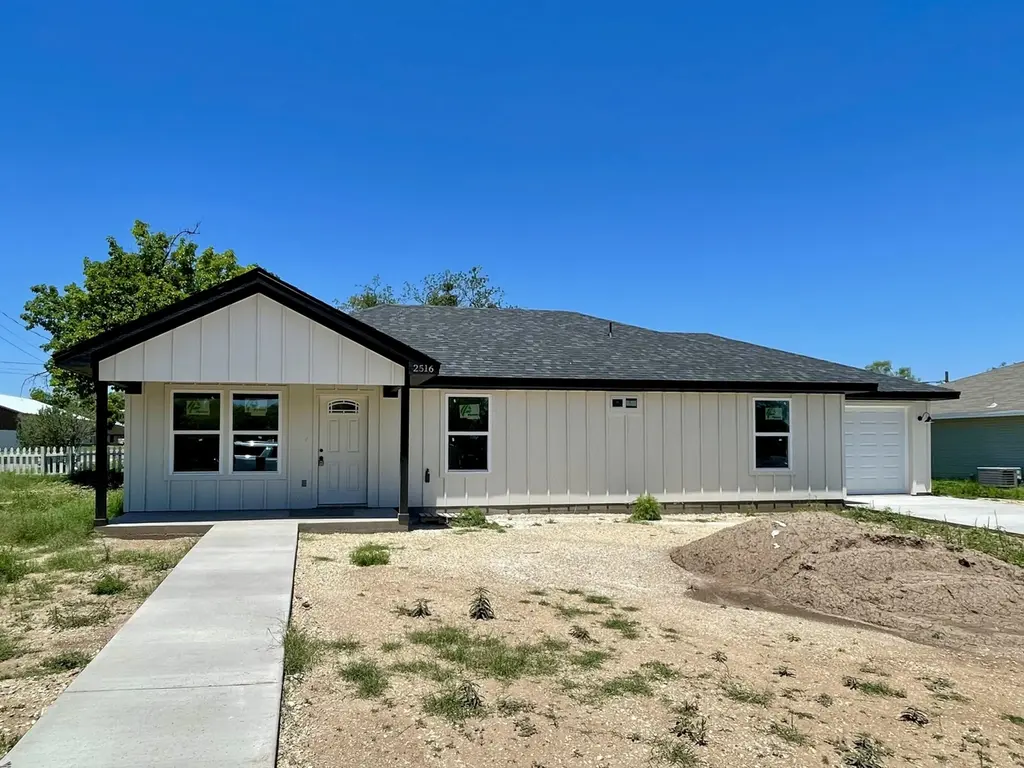
2516 Waco St · San Angelo, TX
Flood risk 1/10 · Minimal
- FEMA flood zone
- X (unshaded)
- Chance of flooding over 30 yrs
- 0.0%
- Est. flood insurance / yr
- $507 – $1,088
Fire risk 7/10 · Major
- Est. fire insurance / yr
- $1,222 – $2,270
Heat risk 7/10 · Major
- Hot days now (above 104°F)
- 7 days/yr
- Hot days in 30 yrs
- 23 days/yr
Wind risk 4/10 · Minor
- Chance of severe wind over 30 yrs
- 12.0%
Air-quality risk 1/10 · Minimal
- Unhealthy air days now
- 0 days/yr
- Unhealthy air days in 30 yrs
- 0 days/yr
Risk factors via First Street. Map © Google.
Why this score? — see what drove the F grade
The composite is a weighted blend of 9 inputs, each scored 0–100. Each bar is that input's sub-score; the figure is the points it added to the 100-point composite (weight × sub-score).
- Appreciation +10.0/10.0
- Cash flow +7.2/30.0
- Rent growth +3.9/5.0
- Livability +3.7/5.0
- Schools +2.6/10.0
- Condition / age +2.5/5.0
- 1% rule +2.0/10.0
- DSCR +1.4/10.0
- ARV discount +0.0/15.0
$229,900
🖨 Deal sheet (PDF) 📄 Offer letter ✓ Due diligence
Listing remarks
Be the first to own this beautiful new construction home, with completion expected by the end of March! Interior photos are representative of the planned finishes. This 3-bedroom, 2-bath home will feature an open-concept layout with a dining area, a 1-car garage, granite countertops, stainless steel appliances, and a designated laundry room. Seller assisting with buyer's closing costs is available — don't miss out!
Key facts
- 6,403 sq ft lot
- Garage
- Built 2026
Property features AI
Exterior
- Parking: Attached garage with garage door opener; Driveway; Garage faces front; 1 garage space
- Security: Smoke detector(s)
- Utilities: Public water; Public sewer; Electric service
- Home design: Single family residence; One story; New construction
- Construction: Brick and other exterior materials; Slab foundation; Composition/shingle roof; Built recently (new construction)
- Exterior features: Porch; Privacy fencing; Corner lot; Paved city street frontage; Publicly maintained road
Interior
- Kitchen: Dishwasher; Disposal; Electric range; Microwave; Granite countertops
- Flooring: Carpet; Tile
- Bathrooms: 2 full bathrooms
- Heating & cooling: Central heating (electric); Central air; Ceiling fans
- Interior features: Granite counters; Ceiling fans; Double-pane windows; Smoke detector(s)
- Laundry & utility: Laundry room with washer and dryer hookups; Electric water heater; Inside laundry
Neighborhood map
What this means for you Summary
Snapshot
- This is a 3-bed/2.0-bath land listed at $230k.
Deal economics
- At list price, monthly cash flow is $-317 ($-4k/yr) — negative.
- To cash-flow at today's rent, offer at most $184k (19.9% below list).
- To meet the 1% rule (rent ≥ 1% of price), the offer needs to be $161k (29.9% below list).
- Recommended offer: $161k (29.9% below list) — sets the bar for 1% rule.
- Cap rate 4.6% vs local median 3.8% in San Angelo — meaningfully above typical; check what's discounted (condition, days-on-market, listing class) to confirm the premium yield is real.
Location & tenants
- Location reads 73/100 on livability (#199 in TX) — a middle-class / working-renter tenant base. Strengths: cost of living A+, housing A+, health & safety A+; Watch: employment C-, amenities F, commute F.
- San Angelo ISD (urban): math 27% / reading 33% proficiency, ranked #627 of 826 in TX (top 76%) — families likely to look elsewhere, expect single-tenant / working-renter base with shorter leases.
- Zoned schools: Mcgill El (math 42% / reading 42%, grade F, #1,335 of 4,322 statewide, top 33%, 306 students, 79% FRL); Lone Star Middle (math 28% / reading 32%, grade F, #1,056 of 1,662 statewide, top 65%, 903 students, 63% FRL); Central H S (math 22% / reading 43%, grade F, #1,029 of 1,632 statewide, top 64%, 3,065 students, 48% FRL).
- Market conditions: Rents rising fast (+5.8%/yr); 334 active listings in the ZIP; 28 comparable units currently listed for rent nearby; rentals lingering (median 46d on market — plan ~5-8 weeks vacancy on turnover, expect pricing pressure); 57% of comp listings sitting > 30 days — soft ceiling on asking rent; 233 units permitted in Tom Green County in 2024 (0 in 5+ unit buildings).
Forward outlook
- In year one you build about $25k of equity ($2k loan paydown + $23k appreciation (10.0% local appreciation)).
- Tom Green County population projected at +35% by 2050 — long-run rental-demand tailwind backs the buy-and-hold thesis.
- By year 2, paydown + projected appreciation supports a ~$40k cash-out refi (75% LTV) — recoverable capital for the next deal without selling this one.
Negotiation context
- It's been on market 21 days — a 2% lower offer ($226k) is reasonable based on typical stale-listing flexibility.
- 2 sale attempts with the ask held roughly flat each time — persistent listings suggest the price (not the market) is what's stuck; bring a comps-based counter.
Risks & watch-outs
- Climate carrying-cost: major wildfire risk; extreme-heat days projected 7→23/yr by 2055 (HVAC capex compounding) — expect insurance premiums to compound above CPI over the hold.
Questions for the listing agent
- What do current leases actually rent for vs. the listed asking? Can we see a recent rent roll and the last 12 months of T-12 income?
- Is there a deadline driving the sale (1031 exchange, divorce, estate, relocation)? That informs how much negotiation room exists.
- Schools are F-rated, which usually means shorter tenancies and higher turnover. Who's the typical renter profile here, and what's been the actual vacancy rate?
- The area grade is low — what's the realistic commute time and amenity access for the typical tenant pool here? Any planned neighborhood developments (good or bad) we should know about?
- What's the average days-on-market for RENTAL listings here right now (not sales)? A rising rental-DOM trend means longer vacancies and softer asking-rent achievability than the comps imply.
- What's the recent tenant-quality profile in this submarket — average credit score on applications, eviction rate, late-payment / NSF rate, and stable-employment percentage? A property-management company in the area should have these aggregated.
- How much new for-sale + rental construction is in the pipeline within 1–3 miles? Heavy new supply typically softens prices + rents 12–24 months out; constrained supply supports both.
Investment metrics
- 1% rule
- 0.70% ✗
- Cap rate
- 4.64%
- Cash-on-cash
- -5.90%
- DSCR
- 0.74
- GRM
- 11.9
CMA / ARV
- ARV (median comp)
- $155,740
- List price
- $229,900
- Delta
- 47.62%
- Verdict
- OVERPRICED
- Comps
- 20 within 1.0 mi
Projected returns pro-forma
10.0% appreciation · 5.78% rent growth · sell at horizon
- IRR
- 20.9%
- Equity multiple
- 2.70×
- Total profit
- $109,706
- Equity at exit
- $207,112
- IRR
- 19.6%
- Equity multiple
- 6.43×
- Total profit
- $349,477
- Equity at exit
- $446,645
Cash invested: $64,372 (down + closing). Projections, not guarantees.
Landlord ↔ Tenant lean methodology
- Overall (STATE)
- 87 Strongly Landlord-Friendly
- State Texas
- 87 Strongly Landlord-Friendly · R+5
- County
- — inherits STATE
- City
- — inherits STATE
ZIP-level market 76901
- Home prices YoY
- 6.4%
- Rents YoY
- 5.8%
- Active inventory
- 334
- Price-to-rent
- 11.9×
Monthly cashflow live
- Estimated rent
- $1,610 high interval (Pro) →
- Mortgage (P&I)
- −$1,206
- Tax est. 1.5%
- −$287 /mo · $3,448/yr
- Insurance
- −$96
- HOA
- −$0
- Vacancy / Maint / Mgmt
- −$338
- Net cashflow
- $-317
Break-even live
Sensitivity live
| Price | -10% $-158 | -5% $-237 | +0% $-317 | +5% $-396 | +10% $-475 |
|---|---|---|---|---|---|
| Rent | -10% $-444 | -5% $-380 | +0% $-317 | +5% $-253 | +10% $-189 |
| Rate | -1.0pp $-201 | -0.5pp $-258 | base $-317 | +0.5pp $-376 | +1.0pp $-437 |
UW: 25.0% down · 7.5% · 30yr · 1.5% tax · 5.0% vac · 8.0% maint · 8.0% mgmt
Financing live
Cash to close
- Down payment
- $57,475
- Closing costs
- $6,897
- Reserves months
- —
- Total cash needed
- —
Loan-product check · same deal, 3 products live
Conventional
25% down · 7.5% · 30yr
- Down + closing
- —
- Monthly P&I
- —
- Monthly cashflow
- —
- DSCR
- —
- Eligible?
- —
Personal DTI + credit; lowest rate.
DSCR
20% down · 8.5% · 30yr
- Down + closing
- —
- Monthly P&I
- —
- Monthly cashflow
- —
- DSCR
- —
- Eligible?
- —
No personal income docs; deal must DSCR.
Hard money
10% down · 12.0% · 12mo
- Down + closing
- —
- Monthly P&I
- —
- Monthly cashflow
- —
- DSCR
- —
- Eligible?
- —
Short-term bridge; refi at stabilization.
Rent comps 28 comps
| Address | Beds | Baths | Sqft | Rent | $/sqft | DOM | Units | Dist |
|---|---|---|---|---|---|---|---|---|
| 2630 Waco St San Angelo, TX | 3.0 | 2.0 | 1024 | $1,600 | $1.56 | 23d | 1 | 0.07mi |
| 2425 Waco St San Angelo, TX | 4.0 | 1.0 | 1225 | $1,395 | $1.14 | 45d | 1 | 0.15mi |
| 2804 Abilene St San Angelo, TX | 3.0 | 2.0 | 1304 | $1,550 | $1.19 | 45d | 1 | 0.20mi |
| 2629 Forest Park Ave San Angelo, TX | 3.0 | 2.0 | 1336 | $1,895 | $1.42 | 45d | 1 | 0.27mi |
| 1405 Hassell St San Angelo, TX | 3.0 | 2.0 | 1064 | $1,950 | $1.83 | 45d | 1 | 0.40mi |
| 1210 Guthrie St San Angelo, TX | 3.0 | 2.0 | 1157 | $1,400 | $1.21 | 23d | 1 | 0.47mi |
| 2430 Rio Grande St San Angelo, TX | 3.0 | 1.0 | 1200 | $1,395 | $1.16 | 45d | 1 | 0.51mi |
| 2102 Webster St San Angelo, TX | 3.0 | 1.0 | 1233 | $1,750 | $1.42 | 45d | 1 | 0.53mi |
| 2505 W Harris Ave San Angelo, TX | 2.0 | 2.0 | 1582 | $1,300 | $0.82 | 45d | 1 | 0.66mi |
| 1835 Willow St San Angelo, TX | 3.0 | 1.0 | 1267 | $1,750 | $1.38 | 45d | 1 | 0.69mi |
| 2802 Field St San Angelo, TX | 3.0 | 2.0 | 1384 | $1,600 | $1.16 | 45d | 1 | 0.73mi |
| 2102 Raney St San Angelo, TX | 3.0 | 1.0 | 1040 | $1,295 | $1.25 | 23d | 1 | 0.85mi |
| 1929 Raney St San Angelo, TX | 1.0–2.0 | 1.0–2.0 | 765 | $1,000 | $1.31 | 23d | 4 | 0.86mi |
| 711 N Monroe St San Angelo, TX | 3.0 | 1.0 | 1345 | $1,500 | $1.12 | 45d | 1 | 0.89mi |
| 1905 Meadowbrook Dr San Angelo, TX | 3.0 | 2.0 | 1184 | $1,400 | $1.18 | 45d | 1 | 0.91mi |
| 3755 Arden Rd San Angelo, TX | 2.0–3.0 | 1.0 | 875 | $1,025 | $1.17 | 23d | 1 | 0.91mi |
| 3344 Trinity Ave San Angelo, TX | 3.0 | 2.0 | 1545 | $1,900 | $1.23 | 23d | 1 | 0.99mi |
| 3801 Arden Rd Apt 65 San Angelo, TX | 2.0 | 2.0 | 1025 | $1,199 | $1.17 | 23d | 1 | 1.05mi |
| 3801 Arden Rd Apt 108 San Angelo, TX | 2.0 | 2.0 | 1025 | $1,215 | $1.19 | 45d | 1 | 1.05mi |
| 279 Glenna Dr San Angelo, TX | 3.0 | 2.0 | 1625 | $1,795 | $1.10 | 23d | 1 | 1.13mi |
| 210 N Jefferson St #210 San Angelo, TX | 3.0 | 3.0 | 1706 | $1,600 | $0.94 | 23d | 1 | 1.14mi |
| 3207 Trinity Ave San Angelo, TX | 3.0 | 2.0 | 1536 | $1,995 | $1.30 | 45d | 1 | 1.16mi |
| 2013 Rosemont Dr San Angelo, TX | 3.0 | 2.0 | 1400 | $2,100 | $1.50 | 23d | 1 | 1.28mi |
| 2756 Sac Ave San Angelo, TX | 3.0 | 1.0 | 1461 | $1,650 | $1.13 | 45d | 1 | 1.28mi |
| 902 Shiloh St Unit RE-908-C San Angelo, TX | 2.0 | 1.5 | 925 | $1,175 | $1.27 | 45d | 1 | 1.38mi |
| 902 Shiloh St Unit RE-908-16 San Angelo, TX | 2.0 | 1.0 | 875 | $1,125 | $1.29 | 45d | 1 | 1.38mi |
| 1725 West Avenue M Unit M San Angelo, TX | 2.0 | 1.0 | 1202 | $1,350 | $1.12 | 23d | 1 | 1.44mi |
| 2431 College Hills Blvd San Angelo, TX | 1.0–3.0 | 1.0–2.0 | 1025 | $1,609 | $1.57 | 23d | 17 | 1.46mi |
Listing history 3 events
-
2026-05-02$229,900 Active 424-char remark
-
2026-02-25historical
-
2026-02-25$229,900 Active
ⓘ Source: listings_history table (triggers on properties + properties_extension) + one-shot
backfill from property_details.listing_events for pre-trigger history.
Climate risk First Street
- Flood 1/10 Low FEMA zone X (unshaded) · 0% chance over 30 yrs
- Wildfire 7/10 Severe
- Heat 7/10 Severe 7 d/yr ≥104°F today · 23 d/yr by 30 yrs out
- Wind 4/10 Moderate 12% chance of damaging wind over 30 yrs
- Air quality 1/10 Low 0 unhealthy d/yr today · 0 by 30 yrs out
Nearby sold comps map
Loading sold comps map…
Walkable amenities ~0.75 mi
Loading nearby amenities…
Taxation est. · year 1
- Rental income
- $19,326
- − Mortgage interest
- −$12,878
- − Property taxes
- −$3,448
- − Insurance
- −$1,150
- − Repairs & maintenance
- −$1,546
- − Management
- −$1,546
- − Depreciation
- −$6,688
- Taxable loss
- −$7,930
- Est. tax savings @ 24.0%
- +$1,903
- After-tax cash flow
- $-1,895/yr
For passive investors: Depreciation is non-cash, so a rental often shows a tax loss while cash-flowing — sheltering income. Rental losses are passive: they offset passive income freely, and up to $25,000/yr can offset ordinary (W-2) income if you actively participate and your MAGI is under $100k (phasing out to $0 by $150k); unused losses carry forward. On sale, claimed depreciation is recaptured at up to 25%, and gains may owe capital-gains tax (a 1031 exchange can defer both). Figures are a year-1 estimate at your 24.0% rate — not tax advice; consult a CPA.
Schools (NCES district)
- District
- San Angelo ISD
- NCES district ID
- 4838700
- Math proficiency
- 27% ▼ -9.00%
- Reading proficiency
- 33% ▼ -3.00%
- Median HH income
- $43,501
- Composite
- 25.56/100
- National rank
- #7427
- State rank
- #627 of 826 in TX
Livability — San Angelo
- Score
- 73/100
- State rank
- #199
- US rank
- #5030
Category grades
Schools grade is shown separately in the Schools card above.
Census & demographics
- Census place
- San Angelo, TX
- County
- Tom Green County · 113,188 people
- City population
- 81,357
- Metro
- San Angelo, TX
- Population (ZIP)
- 31,831
- Household income
- $69,450
- Rent vs Own
- Severe rent burden
- 1034.0
Population outlook (Tom Green County) Hauer SSP2
- Today (2025)
- 135,110 people
- By 2030
- 144,090 · +6.6%
- By 2040
- 162,561 · +20.3%
- By 2050
- 182,158 · +34.8%
- By 2075
- 232,274 · +71.9%
- By 2100
- 268,218 · +98.5%
Race, ethnicity, and origin ACS 2023
- Neighborhood character
- Majority White (55%)
- Race & ethnicity
- White 55% Hispanic / Latino 41% Two or more races 17% Black 2%
- Hispanic origin (detail)
- Mexican 38%
- Common ancestry
- Lithuanian 3% Slovak 3% Iranian 1%
- Foreign-born
- 5% · Canada
- Languages at home
- 77% English-only · Spanish 21% German/W. Germanic 1%
Political lean MEDSL · Tom Green
- 2024 margin
- Solid R (+48.0) · D 25.5% · R 73.5% · Other 1.0%
- 2008→2024 swing
- -6.3pp toward R · 2008: -41.7pp · 2024: -48.0pp
- All cycles
- 2024: R+48.0 2020: R+44.4 2016: R+47.9 2012: R+47.9 2008: R+41.7
Not yet ingested
- Civics
- —
Market trends
- HPI YoY
- ▲ 47.96%
- Current HPI
- 798.58
- Rent YoY
- ▲ 5.78%
- Metro
- San Angelo, TX
- State GDP YoY
- ▲ 3.95%
- F500 in state
- 110
Industry mix (Fortune 500 HQ in TX)
| Industry | F500 HQs | Revenue |
|---|---|---|
| Energy | 16 | $1,198B |
|
||
| Technology | 5 | $198B |
|
||
| Engineering / Construction | 4 | $72B |
|
||
| Energy Services | 3 | $60B |
|
||
| Utilities | 3 | $41B |
|
||
| Healthcare | 2 | $330B |
|
||
Price history
+0.0% since first listed4 events — show timeline
- 2026-05-26 Pending — SAAR TX
- 2026-05-02 Listed $229,900 SAAR TX
- 2026-02-25 Delisted — SAAR TX
- 2026-02-25 Listed $229,900 SAAR TX
Property tax history
-1.9%/yrLatest (2025): $431 · +19.2% YoY. Source: county tax records.
Cash-flow waterfall
monthlySold comps — $/sqft
last 12 mo · ≤1 miLoading sold comps…