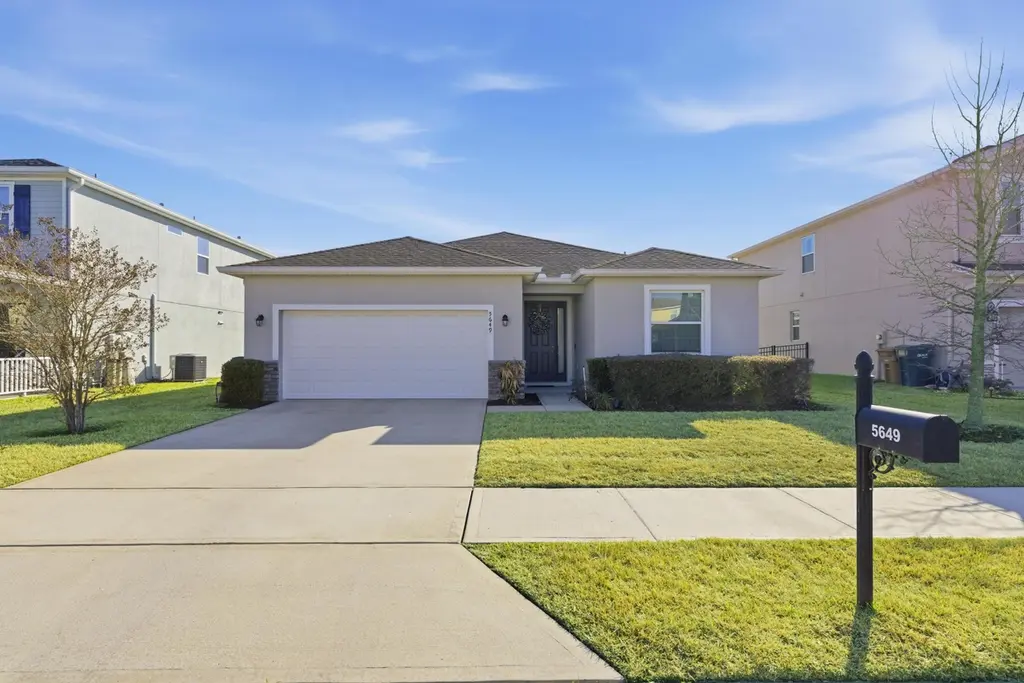
5649 SW 50th Ave · Ocala, FL
Flood risk 1/10 · Minimal
- FEMA flood zone
- X (unshaded)
- Chance of flooding over 30 yrs
- 0.0%
- Est. flood insurance / yr
- $507 – $1,088
Fire risk 4/10 · Minor
- Est. fire insurance / yr
- $947 – $1,759
Heat risk 8/10 · Major
- Hot days now (above 107°F)
- 7 days/yr
- Hot days in 30 yrs
- 22 days/yr
Wind risk 9/10 · Severe
- Chance of severe wind over 30 yrs
- 99.0%
Air-quality risk 2/10 · Minimal
- Unhealthy air days now
- 2 days/yr
- Unhealthy air days in 30 yrs
- 2 days/yr
Risk factors via First Street. Map © Google.
Why this score? — see what drove the D grade
The composite is a weighted blend of 9 inputs, each scored 0–100. Each bar is that input's sub-score; the figure is the points it added to the 100-point composite (weight × sub-score).
- ARV discount +15.0/15.0
- Cash flow +8.5/30.0
- Schools +3.6/10.0
- Livability +3.5/5.0
- 1% rule +2.6/10.0
- Rent growth +2.5/5.0
- Condition / age +2.5/5.0
- DSCR +2.3/10.0
- Appreciation +0.0/10.0
$327,500
🖨 Deal sheet (PDF) 📄 Offer letter ✓ Due diligence
Listing remarks MLS
Welcome to the picturesque, gated community of Heathbrook Meadows, conveniently located in the heart of Southwest Ocala. This spacious 4-bedroom, 2.5-bath home offers an open-concept floor plan ideal for everyday living and entertaining. Designed to accommodate everyone, the layout provides seamless flow and generous gathering spaces. Enjoy summers at the community pool, or host your own gatherings at home on the private pond lot, offering both tranquility and ample space for family and friends. This exceptional opportunity won't last--schedule your private showing today.
Key facts
- Gated community
- Community pool
- Private pond lot
Tags
Neighborhood map
What this means for you Summary
Snapshot
- This is a 4-bed/2.5-bath single-family listed at $328k.
Deal economics
- At list price, monthly cash flow is $-290 ($-3k/yr) — negative.
- To cash-flow at today's rent, offer at most $276k (15.6% below list).
- To meet the 1% rule (rent ≥ 1% of price), the offer needs to be $248k (24.3% below list).
- Recommended offer: $248k (24.3% below list) — sets the bar for 1% rule.
- Cap rate 5.2% vs local median 4.1% in Ocala — meaningfully above typical; check what's discounted (condition, days-on-market, listing class) to confirm the premium yield is real.
Location & tenants
- Location reads 69/100 on livability (#476 in FL) — a middle-class / working-renter tenant base. Strengths: cost of living A+, housing A+, health & safety A+; Watch: crime F, amenities F, commute F.
- Marion (rural): math 42% / reading 43% proficiency, ranked #61 of 73 in FL (top 84%) — families likely to look elsewhere, expect single-tenant / working-renter base with shorter leases; 61% free/reduced lunch — lower-income household profile, screen leases tightly.
- Zoned schools: Saddlewood Elementary School (math 62% / reading 54%, grade C+, #751 of 2,144 statewide, top 36%, 917 students, 58% FRL); Liberty Middle School (math 40% / reading 41%, grade F, #360 of 571 statewide, top 64%, 1,365 students, 54% FRL); West Port High School (math 34% / reading 52%, grade F, #255 of 667 statewide, top 39%, 2,906 students, 52% FRL).
- Market conditions: Rents flat; 299 active listings in the ZIP; 16 comparable units currently listed for rent nearby; rentals at typical pace (median 24d on market — plan ~3-4 weeks tenant-placement turnaround); 7,071 units permitted in Marion County in 2024 (534 in 5+ unit buildings).
- At $2,478/mo this rent would consume 46% of the median local household income ($65k/yr) (locally 1062% of renters already pay >50% of income on rent) — very limited rent-growth headroom before tenants either downsize or default.
Forward outlook
- Local home prices are declining (-3.0%/yr); year-one equity from $2k of loan paydown is wiped out by about $10k of value loss. Plan a longer hold.
- Marion County population projected at +13% by 2050 — modest demand growth; plan on rents tracking national, not racing it.
Negotiation context
- It's been on market 117 days — a 9% lower offer ($298k) is reasonable based on typical stale-listing flexibility.
- 3 sale attempts since 9y ago with the ask held roughly flat each time — persistent listings suggest the price (not the market) is what's stuck; bring a comps-based counter.
- Current owner paid $253k; 29% above their basis — modest negotiation headroom, anchor on the comps not their cost.
Risks & watch-outs
- Climate carrying-cost: severe wind risk, 99% chance of damaging wind over 30y; extreme-heat days projected 7→22/yr by 2055 (HVAC capex compounding) — expect insurance premiums to compound above CPI over the hold.
Questions for the listing agent
- What do current leases actually rent for vs. the listed asking? Can we see a recent rent roll and the last 12 months of T-12 income?
- It's been on market 117 days. Have you received any prior offers? Is the seller open to a 24% concession, seller financing, or rate buy-down credit?
- What does the HOA fee cover, when was the last increase, and are there any pending special assessments or reserve-fund shortfalls?
- Why hasn't it sold? Are there any deal-killer items the seller is aware of (foundation, flood, title, zoning, code violations)?
- Is there a deadline driving the sale (1031 exchange, divorce, estate, relocation)? That informs how much negotiation room exists.
- Crime grade is F in this area — have there been break-ins, vandalism, or insurance claims at this property in the last 3 years? What carrier currently insures it and at what premium?
- The area grade is low — what's the realistic commute time and amenity access for the typical tenant pool here? Any planned neighborhood developments (good or bad) we should know about?
- What's the average days-on-market for RENTAL listings here right now (not sales)? A rising rental-DOM trend means longer vacancies and softer asking-rent achievability than the comps imply.
- What's the recent tenant-quality profile in this submarket — average credit score on applications, eviction rate, late-payment / NSF rate, and stable-employment percentage? A property-management company in the area should have these aggregated.
- How much new for-sale + rental construction is in the pipeline within 1–3 miles? Heavy new supply typically softens prices + rents 12–24 months out; constrained supply supports both.
Investment metrics
- 1% rule
- 0.76% ✗
- Cap rate
- 5.23%
- Cash-on-cash
- -3.79%
- DSCR
- 0.83
- GRM
- 11.0
CMA / ARV
- ARV (median comp)
- $396,185
- List price
- $327,500
- Delta
- -17.34%
- Verdict
- UNDERPRICED
- Comps
- 20 within 1.0 mi
Show comp detail 4 sales within ~0.75 mi
| Address | Dist | Beds/Ba | Sqft | Sold | Price | $/sf | Match |
|---|---|---|---|---|---|---|---|
| 4723 SW 62nd Pl | 0.23mi | 3/2.0 (-1) | 2,035 (-1%) | 13mo | $393,000 | $193 | 70 |
| 4743 SW 62nd Pl | 0.23mi | 4/3.0 | 2,226 (+8%) | 10mo | $425,000 | $191 | 65 |
| 4204 SW 53rd Lane Rd | 0.74mi | 4/2.5 | 2,045 (-0%) | 12mo | $355,990 | $174 | 55 |
| 6535 SW 50th Ct | 0.42mi | 3/2.0 (-1) | 1,864 (-9%) | 21mo | $340,000 | $182 | 41 |
Match score weights: distance 35% · size 25% · config 20% · recency 20%. Top-matched comps best support the ARV.
Projected returns pro-forma
-3.0% appreciation · 0.12% rent growth · sell at horizon
- IRR
- -25.9%
- Equity multiple
- 0.14×
- Total profit
- $-78,466
- Equity at exit
- $48,831
- IRR
- -35.4%
- Equity multiple
- -0.30×
- Total profit
- $-119,002
- Equity at exit
- $28,316
Cash invested: $91,700 (down + closing). Projections, not guarantees.
Landlord ↔ Tenant lean methodology
- Overall (STATE)
- 87 Strongly Landlord-Friendly
- State Florida
- 87 Strongly Landlord-Friendly · R+3
- County
- — inherits STATE
- City
- — inherits STATE
ZIP-level market 34474
- Home prices YoY
- -28.4%
- Rents YoY
- 0.1%
- Active inventory
- 299
- Price-to-rent
- 11.0×
Monthly cashflow live
- Estimated rent
- $2,478 high interval (Pro) →
- Mortgage (P&I)
- −$1,717
- Tax from tax record
- −$280 /mo · $3,362/yr
- Insurance
- −$136
- HOA
- −$113
- Lot rent
- −$0
- Vacancy / Maint / Mgmt
- −$520
- Net cashflow
- $-290
Break-even live
Sensitivity live
| Price | -10% $-104 | -5% $-197 | +0% $-290 | +5% $-382 | +10% $-475 |
|---|---|---|---|---|---|
| Rent | -10% $-485 | -5% $-387 | +0% $-290 | +5% $-192 | +10% $-94 |
| Rate | -1.0pp $-125 | -0.5pp $-206 | base $-290 | +0.5pp $-374 | +1.0pp $-461 |
UW: 25.0% down · 7.5% · 30yr · 1.5% tax · 5.0% vac · 8.0% maint · 8.0% mgmt
Financing live
Cash to close
- Down payment
- $81,875
- Closing costs
- $9,825
- Reserves months
- —
- Total cash needed
- —
Loan-product check · same deal, 3 products live
Conventional
25% down · 7.5% · 30yr
- Down + closing
- —
- Monthly P&I
- —
- Monthly cashflow
- —
- DSCR
- —
- Eligible?
- —
Personal DTI + credit; lowest rate.
DSCR
20% down · 8.5% · 30yr
- Down + closing
- —
- Monthly P&I
- —
- Monthly cashflow
- —
- DSCR
- —
- Eligible?
- —
No personal income docs; deal must DSCR.
Hard money
10% down · 12.0% · 12mo
- Down + closing
- —
- Monthly P&I
- —
- Monthly cashflow
- —
- DSCR
- —
- Eligible?
- —
Short-term bridge; refi at stabilization.
Rent comps 16 comps
| Address | Beds | Baths | Sqft | Rent | $/sqft | DOM | Units | Dist |
|---|---|---|---|---|---|---|---|---|
| 5432 SW 49th Ave Ocala, FL | 4.0 | 3.0 | 2886 | $2,500 | $0.87 | 23d | 1 | 0.16mi |
| 5101 SW 60th Street Rd Ocala, FL | 1.0–3.0 | 1.0–2.0 | 1228 | $2,027 | $1.65 | 16d | 28 | 0.23mi |
| 4940 SW 63rd Loop Ocala, FL | 4.0 | 3.0 | 2342 | $2,500 | $1.07 | 23d | 1 | 0.27mi |
| 4987 SW 63rd Loop Ocala, FL | 4.0 | 3.0 | 2251 | $3,850 | $1.71 | 23d | 1 | 0.33mi |
| 4261 SW 62nd Loop Ocala, FL | 4.0 | 3.0 | 2550 | $2,300 | $0.90 | 23d | 1 | 0.48mi |
| 4552 SW 65th Pl Ocala, FL | 4.0 | 3.0 | 2344 | $2,200 | $0.94 | 23d | 1 | 0.51mi |
| 4251 SW 53rd Lane Rd Ocala, FL | 5.0 | 3.0 | 2605 | $2,700 | $1.04 | 23d | 1 | 0.69mi |
| 4820 SW 48th Ave Ocala, FL | 1.0–3.0 | 1.0–2.0 | 1149 | $2,274 | $1.98 | 16d | 34 | 0.73mi |
| 4900 SW 46th Ct Ocala, FL | 1.0–3.0 | 1.0–2.0 | 1178 | $1,725 | $1.46 | 16d | 32 | 0.86mi |
| 4015 SW 54th Street Rd Ocala, FL | 4.0 | 2.5 | 2045 | $2,500 | $1.22 | 16d | 1 | 0.89mi |
| 4970 SW 45th St Ocala, FL | 3.0 | 2.5 | 1542 | $1,800 | $1.17 | 16d | 1 | 1.09mi |
| 4199 SW 46th Ct Ocala, FL | 4.0 | 3.5 | 2511 | $2,500 | $1.00 | 23d | 1 | 1.15mi |
| 4304 SW 54th Ct Ocala, FL | 3.0 | 2.0 | 1714 | $1,900 | $1.11 | 23d | 1 | 1.30mi |
| 5134 SW 41st St Ocala, FL | 4.0 | 2.0 | 2185 | $2,250 | $1.03 | 16d | 1 | 1.32mi |
| 4095 SW 51st Ct Ocala, FL | 4.0 | 2.0 | 1944 | $1,995 | $1.03 | 16d | 1 | 1.34mi |
| 4013 SW 51st Ct Ocala, FL | 4.0 | 3.5 | 2510 | $2,400 | $0.96 | 23d | 1 | 1.41mi |
HOA detail
- Monthly dues
- $113 · $1,356/yr
- Likely covers
- poolsecurity
Listing history 24 events
-
2026-06-22days on market $327,500 Active 117 DOM
-
2026-06-18days on market $327,500 Active 114 DOM
-
2026-06-17days on market $327,500 Active 113 DOM
-
2026-06-16days on market $327,500 Active 112 DOM
-
2026-06-15days on market $327,500 Active 111 DOM
-
2026-06-14days on market $327,500 Active 109 DOM
-
2026-06-13days on market $327,500 Active 108 DOM
-
2026-06-10days on market $327,500 Active 106 DOM
-
2026-06-09days on market $327,500 Active 105 DOM
-
2026-06-08days on market $327,500 Active 104 DOM
-
2026-06-07days on market $327,500 Active 103 DOM
-
2026-06-03days on market $327,500 Active 99 DOM
-
2026-06-02days on market $327,500 Active 98 DOM
-
2026-06-01days on market $327,500 Active 97 DOM
-
2026-05-31days on market $327,500 Active 96 DOM
-
2026-05-30days on market $327,500 Active 95 DOM
-
2026-04-30price $327,500 578-char remark
Show marketing remark (578 chars)
Welcome to the picturesque, gated community of Heathbrook Meadows, conveniently located in the heart of Southwest Ocala. This spacious 4-bedroom, 2.5-bath home offers an open-concept floor plan ideal for everyday living and entertaining. Designed to accommodate everyone, the layout provides seamless flow and generous gathering spaces. Enjoy summers at the community pool, or host your own gatherings at home on the private pond lot, offering both tranquility and ample space for family and friends. This exceptional opportunity won't last--schedule your private showing today.
-
2026-04-09price $327,500 589-char remark
Show marketing remark (589 chars)
Welcome to the picturesque, gated community of Heathbrook Meadows, conveniently located in the heart of Southwest Ocala. This spacious 4-bedroom, 2.5-bath home offers an open-concept floor plan ideal for everyday living and entertaining. Designed to accommodate everyone, the layout provides seamless flow and generous gathering spaces. Enjoy summers at the community pool, or host your own gatherings at home on the private pond lot, offering both tranquility and ample space for family and friends. This exceptional opportunity won’t last—schedule your private showing today.
-
2026-03-06price $329,000 578-char remark
Show marketing remark (589 chars)
Welcome to the picturesque, gated community of Heathbrook Meadows, conveniently located in the heart of Southwest Ocala. This spacious 4-bedroom, 2.5-bath home offers an open-concept floor plan ideal for everyday living and entertaining. Designed to accommodate everyone, the layout provides seamless flow and generous gathering spaces. Enjoy summers at the community pool, or host your own gatherings at home on the private pond lot, offering both tranquility and ample space for family and friends. This exceptional opportunity won’t last—schedule your private showing today.
-
2026-03-06price $329,000 589-char remark
Show marketing remark (589 chars)
Welcome to the picturesque, gated community of Heathbrook Meadows, conveniently located in the heart of Southwest Ocala. This spacious 4-bedroom, 2.5-bath home offers an open-concept floor plan ideal for everyday living and entertaining. Designed to accommodate everyone, the layout provides seamless flow and generous gathering spaces. Enjoy summers at the community pool, or host your own gatherings at home on the private pond lot, offering both tranquility and ample space for family and friends. This exceptional opportunity won’t last—schedule your private showing today.
-
2026-02-24$339,000 Active 578-char remark
Show marketing remark (578 chars)
Welcome to the picturesque, gated community of Heathbrook Meadows, conveniently located in the heart of Southwest Ocala. This spacious 4-bedroom, 2.5-bath home offers an open-concept floor plan ideal for everyday living and entertaining. Designed to accommodate everyone, the layout provides seamless flow and generous gathering spaces. Enjoy summers at the community pool, or host your own gatherings at home on the private pond lot, offering both tranquility and ample space for family and friends. This exceptional opportunity won't last--schedule your private showing today.
-
2026-02-11$339,000 Active 589-char remark
Show marketing remark (589 chars)
Welcome to the picturesque, gated community of Heathbrook Meadows, conveniently located in the heart of Southwest Ocala. This spacious 4-bedroom, 2.5-bath home offers an open-concept floor plan ideal for everyday living and entertaining. Designed to accommodate everyone, the layout provides seamless flow and generous gathering spaces. Enjoy summers at the community pool, or host your own gatherings at home on the private pond lot, offering both tranquility and ample space for family and friends. This exceptional opportunity won’t last—schedule your private showing today.
-
2018-04-25soldstatus $252,990
-
2017-11-14$254,740
ⓘ Source: listings_history table (triggers on properties + properties_extension) + one-shot
backfill from property_details.listing_events for pre-trigger history.
Tax reassessment forecast FL · Resets to sale price
- Current annual tax
- $3,362 · $280/mo
- Projected year-2 tax
- $3,362 · $280/mo
- Expected delta
- $0/yr ($0/mo · 0.0%)
ⓘ Screening estimate from a state-policy table — verify with the county assessor before closing.
Climate risk First Street
- Flood 1/10 Low FEMA zone X (unshaded) · 0% chance over 30 yrs
- Wildfire 4/10 Moderate
- Heat 8/10 Severe 7 d/yr ≥107°F today · 22 d/yr by 30 yrs out
- Wind 9/10 Extreme 99% chance of damaging wind over 30 yrs
- Air quality 2/10 Low 2 unhealthy d/yr today · 2 by 30 yrs out
Nearby sold comps map
Loading sold comps map…
Walkable amenities ~0.75 mi
Loading nearby amenities…
Taxation est. · year 1
- Rental income
- $29,733
- − Mortgage interest
- −$18,345
- − Property taxes
- −$3,362
- − Insurance
- −$1,638
- − Repairs & maintenance
- −$2,379
- − Management
- −$2,379
- − HOA
- −$1,356
- − Depreciation
- −$9,527
- Taxable loss
- −$9,252
- Est. tax savings @ 24.0%
- +$2,220
- After-tax cash flow
- $-1,255/yr
For passive investors: Depreciation is non-cash, so a rental often shows a tax loss while cash-flowing — sheltering income. Rental losses are passive: they offset passive income freely, and up to $25,000/yr can offset ordinary (W-2) income if you actively participate and your MAGI is under $100k (phasing out to $0 by $150k); unused losses carry forward. On sale, claimed depreciation is recaptured at up to 25%, and gains may owe capital-gains tax (a 1031 exchange can defer both). Figures are a year-1 estimate at your 24.0% rate — not tax advice; consult a CPA.
Schools (NCES district)
- District
- Marion
- NCES district ID
- 1201260
- Math proficiency
- 42% ▼ -7.00%
- Reading proficiency
- 43% ▼ -4.00%
- Median HH income
- $40,015
- Composite
- 35.61/100
- National rank
- #4890
- State rank
- #61 of 73 in FL
Livability — Ocala
- Score
- 69/100
- State rank
- #476
- US rank
- #8461
Category grades
Schools grade is shown separately in the Schools card above.
Census & demographics
- Census place
- Ocala, FL
- County
- Marion County · 315,796 people
- City population
- 263,375
- Metro
- Ocala, FL
- Population (ZIP)
- 20,258
- Household income
- $65,291
- Rent vs Own
- Severe rent burden
- 1062.0
Population outlook (Marion County) Hauer SSP2
- Today (2025)
- 365,905 people
- By 2030
- 376,768 · +3.0%
- By 2040
- 396,555 · +8.4%
- By 2050
- 412,723 · +12.8%
- By 2075
- 446,090 · +21.9%
- By 2100
- 436,193 · +19.2%
Race, ethnicity, and origin ACS 2023
- Neighborhood character
- Diverse neighborhood (Simpson 0.64)
- Race & ethnicity
- White 52% Hispanic / Latino 25% Black 13% Two or more races 8% Asian 8%
- Hispanic origin (detail)
- Mexican 2% Puerto Rican 10%
- Common ancestry
- Lithuanian 2% Romanian 2% Slovak 1%
- Foreign-born
- 21% · Canada, Jamaica, Vietnam
- Languages at home
- 71% English-only · Spanish 22% Other Indo-European 4% Vietnamese 1%
Political lean MEDSL · Marion
- 2024 margin
- Solid R (+31.6) · D 33.8% · R 65.5%
- 2008→2024 swing
- -20.0pp toward R · 2008: -11.6pp · 2024: -31.6pp
- All cycles
- 2024: R+31.6 2020: R+25.9 2016: R+26.2 2012: R+16.2 2008: R+11.6
Not yet ingested
- Civics
- —
Market trends
- HPI YoY
- ▼ -78.16%
- Current HPI
- 196.5607
- Rent YoY
- ▲ 0.12%
- Metro
- Ocala, FL
- State GDP YoY
- ▲ 3.28%
- F500 in state
- 36
Industry mix (Fortune 500 HQ in FL)
| Industry | F500 HQs | Revenue |
|---|---|---|
| Industrial Technology | 2 | $29B |
|
||
| Insurance | 2 | $17B |
|
||
| Retail | 1 | $60B |
|
||
| Technology Distribution | 1 | $58B |
|
||
| Homebuilding | 1 | $35B |
|
||
| Technology Manufacturing | 1 | $35B |
|
||
Price history
+28.6% since first listed8 events — show timeline
- 2026-04-30 Price Changed $327,500 Beaches MLS
- 2026-04-09 Price Changed $327,500 Stellar MLS as Distributed by MLS Grid
- 2026-03-06 Price Changed $329,000 Beaches MLS
- 2026-03-06 Price Changed $329,000 Stellar MLS as Distributed by MLS Grid
- 2026-02-24 Listed $339,000 Beaches MLS
- 2026-02-11 Listed $339,000 Stellar MLS as Distributed by MLS Grid
- 2018-04-25 Sold (MLS) $252,990 Stellar MLS as Distributed by MLS Grid
- 2017-11-14 Listed $254,740 Stellar MLS as Distributed by MLS Grid
Property tax history
+33.5%/yrLatest (2025): $3,362 · +1.6% YoY. Source: county tax records.
Cash-flow waterfall
monthlySold comps — $/sqft
last 12 mo · ≤1 miLoading sold comps…