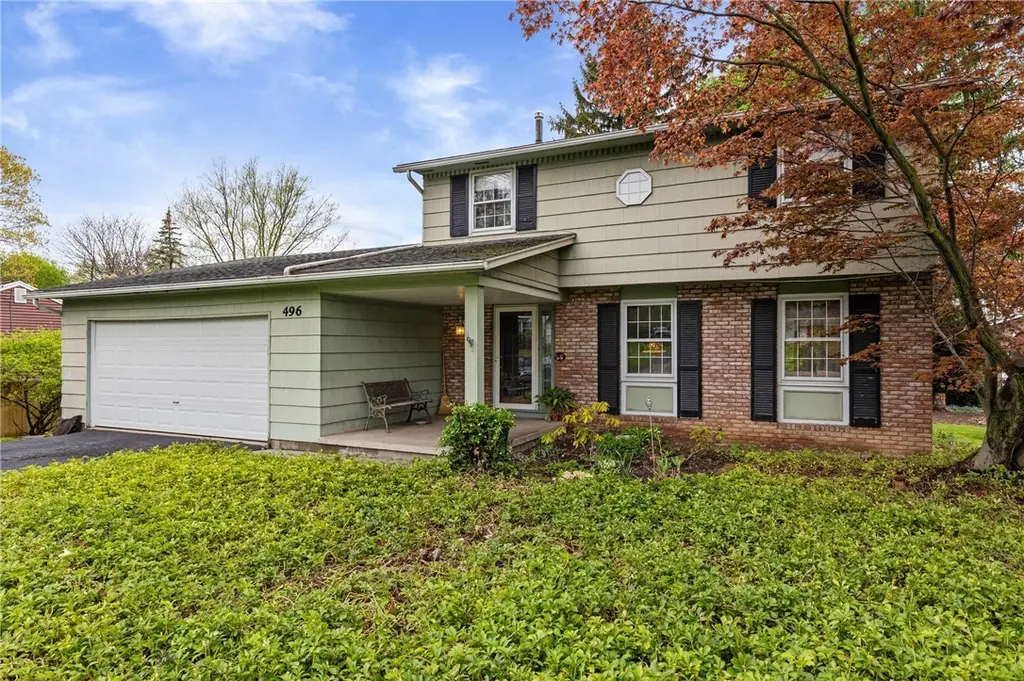
496 Westside Dr · Gates, NY
Flood risk 1/10 · Minimal
- FEMA flood zone
- X (unshaded)
- Chance of flooding over 30 yrs
- 0.0%
- Est. flood insurance / yr
- $473 – $860
Fire risk 1/10 · Minimal
- Est. fire insurance / yr
- $691 – $1,283
Heat risk 2/10 · Minimal
- Hot days now (above 95°F)
- 7 days/yr
- Hot days in 30 yrs
- 15 days/yr
Wind risk 1/10 · Minimal
- Chance of severe wind over 30 yrs
- —
Air-quality risk 2/10 · Minimal
- Unhealthy air days now
- 1 days/yr
- Unhealthy air days in 30 yrs
- 1 days/yr
Risk factors via First Street. Map © Google.
Why this score? — see what drove the B- grade
The composite is a weighted blend of 9 inputs, each scored 0–100. Each bar is that input's sub-score; the figure is the points it added to the 100-point composite (weight × sub-score).
- Cash flow +23.0/30.0
- ARV discount +15.0/15.0
- 1% rule +7.7/10.0
- DSCR +7.4/10.0
- Schools +3.6/10.0
- Livability +3.4/5.0
- Rent growth +2.5/5.0
- Condition / age +2.5/5.0
- Appreciation +0.0/10.0
$179,900
🖨 Deal sheet 📄 Offer letter ✓ Due diligence
Listing remarks
Solid & Spacious Traditional Colonial on nice size treed setting, has been loved & taken care of by the Original Owner for 66 yrs!! Features and updates include Nice Hardwood Flooring throughout most of home, Natural Pine solid Wood Interior Doors, Updated Circuit Breaker Electric Service, Newer Overhead Garage Door & Opener on the full 2 Car Garage, Some new Thermopane Vinyl Replacement Windows, High Efficiency Furnace and Central Air new in 2016 approximately, Hot Water tank new in 2020, Architectural Roofing & some new plywood approximately 15 yrs old and other odds and ends! Woodburning Fireplace in Family Room was checked approximately 5 yrs ago, but Seller make
Key facts
- Hardwood flooring
- Hot water tank
- Central air
Tags
Property features AI
Exterior
- Parking: Attached garage with storage; Garage door opener; Two garage spaces
- Utilities: Electricity connected (circuit breakers); Public water connected; Sewer connected; Cable available
- Home design: Two-story house; Existing (previously built) property; Main thoroughfare road frontage; Rectangular, wooded lot (approx. 0.34 acres; dimensions 87 x 175)
- Construction: Composite siding; Copper plumbing; Asphalt roof; Block foundation; Resale condition
- Exterior features: Blacktop driveway; Covered and open porch; Patio/porch areas
Interior
- Kitchen: Free-standing range; Oven; Microwave; Refrigerator; Freezer
- Basement: Full basement
- Bedrooms: Total rooms include bedroom spaces (7 total rooms listed)
- Flooring: Hardwood; Resilient flooring; Varies by room
- Bathrooms: One full bathroom; One half bathroom; One main-level bathroom
- Fireplaces: One fireplace
- Heating & cooling: Gas forced-air heating; Central air conditioning
- Interior features: Separate/formal dining room; Entrance foyer; Eat-in kitchen; Separate/formal living room; Sliding glass door(s); Natural woodwork; Window treatments; Drapes; Storm windows; Thermal windows; Sliding doors; See remarks/other interior notes
- Laundry & utility: Washer; Dryer; Laundry located in basement
Neighborhood map
What this means for you Summary
Snapshot
- This is a 3-bed/1.5-bath single-family listed at $180k.
Deal economics
- At list price, monthly cash flow is $319 ($4k/yr) — positive.
- The deal already cash-flows at list — no discount required.
- Meets the 1% rule at list price ($2k rent vs $180k).
- Cap rate 8.4% vs local median 5.9% in Gates — top-decile yield for the area; either an underpriced asset or a hidden risk that comps aren't pricing in. Stress-test before assuming the spread holds.
Location & tenants
- Location reads 67/100 on livability (#582 in NY) — a middle-class / working-renter tenant base. Strengths: housing A+, health & safety A+; Watch: amenities F, commute F.
- Gates-Chili Central School District (suburban): math 41% / reading 42% proficiency, ranked #491 of 590 in NY (top 83%) — families likely to look elsewhere, expect single-tenant / working-renter base with shorter leases.
- Market conditions: 127 active listings in the ZIP; 3 comparable units currently listed for rent nearby; rentals lingering (median 44d on market — plan ~5-8 weeks vacancy on turnover, expect pricing pressure); 67% of comp listings sitting > 30 days — soft ceiling on asking rent; solid renter incomes; 1,169 units permitted in Monroe County in 2024 (591 in 5+ unit buildings).
- This rent runs 31% of the median local income ($88k/yr) — at the standard rent-burdened threshold; future hikes will face affordability resistance.
Forward outlook
- Local home prices are declining (-3.0%/yr); year-one equity from $1k of loan paydown is wiped out by about $5k of value loss. Plan a longer hold.
- Monroe County population projected to shrink 6% by 2050 — rents likely to lag national; underwrite the cash flow, not the appreciation.
Negotiation context
- Only 7 days on market — expect competitive offers; lowballing is unlikely to land.
Risks & watch-outs
- Watch-outs: property tax is 3.1% of price.
Questions for the listing agent
- Built in 1970 — when were the roof, HVAC, electrical panel, plumbing, and water heater last replaced?
- Property tax is high relative to price — has the assessment been appealed recently, and will the sale trigger a re-assessment?
- Is there a deadline driving the sale (1031 exchange, divorce, estate, relocation)? That informs how much negotiation room exists.
- Schools are B-rated — typically a magnet for longer-tenancy family renters. What's the average tenant stay here, and is there a school-zone premium baked into asking?
- What's the average days-on-market for RENTAL listings here right now (not sales)? A rising rental-DOM trend means longer vacancies and softer asking-rent achievability than the comps imply.
- What's the recent tenant-quality profile in this submarket — average credit score on applications, eviction rate, late-payment / NSF rate, and stable-employment percentage? A property-management company in the area should have these aggregated.
- How much new for-sale + rental construction is in the pipeline within 1–3 miles? Heavy new supply typically softens prices + rents 12–24 months out; constrained supply supports both.
Investment metrics
- 1% rule
- 1.27% ✓
- Cap rate
- 8.42%
- Cash-on-cash
- 7.61%
- DSCR
- 1.34
- GRM
- 6.5
CMA / ARV
- ARV (median comp)
- $283,809
- List price
- $179,900
- Delta
- -36.61%
- Verdict
- UNDERPRICED
- Comps
- 20 within 1.0 mi
Show comp detail 12 sales within ~0.75 mi
| Address | Dist | Beds/Ba | Sqft | Sold | Price | $/sf | Match |
|---|---|---|---|---|---|---|---|
| 6 Wyncrest Dr | 0.35mi | 3/1.5 | 1,578 (+1%) | 6mo | $230,000 | $146 | 78 |
| 11 Ventura Rd | 0.19mi | 3/2.0 | 1,466 (-6%) | 2mo | $325,000 | $222 | 76 |
| 530 Westside Dr | 0.02mi | 4/1.5 (+1) | 1,744 (+11%) | 4mo | $275,000 | $158 | 72 |
| 116 Rowley Dr | 0.26mi | 3/1.5 | 1,452 (-7%) | 5mo | $199,900 | $138 | 71 |
| 3 Kings Way | 0.74mi | 3/2.0 | 1,579 (+1%) | 0mo | $331,500 | $210 | 62 |
| 82 Mariposa Dr | 0.34mi | 4/1.5 (+1) | 1,728 (+10%) | 2mo | $350,000 | $203 | 61 |
| 195 Rowley Dr | 0.25mi | 4/2.0 (+1) | 1,412 (-10%) | 5mo | $245,000 | $174 | 60 |
| 36 Fenton Rd | 0.50mi | 3/1.0 | 1,679 (+7%) | 4mo | $215,000 | $128 | 59 |
| 211 Westmar Dr | 0.32mi | 3/1.0 | 1,368 (-13%) | 5mo | $235,000 | $172 | 58 |
| 58 Hay Market Rd | 0.68mi | 4/1.5 (+1) | 1,512 (-4%) | 5mo | $253,000 | $167 | 53 |
| 70 Fenton Rd | 0.62mi | 3/1.0 | 1,341 (-14%) | 2mo | $170,000 | $127 | 44 |
| 751 Marshall Rd | 0.63mi | 3/2.5 | 1,391 (-11%) | 5mo | $349,900 | $252 | 43 |
Match score weights: distance 35% · size 25% · config 20% · recency 20%. Top-matched comps best support the ARV.
Projected returns pro-forma
-3.0% appreciation · 3.0% rent growth · sell at horizon
- IRR
- -4.6%
- Equity multiple
- 0.83×
- Total profit
- $-8,623
- Equity at exit
- $26,824
- IRR
- 5.2%
- Equity multiple
- 1.39×
- Total profit
- $19,442
- Equity at exit
- $15,554
Cash invested: $50,372 (down + closing). Projections, not guarantees.
Landlord ↔ Tenant lean methodology
- Overall (STATE)
- 15 Strongly Tenant-Friendly
- State New York
- 15 Strongly Tenant-Friendly · D+10
- County
- — inherits STATE
- City
- — inherits STATE
ZIP-level market 14624
- Active inventory
- 127
- Price-to-rent
- 6.5×
Monthly cashflow live
- Estimated rent
- $2,291 medium interval (Pro) →
- Mortgage (P&I)
- −$943
- Tax from tax record
- −$472 /mo · $5,662/yr
- Insurance
- −$75
- HOA
- −$0
- Vacancy / Maint / Mgmt
- −$481
- Net cashflow
- $319
Break-even live
UW: 25.0% down · 7.5% · 30yr · 1.5% tax · 5.0% vac · 8.0% maint · 8.0% mgmt
Financing live
Cash to close
- Down payment
- $44,975
- Closing costs
- $5,397
- Reserves months
- —
- Total cash needed
- —
Loan-product check · same deal, 3 products live
Conventional
25% down · 7.5% · 30yr
- Down + closing
- —
- Monthly P&I
- —
- Monthly cashflow
- —
- DSCR
- —
- Eligible?
- —
Personal DTI + credit; lowest rate.
DSCR
20% down · 8.5% · 30yr
- Down + closing
- —
- Monthly P&I
- —
- Monthly cashflow
- —
- DSCR
- —
- Eligible?
- —
No personal income docs; deal must DSCR.
Hard money
10% down · 12.0% · 12mo
- Down + closing
- —
- Monthly P&I
- —
- Monthly cashflow
- —
- DSCR
- —
- Eligible?
- —
Short-term bridge; refi at stabilization.
Rent comps 3 comps
| Address | Beds | Baths | Sqft | Rent | $/sqft | DOM | Units | Dist |
|---|---|---|---|---|---|---|---|---|
| 25 Red Bud Rd Rochester, NY | 4.0 | 1.5 | 1568 | $2,600 | $1.66 | 19d | 1 | 1.08mi |
| 254 Fisher Rd Rochester, NY | 2.0 | 1.0 | 1100 | $2,250 | $2.05 | 43d | 1 | 1.43mi |
| 266 Fisher Rd Rochester, NY | 2.0 | 2.0 | 1100 | $1,800 | $1.64 | 43d | 1 | 1.47mi |
Listing history 2 events
-
2026-05-19status Pending 1198-char remark
-
2026-05-11$179,900 Active 1198-char remark
ⓘ Source: listings_history table (triggers on properties + properties_extension) + one-shot
backfill from property_details.listing_events for pre-trigger history.
Tax reassessment forecast NY · Partial reset (capped growth)
- Current annual tax
- $5,662 · $472/mo
- Projected year-2 tax
- $5,662 · $472/mo
- Expected delta
- $0/yr ($0/mo · 0.0%)
ⓘ Screening estimate from a state-policy table — verify with the county assessor before closing.
Climate risk First Street
- Flood 1/10 Low FEMA zone X (unshaded) · 0% chance over 30 yrs
- Wildfire 1/10 Low
- Heat 2/10 Low 7 d/yr ≥95°F today · 15 d/yr by 30 yrs out
- Wind 1/10 Low
- Air quality 2/10 Low 1 unhealthy d/yr today · 1 by 30 yrs out
Nearby sold comps map
Loading sold comps map…
Walkable amenities ~0.75 mi
Loading nearby amenities…
Taxation est. · year 1
- Rental income
- $27,488
- − Mortgage interest
- −$10,077
- − Property taxes
- −$5,662
- − Insurance
- −$900
- − Repairs & maintenance
- −$2,199
- − Management
- −$2,199
- − Depreciation
- −$5,233
- Taxable income
- $1,217
- Est. tax owed @ 24.0%
- −$292
- After-tax cash flow
- $3,541/yr
For passive investors: Depreciation is non-cash, so a rental often shows a tax loss while cash-flowing — sheltering income. Rental losses are passive: they offset passive income freely, and up to $25,000/yr can offset ordinary (W-2) income if you actively participate and your MAGI is under $100k (phasing out to $0 by $150k); unused losses carry forward. On sale, claimed depreciation is recaptured at up to 25%, and gains may owe capital-gains tax (a 1031 exchange can defer both). Figures are a year-1 estimate at your 24.0% rate — not tax advice; consult a CPA.
Schools (NCES district)
- District
- Gates-Chili Central School District
- NCES district ID
- 3611880
- Math proficiency
- 41% ▼ -12.00%
- Reading proficiency
- 42% ▼ -6.00%
- Median HH income
- $55,045
- Composite
- 36.23/100
- National rank
- #4719
- State rank
- #491 of 590 in NY
Livability — Gates
- Score
- 67/100
- State rank
- #582
- US rank
- #10531
Category grades
Schools grade is shown separately in the Schools card above.
Census & demographics
- County
- Monroe County · 674,131 people
- Metro
- Rochester, NY
- Population (ZIP)
- 38,626
- Household income
- $87,989
- Rent vs Own
- Severe rent burden
- 584.0
Population outlook (Monroe County) Hauer SSP2
- Today (2025)
- 759,460 people
- By 2030
- 757,154 · -0.3%
- By 2040
- 740,644 · -2.5%
- By 2050
- 714,443 · -5.9%
- By 2075
- 645,883 · -15.0%
- By 2100
- 547,084 · -28.0%
Race, ethnicity, and origin ACS 2023
- Neighborhood character
- Predominantly White (78%)
- Race & ethnicity
- White 78% Black 9% Hispanic / Latino 6% Two or more races 5% Asian 3%
- Hispanic origin (detail)
- Puerto Rican 4%
- Common ancestry
- Romanian 6% Iranian 2% Lithuanian 2%
- Foreign-born
- 7% · Canada, China, India
- Languages at home
- 90% English-only · Spanish 3% Other Indo-European 3% Russian/Polish/Slavic 1%
Political lean MEDSL · Monroe
- 2024 margin
- D (+19.1) · D 59.5% · R 40.5%
- 2008→2024 swing
- +1.4pp toward D · 2008: 17.7pp · 2024: 19.1pp
- All cycles
- 2024: D+19.1 2020: D+21.0 2016: D+14.1 2012: D+17.4 2008: D+17.7
Not yet ingested
- Civics
- —
Market trends
- HPI YoY
- ▼ -151.26%
- Current HPI
- 267.356
- Rent YoY
- —
- Metro
- Rochester, NY
- State GDP YoY
- ▲ 2.60%
- F500 in state
- 92
Industry mix (Fortune 500 HQ in NY)
| Industry | F500 HQs | Revenue |
|---|---|---|
| Financial Services | 10 | $950B |
|
||
| Consumer Goods | 9 | $162B |
|
||
| Insurance | 4 | $225B |
|
||
| Telecommunications | 2 | $144B |
|
||
| Pharmaceuticals | 2 | $112B |
|
||
| Media / Entertainment | 2 | $69B |
|
||
Price history
2 events — show timeline
- 2026-05-19 Pending — UNYREIS
- 2026-05-11 Listed $179,900 UNYREIS
Property tax history
+14.1%/yrLatest (2025): $5,662 · +85.6% YoY. Source: county tax records.
Cash-flow waterfall
monthlySold comps — $/sqft
last 12 mo · ≤1 miLoading sold comps…