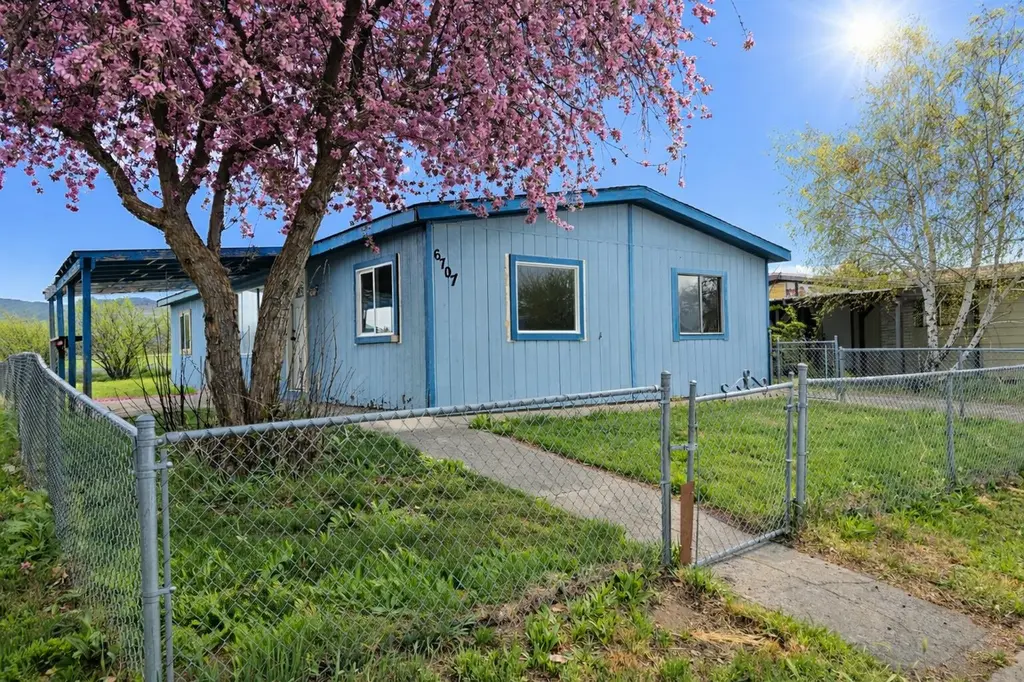
6707 Waggoner Ct · Altamont, OR
Flood risk 1/10 · Minimal
- FEMA flood zone
- X
- Chance of flooding over 30 yrs
- 0.0%
- Est. flood insurance / yr
- $507 – $1,088
Fire risk 5/10 · Moderate
- Est. fire insurance / yr
- $498 – $926
Heat risk 3/10 · Minor
- Hot days now (above 90°F)
- 7 days/yr
- Hot days in 30 yrs
- 17 days/yr
Wind risk 1/10 · Minimal
- Chance of severe wind over 30 yrs
- —
Air-quality risk 10/10 · Severe
- Unhealthy air days now
- 38 days/yr
- Unhealthy air days in 30 yrs
- 39 days/yr
Risk factors via First Street. Map © Google.
Why this score? — see what drove the B grade
The composite is a weighted blend of 9 inputs, each scored 0–100. Each bar is that input's sub-score; the figure is the points it added to the 100-point composite (weight × sub-score).
- Cash flow +27.7/30.0
- ARV discount +15.0/15.0
- DSCR +9.8/10.0
- 1% rule +7.5/10.0
- Rent growth +3.5/5.0
- Livability +3.2/5.0
- Schools +2.5/10.0
- Condition / age +2.5/5.0
- Appreciation +0.0/10.0
$129,000
🖨 Deal sheet 📄 Offer letter ✓ Due diligence
Listing remarks MLS
Diamond in the rough with a head start on ''customization!'' This charming fixer-upper is perfect for buyers who've been binge-watching renovation shows and are ready to star in one. With a layout that practically invites creativity, you'll have the freedom to design exactly what you want--because, well, you'll be redesigning most of it anyway. The home features plenty of opportunities to build sweat equity (emphasis on sweat). Ideal for investors or ambitious homeowners, this property is being offered cash only and is ready for a full remodel to bring it into its next chapter. If you've ever said, ''I wish I could pick everything myself, '' this is your moment. Just bring your vision, your toolbox, and maybe a strong cup of coffee--you've got this!
Key facts
- 5,227 sq ft lot
- Parking
- Built 1981
Neighborhood map
What this means for you Summary
Snapshot
- This is a 3-bed/2.0-bath manufactured listed at $129k.
Deal economics
- At list price, monthly cash flow is $389 ($5k/yr) — positive.
- The deal already cash-flows at list — no discount required.
- Meets the 1% rule at list price ($2k rent vs $129k).
- Recommended offer: $121k (6.0% below list) — sets the bar for market timing.
- Cap rate 9.9% vs local median 3.7% in Altamont — top-decile yield for the area; either an underpriced asset or a hidden risk that comps aren't pricing in. Stress-test before assuming the spread holds.
Location & tenants
- Location reads 65/100 on livability (#195 in OR) — a middle-class / working-renter tenant base. Strengths: cost of living A+, housing A+; Watch: health & safety C-, employment D, crime F.
- Klamath County SD (rural): math 21% / reading 37% proficiency, ranked #46 of 58 in OR (top 79%) — low school quality limits family demand, transient renter base, plan for 1-2y turnover.
- Market conditions: Rents rising (+3.8%/yr); 263 active listings in the ZIP; 2 comparable units currently listed for rent nearby; 232 units permitted in Klamath County in 2024 (72 in 5+ unit buildings).
Forward outlook
- Local home prices are declining (-3.0%/yr); year-one equity from $892 of loan paydown is wiped out by about $4k of value loss. Plan a longer hold.
- Klamath County population projected at -12% by 2050 — secular population decline; favor cash flow + early exit over multi-decade hold.
- At projected returns (-3.0% appreciation + 3.8% rent growth), your $36k cash investment doubles in ~9 years — after that, you're playing with house money.
Negotiation context
- It's been on market 69 days — a 6% lower offer ($121k) is reasonable based on typical stale-listing flexibility.
- Current owner paid $50k; list at $129k implies a 158% gain — meaningful room to come down on a strong offer.
Risks & watch-outs
- Climate carrying-cost: moderate wildfire risk — expect insurance premiums to compound above CPI over the hold.
Questions for the listing agent
- It's been on market 69 days. Have you received any prior offers? Is the seller open to a 6% concession, seller financing, or rate buy-down credit?
- Why hasn't it sold? Are there any deal-killer items the seller is aware of (foundation, flood, title, zoning, code violations)?
- Is there a deadline driving the sale (1031 exchange, divorce, estate, relocation)? That informs how much negotiation room exists.
- Crime grade is F in this area — have there been break-ins, vandalism, or insurance claims at this property in the last 3 years? What carrier currently insures it and at what premium?
- What's the average days-on-market for RENTAL listings here right now (not sales)? A rising rental-DOM trend means longer vacancies and softer asking-rent achievability than the comps imply.
- What's the recent tenant-quality profile in this submarket — average credit score on applications, eviction rate, late-payment / NSF rate, and stable-employment percentage? A property-management company in the area should have these aggregated.
- How much new for-sale + rental construction is in the pipeline within 1–3 miles? Heavy new supply typically softens prices + rents 12–24 months out; constrained supply supports both.
Investment metrics
- 1% rule
- 1.25% ✓
- Cap rate
- 9.91%
- Cash-on-cash
- 12.93%
- DSCR
- 1.58
- GRM
- 6.7
CMA / ARV
- ARV (median comp)
- $190,175
- List price
- $129,000
- Delta
- -32.17%
- Verdict
- UNDERPRICED
- Comps
- 7 within 1.0 mi
Show comp detail 8 sales within ~0.75 mi
| Address | Dist | Beds/Ba | Sqft | Sold | Price | $/sf | Match |
|---|---|---|---|---|---|---|---|
| 4762 Sayler St | 0.16mi | 3/2.0 | 1,144 (-1%) | 7mo | $250,000 | $219 | 86 |
| 4746 Sayler St | 0.12mi | 3/2.0 | 1,248 (+8%) | 2mo | $280,000 | $224 | 79 |
| 7107 Turner Ct | 0.22mi | 3/2.0 | 1,100 (-4%) | 8mo | $237,500 | $216 | 75 |
| 4751 Bellm Dr #29 | 0.21mi | 2/2.0 (-1) | 1,080 (-6%) | 3mo | $70,000 | $65 | 73 |
| 7204 Boyd Ct | 0.28mi | 2/2.0 (-1) | 1,152 (0%) | 23mo | $155,000 | $135 | 63 |
| 7119 Turner Ct | 0.25mi | 3/2.0 | 1,248 (+8%) | 16mo | $225,000 | $180 | 62 |
| 7010 Keller Ct | 0.20mi | 2/2.0 (-1) | 1,008 (-12%) | 20mo | $130,000 | $129 | 49 |
| 5461 Winterfield Way | 0.72mi | 3/2.0 | 1,296 (+12%) | 21mo | $250,000 | $193 | 28 |
Match score weights: distance 35% · size 25% · config 20% · recency 20%. Top-matched comps best support the ARV.
Projected returns pro-forma
-3.0% appreciation · 3.8% rent growth · sell at horizon
- IRR
- 3.7%
- Equity multiple
- 1.14×
- Total profit
- $5,217
- Equity at exit
- $19,234
- IRR
- 14.0%
- Equity multiple
- 2.16×
- Total profit
- $42,006
- Equity at exit
- $11,154
Cash invested: $36,120 (down + closing). Projections, not guarantees.
Landlord ↔ Tenant lean methodology
- Overall (STATE)
- 28 Tenant-Leaning
- State Oregon
- 28 Tenant-Leaning · D+6
- County
- — inherits STATE
- City
- — inherits STATE
ZIP-level market 97603
- Rents YoY
- 3.8%
- Active inventory
- 263
- Price-to-rent
- 6.7×
Monthly cashflow live
- Estimated rent
- $1,613 medium interval (Pro) →
- Mortgage (P&I)
- −$676
- Tax from tax record
- −$155 /mo · $1,855/yr
- Insurance
- −$54
- HOA
- −$0
- Vacancy / Maint / Mgmt
- −$339
- Net cashflow
- $389
Break-even live
UW: 25.0% down · 7.5% · 30yr · 1.5% tax · 5.0% vac · 8.0% maint · 8.0% mgmt
Financing live
Cash to close
- Down payment
- $32,250
- Closing costs
- $3,870
- Reserves months
- —
- Total cash needed
- —
Loan-product check · same deal, 3 products live
Conventional
25% down · 7.5% · 30yr
- Down + closing
- —
- Monthly P&I
- —
- Monthly cashflow
- —
- DSCR
- —
- Eligible?
- —
Personal DTI + credit; lowest rate.
DSCR
20% down · 8.5% · 30yr
- Down + closing
- —
- Monthly P&I
- —
- Monthly cashflow
- —
- DSCR
- —
- Eligible?
- —
No personal income docs; deal must DSCR.
Hard money
10% down · 12.0% · 12mo
- Down + closing
- —
- Monthly P&I
- —
- Monthly cashflow
- —
- DSCR
- —
- Eligible?
- —
Short-term bridge; refi at stabilization.
Rent comps 2 comps
| Address | Beds | Baths | Sqft | Rent | $/sqft | DOM | Units | Dist |
|---|---|---|---|---|---|---|---|---|
| 3039 Kane St Klamath Falls, OR | 3.0 | 2.0 | 988 | $1,395 | $1.41 | 43d | 1 | 1.34mi |
| 4195 Bristol Ct Klamath Falls, OR | 2.0 | 1.0 | 1080 | $1,350 | $1.25 | 43d | 1 | 1.34mi |
Listing history 18 events
-
2026-06-19days on market $129,000 Active 69 DOM
-
2026-06-18days on market $129,000 Active 68 DOM
-
2026-06-17days on market $129,000 Active 67 DOM
-
2026-06-16days on market $129,000 Active 66 DOM
-
2026-06-15days on market $129,000 Active 65 DOM
-
2026-06-14days on market $129,000 Active 63 DOM
-
2026-06-12days on market $129,000 Active 62 DOM
-
2026-06-09days on market $129,000 Active 59 DOM
-
2026-06-08days on market $129,000 Active 58 DOM
-
2026-06-07days on market $129,000 Active 57 DOM
-
2026-06-05days on market $129,000 Active 54 DOM
-
2026-06-02days on market $129,000 Active 52 DOM
-
2026-06-01days on market $129,000 Active 51 DOM
-
2026-05-31days on market $129,000 Active 50 DOM
-
2026-05-30days on market $129,000 Active 49 DOM
-
2026-04-12price $129,000 759-char remark
Show marketing remark (759 chars)
Diamond in the rough with a head start on ''customization!'' This charming fixer-upper is perfect for buyers who've been binge-watching renovation shows and are ready to star in one. With a layout that practically invites creativity, you'll have the freedom to design exactly what you want--because, well, you'll be redesigning most of it anyway. The home features plenty of opportunities to build sweat equity (emphasis on sweat). Ideal for investors or ambitious homeowners, this property is being offered cash only and is ready for a full remodel to bring it into its next chapter. If you've ever said, ''I wish I could pick everything myself, '' this is your moment. Just bring your vision, your toolbox, and maybe a strong cup of coffee--you've got this!
-
2026-04-11$120,000 Active 759-char remark
Show marketing remark (759 chars)
Diamond in the rough with a head start on ''customization!'' This charming fixer-upper is perfect for buyers who've been binge-watching renovation shows and are ready to star in one. With a layout that practically invites creativity, you'll have the freedom to design exactly what you want--because, well, you'll be redesigning most of it anyway. The home features plenty of opportunities to build sweat equity (emphasis on sweat). Ideal for investors or ambitious homeowners, this property is being offered cash only and is ready for a full remodel to bring it into its next chapter. If you've ever said, ''I wish I could pick everything myself, '' this is your moment. Just bring your vision, your toolbox, and maybe a strong cup of coffee--you've got this!
-
2000-12-14soldstatus $50,000
ⓘ Source: listings_history table (triggers on properties + properties_extension) + one-shot
backfill from property_details.listing_events for pre-trigger history.
Tax reassessment forecast OR · Resets to sale price
- Current annual tax
- $1,855 · $155/mo
- Projected year-2 tax
- $1,855 · $155/mo
- Expected delta
- $0/yr ($0/mo · 0.0%)
ⓘ Screening estimate from a state-policy table — verify with the county assessor before closing.
Climate risk First Street
- Flood 1/10 Low FEMA zone X · 0% chance over 30 yrs
- Wildfire 5/10 Major
- Heat 3/10 Moderate 7 d/yr ≥90°F today · 17 d/yr by 30 yrs out
- Wind 1/10 Low
- Air quality 10/10 Extreme 38 unhealthy d/yr today · 39 by 30 yrs out
Nearby sold comps map
Loading sold comps map…
Walkable amenities ~0.75 mi
Loading nearby amenities…
Taxation est. · year 1
- Rental income
- $19,353
- − Mortgage interest
- −$7,226
- − Property taxes
- −$1,855
- − Insurance
- −$645
- − Repairs & maintenance
- −$1,548
- − Management
- −$1,548
- − Depreciation
- −$3,753
- Taxable income
- $2,778
- Est. tax owed @ 24.0%
- −$667
- After-tax cash flow
- $4,004/yr
For passive investors: Depreciation is non-cash, so a rental often shows a tax loss while cash-flowing — sheltering income. Rental losses are passive: they offset passive income freely, and up to $25,000/yr can offset ordinary (W-2) income if you actively participate and your MAGI is under $100k (phasing out to $0 by $150k); unused losses carry forward. On sale, claimed depreciation is recaptured at up to 25%, and gains may owe capital-gains tax (a 1031 exchange can defer both). Figures are a year-1 estimate at your 24.0% rate — not tax advice; consult a CPA.
Schools (NCES district)
- District
- Klamath County SD
- NCES district ID
- 4107020
- Math proficiency
- 21% ▼ -17.00%
- Reading proficiency
- 37% ▼ -16.00%
- Median HH income
- $44,906
- Composite
- 24.83/100
- National rank
- #7593
- State rank
- #46 of 58 in OR
Livability — Altamont
- Score
- 65/100
- State rank
- #195
- US rank
- #12638
Category grades
Schools grade is shown separately in the Schools card above.
Census & demographics
- Census place
- Altamont, OR
- County
- Klamath County · 56,186 people
- Metro
- Klamath Falls, OR
- Population (ZIP)
- 33,222
- Household income
- $66,937
- Rent vs Own
- Severe rent burden
- 1147.0
Population outlook (Klamath County) Hauer SSP2
- Today (2025)
- 63,870 people
- By 2030
- 62,279 · -2.5%
- By 2040
- 58,891 · -7.8%
- By 2050
- 56,207 · -12.0%
- By 2075
- 51,239 · -19.8%
- By 2100
- 46,526 · -27.2%
Race, ethnicity, and origin ACS 2023
- Neighborhood character
- Predominantly White (73%)
- Race & ethnicity
- White 73% Hispanic / Latino 15% Two or more races 13% Native American 2%
- Hispanic origin (detail)
- Mexican 13%
- Common ancestry
- Portuguese 5% Italian 4% Lithuanian 3%
- Foreign-born
- 4% · Canada, China
- Languages at home
- 91% English-only · Spanish 7%
Political lean MEDSL · Klamath
- 2024 margin
- Solid R (+41.9) · D 27.9% · R 69.8% · Other 2.4%
- 2008→2024 swing
- -8.8pp toward R · 2008: -33.1pp · 2024: -41.9pp
- All cycles
- 2024: R+41.9 2020: R+40.6 2016: R+44.8 2012: R+38.2 2008: R+33.1
Not yet ingested
- Civics
- —
Market trends
- HPI YoY
- ▼ -122.75%
- Current HPI
- 198.1814
- Rent YoY
- ▲ 3.80%
- Metro
- Klamath Falls, OR
- State GDP YoY
- ▲ 2.05%
- F500 in state
- 2
Industry mix (Fortune 500 HQ in OR)
| Industry | F500 HQs | Revenue |
|---|---|---|
| Consumer Goods | 1 | $51B |
|
||
Price history
+158.0% since first listed3 events — show timeline
- 2026-04-12 Price Changed $129,000 MLSCO
- 2026-04-11 Listed $120,000 MLSCO
- 2000-12-14 Sold (Public Records) $50,000 Public Records
Property tax history
+5.8%/yrLatest (2025): $1,855 · +12.5% YoY. Source: county tax records.
Cash-flow waterfall
monthlySold comps — $/sqft
last 12 mo · ≤1 miLoading sold comps…