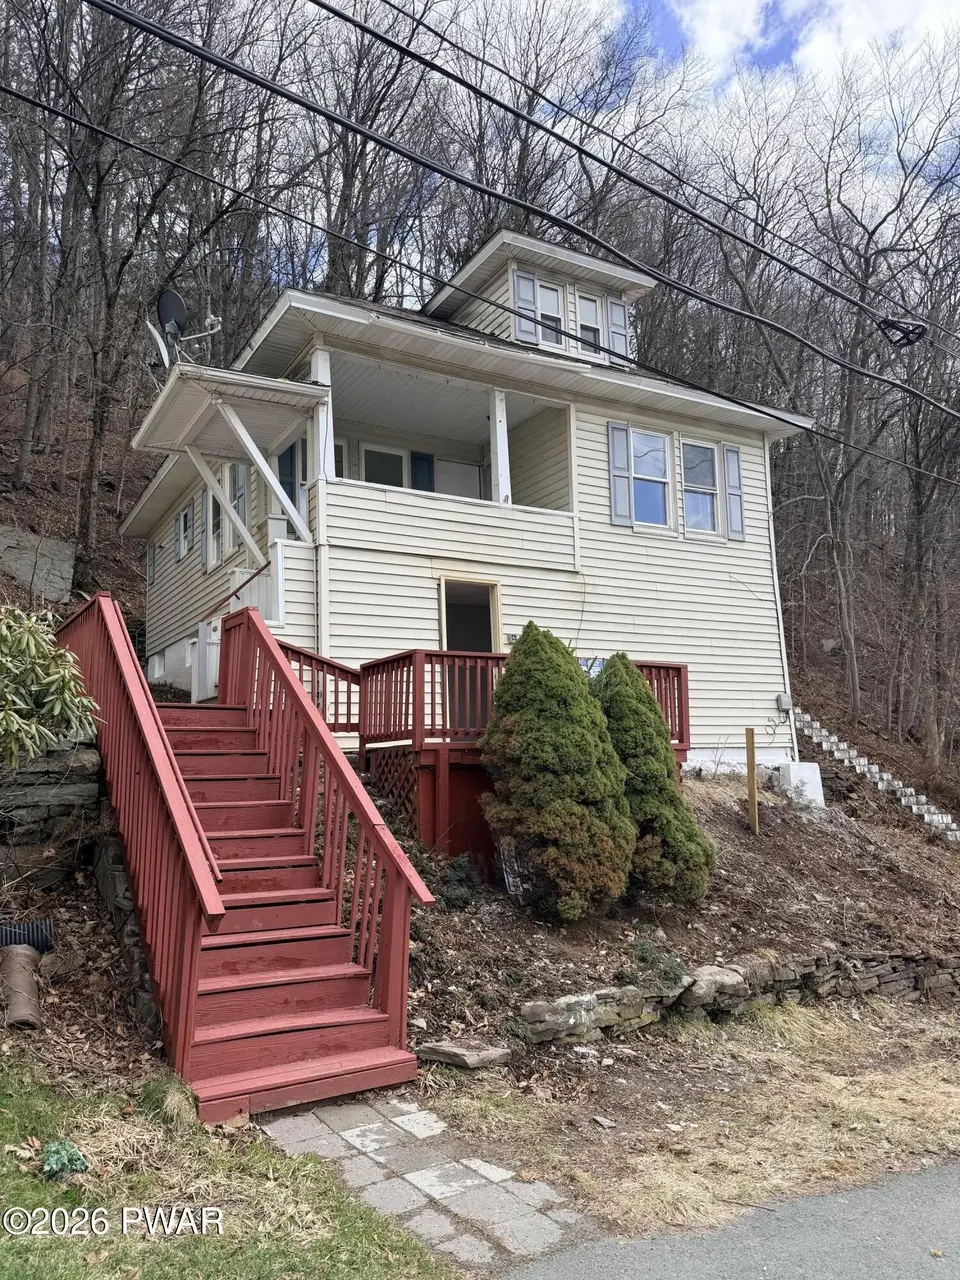
139 Cliff St · Honesdale, PA
Flood risk 6/10 · Moderate
- FEMA flood zone
- X (unshaded)
- Chance of flooding over 30 yrs
- 0.27%
- Est. flood insurance / yr
- $473 – $860
Fire risk 1/10 · Minimal
- Est. fire insurance / yr
- $511 – $949
Heat risk 3/10 · Minor
- Hot days now (above 92°F)
- 7 days/yr
- Hot days in 30 yrs
- 17 days/yr
Wind risk 2/10 · Minimal
- Chance of severe wind over 30 yrs
- 2.0%
Air-quality risk 2/10 · Minimal
- Unhealthy air days now
- 1 days/yr
- Unhealthy air days in 30 yrs
- 2 days/yr
Risk factors via First Street. Map © Google.
Why this score? — see what drove the B+ grade
The composite is a weighted blend of 9 inputs, each scored 0–100. Each bar is that input's sub-score; the figure is the points it added to the 100-point composite (weight × sub-score).
- Cash flow +25.7/30.0
- ARV discount +15.0/15.0
- Appreciation +10.0/10.0
- DSCR +8.6/10.0
- 1% rule +7.0/10.0
- Schools +4.7/10.0
- Livability +3.2/5.0
- Rent growth +2.5/5.0
- Condition / age +2.5/5.0
$150,000
🖨 Deal sheet 📄 Offer letter ✓ Due diligence
Listing remarks
PRICE IMPROVED | FULLY RENOVATED HONESDALE HOME | WALK TO MAIN STREET | TURNKEY LIVING WITH BONUS SPACEWelcome to 139 Cliff Street in the heart of Honesdale, Pennsylvania--where modern updates, small-town charm, and unbeatable convenience come together in one move-in ready property. With a newly improved price, this is the opportunity buyers have been waiting for: a fully renovated home in one of Northeastern Pennsylvania's most desirable communities. From the moment you step inside, the home feels fresh, inviting, and thoughtfully updated. Bright living spaces, updated flooring, refreshed bathrooms, and a beautifully redesigned kitchen create a clean, modern feel while still preserving the
Key facts
- Off street parking
- Natural light
- Spacious rooms
Tags
Property features AI
Exterior
- Parking: Off-street parking
- Utilities: Public water; Public sewer; 100 Amp electric service
- Home design: Single-family residential property; Residential zoning
- Construction: Shingle siding; Vinyl siding; Other foundation
- Exterior features: Shingle roof; Publicly maintained road access; Lot around 0.39 acres
Interior
- Kitchen: Electric cooktop
- Bedrooms: Total rooms: 9
- Flooring: Vinyl; Other
- Bathrooms: 2 full bathrooms
- Heating & cooling: Forced air heating; Central air conditioning
- Interior features: Double-pane windows; Unfurnished; Full basement
- Laundry & utility: Washer; Dryer (laundry located on lower level)
Neighborhood map
What this means for you Summary
Snapshot
- This is a 2-bed/1.0-bath single-family listed at $150k.
Deal economics
- At list price, monthly cash flow is $361 ($4k/yr) — positive.
- The deal already cash-flows at list — no discount required.
- Meets the 1% rule at list price ($2k rent vs $150k).
Location & tenants
- Location reads 64/100 on livability (#1,220 in PA) — a middle-class / working-renter tenant base. Strengths: cost of living A+, housing A, crime A-; Watch: amenities F, commute F, employment F.
- Wayne Highlands SD (town): math 48% / reading 64% proficiency, ranked #115 of 539 in PA (top 21%) — acceptable for families but not a draw, mixed tenant base, ~2y average lease.
- Market conditions: 66 active listings in the ZIP; 1 comparable units currently listed for rent nearby; 177 units permitted in Wayne County in 2024 (0 in 5+ unit buildings).
Forward outlook
- In year one you build about $16k of equity ($1k loan paydown + $15k appreciation (10.0% local appreciation)).
- Wayne County population projected at -17% by 2050 — secular population decline; favor cash flow + early exit over multi-decade hold.
- At projected returns (10.0% appreciation + 3.0% rent growth), your $42k cash investment doubles in ~2 years — after that, you're playing with house money.
- By year 3, paydown + projected appreciation supports a ~$41k cash-out refi (75% LTV) — recoverable capital for the next deal without selling this one.
Negotiation context
- Only 2 days on market — expect competitive offers; lowballing is unlikely to land.
- 4 sale attempts with the ask held roughly flat each time — persistent listings suggest the price (not the market) is what's stuck; bring a comps-based counter.
Risks & watch-outs
- Watch-outs: built in 1920 — expect roof / HVAC / electrical / plumbing capex.
- Climate carrying-cost: major flood risk — expect insurance premiums to compound above CPI over the hold.
Questions for the listing agent
- Built in 1920 — when were the roof, HVAC, electrical panel, plumbing, and water heater last replaced?
- Is there a deadline driving the sale (1031 exchange, divorce, estate, relocation)? That informs how much negotiation room exists.
- Schools are B-rated — typically a magnet for longer-tenancy family renters. What's the average tenant stay here, and is there a school-zone premium baked into asking?
- What's the average days-on-market for RENTAL listings here right now (not sales)? A rising rental-DOM trend means longer vacancies and softer asking-rent achievability than the comps imply.
- What's the recent tenant-quality profile in this submarket — average credit score on applications, eviction rate, late-payment / NSF rate, and stable-employment percentage? A property-management company in the area should have these aggregated.
- How much new for-sale + rental construction is in the pipeline within 1–3 miles? Heavy new supply typically softens prices + rents 12–24 months out; constrained supply supports both.
Investment metrics
- 1% rule
- 1.20% ✓
- Cap rate
- 9.18%
- Cash-on-cash
- 10.30%
- DSCR
- 1.46
- GRM
- 6.9
CMA / ARV
- ARV (median comp)
- $181,006
- List price
- $150,000
- Delta
- -6.14%
- Verdict
- FAIR
- Comps
- 20 within 1.0 mi
Show comp detail 6 sales within ~0.75 mi
| Address | Dist | Beds/Ba | Sqft | Sold | Price | $/sf | Match |
|---|---|---|---|---|---|---|---|
| 276 Erie St | 0.30mi | 2/1.0 | 750 (-8%) | 1mo | $111,500 | $149 | 72 |
| 220 Terrace St | 0.31mi | 2/1.5 | 883 (+8%) | 1mo | $190,000 | $215 | 69 |
| 215 Vine St | 0.34mi | 3/1.0 (+1) | 920 (+13%) | 1mo | $60,000 | $65 | 57 |
| 216 Russell St | 0.43mi | 2/1.0 | 872 (+7%) | 14mo | $212,500 | $244 | 57 |
| 115 9th St | 0.38mi | 1/1.5 (-1) | 722 (-12%) | 10mo | $144,000 | $199 | 48 |
| 455 Riverside Dr | 0.50mi | 3/1.0 (+1) | 792 (-3%) | 23mo | $50,000 | $63 | 47 |
Match score weights: distance 35% · size 25% · config 20% · recency 20%. Top-matched comps best support the ARV.
Projected returns pro-forma
10.0% appreciation · 3.0% rent growth · sell at horizon
- IRR
- 31.8%
- Equity multiple
- 3.49×
- Total profit
- $104,700
- Equity at exit
- $135,132
- IRR
- 27.5%
- Equity multiple
- 7.91×
- Total profit
- $290,350
- Equity at exit
- $291,417
Cash invested: $42,000 (down + closing). Projections, not guarantees.
Landlord ↔ Tenant lean methodology
- Overall (STATE)
- 62 Landlord-Friendly
- State Pennsylvania
- 62 Landlord-Friendly · EVEN
- County
- — inherits STATE
- City
- — inherits STATE
ZIP-level market 18431
- Home prices YoY
- 10.6%
- Active inventory
- 66
- Price-to-rent
- 6.9×
Monthly cashflow live
- Estimated rent
- $1,800 medium interval (Pro) →
- Mortgage (P&I)
- −$787
- Tax from tax record
- −$212 /mo · $2,548/yr
- Insurance
- −$62
- HOA
- −$0
- Vacancy / Maint / Mgmt
- −$378
- Net cashflow
- $361
Break-even live
UW: 25.0% down · 7.5% · 30yr · 1.5% tax · 5.0% vac · 8.0% maint · 8.0% mgmt
Financing live
Cash to close
- Down payment
- $37,500
- Closing costs
- $4,500
- Reserves months
- —
- Total cash needed
- —
Loan-product check · same deal, 3 products live
Conventional
25% down · 7.5% · 30yr
- Down + closing
- —
- Monthly P&I
- —
- Monthly cashflow
- —
- DSCR
- —
- Eligible?
- —
Personal DTI + credit; lowest rate.
DSCR
20% down · 8.5% · 30yr
- Down + closing
- —
- Monthly P&I
- —
- Monthly cashflow
- —
- DSCR
- —
- Eligible?
- —
No personal income docs; deal must DSCR.
Hard money
10% down · 12.0% · 12mo
- Down + closing
- —
- Monthly P&I
- —
- Monthly cashflow
- —
- DSCR
- —
- Eligible?
- —
Short-term bridge; refi at stabilization.
Rent comps 1 comps
| Address | Beds | Baths | Sqft | Rent | $/sqft | DOM | Units | Dist |
|---|---|---|---|---|---|---|---|---|
| 139 Cliff St Honesdale, PA | 3.0 | 2.0 | 900 | $1,800 | $2.00 | 4d | 1 | 0.03mi |
Listing history 19 events
-
2026-06-18days on market $150,000 Active 2 DOM
-
2026-06-17pricedays on market $150,000 Active 1 DOM
-
2026-06-13days on market $169,900 Active 77 DOM
-
2026-06-12days on market $169,900 Active 76 DOM
-
2026-06-09days on market $169,900 Active 73 DOM
-
2026-06-08days on market $169,900 Active 72 DOM
-
2026-06-08days on market $169,900 Active 71 DOM
-
2026-06-07days on market $169,900 Active 70 DOM
-
2026-06-04days on market $169,900 Active 67 DOM
-
2026-06-02days on market $169,900 Active 66 DOM
-
2026-06-01days on market $169,900 Active 65 DOM
-
2026-05-31pricedays on market $169,900 Active 64 DOM
-
2026-05-16status Active 1982-char remark
-
2026-05-10status Pending 1982-char remark
-
2026-05-07price $180,000 1982-char remark
-
2026-04-23price $190,000 1982-char remark
-
2026-04-10price $200,000 1982-char remark
-
2026-03-31price $210,000 1982-char remark
-
2026-03-21$220,000 Active 1982-char remark
ⓘ Source: listings_history table (triggers on properties + properties_extension) + one-shot
backfill from property_details.listing_events for pre-trigger history.
Tax reassessment forecast PA · Partial reset (capped growth)
- Current annual tax
- $2,548 · $212/mo
- Projected year-2 tax
- $2,548 · $212/mo
- Expected delta
- $0/yr ($0/mo · 0.0%)
ⓘ Screening estimate from a state-policy table — verify with the county assessor before closing.
Climate risk First Street
- Flood 6/10 Major FEMA zone X (unshaded) · 27% chance over 30 yrs
- Wildfire 1/10 Low
- Heat 3/10 Moderate 7 d/yr ≥92°F today · 17 d/yr by 30 yrs out
- Wind 2/10 Low 2% chance of damaging wind over 30 yrs
- Air quality 2/10 Low 1 unhealthy d/yr today · 2 by 30 yrs out
Nearby sold comps map
Loading sold comps map…
Walkable amenities ~0.75 mi
Loading nearby amenities…
Taxation est. · year 1
- Rental income
- $21,600
- − Mortgage interest
- −$8,402
- − Property taxes
- −$2,548
- − Insurance
- −$750
- − Repairs & maintenance
- −$1,728
- − Management
- −$1,728
- − Depreciation
- −$4,364
- Taxable income
- $2,080
- Est. tax owed @ 24.0%
- −$499
- After-tax cash flow
- $3,827/yr
For passive investors: Depreciation is non-cash, so a rental often shows a tax loss while cash-flowing — sheltering income. Rental losses are passive: they offset passive income freely, and up to $25,000/yr can offset ordinary (W-2) income if you actively participate and your MAGI is under $100k (phasing out to $0 by $150k); unused losses carry forward. On sale, claimed depreciation is recaptured at up to 25%, and gains may owe capital-gains tax (a 1031 exchange can defer both). Figures are a year-1 estimate at your 24.0% rate — not tax advice; consult a CPA.
Schools (NCES district)
- District
- Wayne Highlands SD
- NCES district ID
- 4224970
- Math proficiency
- 48% ▼ -12.00%
- Reading proficiency
- 64% ▼ -10.00%
- Median HH income
- $46,476
- Composite
- 47.36/100
- National rank
- #2292
- State rank
- #115 of 539 in PA
Livability — Honesdale
- Score
- 64/100
- State rank
- #1220
- US rank
- #14488
Category grades
Schools grade is shown separately in the Schools card above.
Census & demographics
- Census place
- Honesdale, PA
- Population (ZIP)
- 12,576
Population outlook (Wayne County) Hauer SSP2
- Today (2025)
- 47,924 people
- By 2030
- 46,191 · -3.6%
- By 2040
- 42,815 · -10.7%
- By 2050
- 39,873 · -16.8%
- By 2075
- 34,556 · -27.9%
- By 2100
- 28,358 · -40.8%
Race, ethnicity, and origin ACS 2023
- Neighborhood character
- Predominantly White (94%)
- Race & ethnicity
- White 94% Two or more races 4% Hispanic / Latino 3%
- Common ancestry
- Romanian 7% Lithuanian 2% Subsaharan African 2%
- Foreign-born
- 3%
- Languages at home
- 97% English-only · Spanish 1%
Political lean MEDSL · Wayne
- 2024 margin
- Solid R (+37.1) · D 31.1% · R 68.2%
- 2008→2024 swing
- -24.8pp toward R · 2008: -12.3pp · 2024: -37.1pp
- All cycles
- 2024: R+37.1 2020: R+33.6 2016: R+39.7 2012: R+20.9 2008: R+12.3
Not yet ingested
- Civics
- —
Market trends
- HPI YoY
- ▲ 30.12%
- Current HPI
- 313.5221
- Rent YoY
- —
- Metro
- —
- State GDP YoY
- ▲ 1.68%
- F500 in state
- 34
Industry mix (Fortune 500 HQ in PA)
| Industry | F500 HQs | Revenue |
|---|---|---|
| Healthcare | 2 | $309B |
|
||
| Insurance | 2 | $27B |
|
||
| Telecommunications / Media | 1 | $124B |
|
||
| Industrial Distribution | 1 | $22B |
|
||
| Financial Services | 1 | $20B |
|
||
| Chemicals / Materials | 1 | $18B |
|
||
Price history
-31.8% since first listed10 events — show timeline
- 2026-06-16 Listed $150,000 PMAR
- 2026-06-15 Listed for Rent $1,800 PMAR
- 2026-05-31 Price Changed $169,900 PWMLS
- 2026-05-16 Relisted — PWMLS
- 2026-05-10 Pending — PWMLS
- 2026-05-07 Price Changed $180,000 PWMLS
- 2026-04-23 Price Changed $190,000 PWMLS
- 2026-04-10 Price Changed $200,000 PWMLS
- 2026-03-31 Price Changed $210,000 PWMLS
- 2026-03-21 Listed $220,000 PWMLS
Property tax history
+5.9%/yrLatest (2026): $2,548 · +1.9% YoY. Source: county tax records.
Cash-flow waterfall
monthlySold comps — $/sqft
last 12 mo · ≤1 miLoading sold comps…