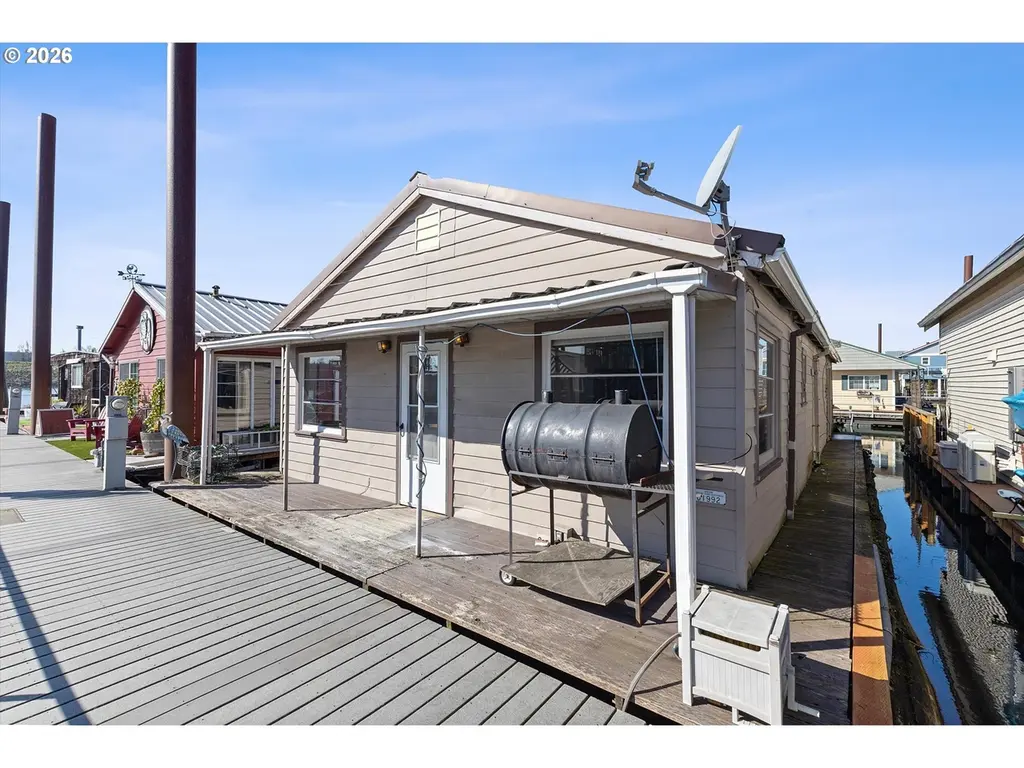
1833 N Jantzen Ave · Portland, OR
Flood risk No data
- FEMA flood zone
- —
- Chance of flooding over 30 yrs
- —
- Est. flood insurance / yr
- —
Fire risk No data
- Est. fire insurance / yr
- —
Heat risk 3/10 · Minor
- Hot days now (above threshold)
- 7 days/yr
- Hot days in 30 yrs
- 13 days/yr
Wind risk No data
- Chance of severe wind over 30 yrs
- —
Air-quality risk 10/10 · Severe
- Unhealthy air days now
- 19 days/yr
- Unhealthy air days in 30 yrs
- 20 days/yr
Risk factors via First Street. Map © Google.
Why this score? — see what drove the B grade
The composite is a weighted blend of 9 inputs, each scored 0–100. Each bar is that input's sub-score; the figure is the points it added to the 100-point composite (weight × sub-score).
- Cash flow +30.0/30.0
- 1% rule +10.0/10.0
- DSCR +10.0/10.0
- ARV discount +7.5/15.0
- Schools +5.0/10.0
- Livability +3.9/5.0
- Rent growth +2.7/5.0
- Condition / age +2.5/5.0
- Appreciation +0.0/10.0
$99,000
🖨 Deal sheet 📄 Offer letter ✓ Due diligence
Listing remarks MLS
Meet me at the river! Best priced floating home & OWNED SLIP on the river! Great layout with open living area plus a bonus loft/primary bedroom with beautiful river views! Located in the well maintained and popular Jantzen Beach Moorage where slips alone are valued around $100,000. Close proximity to I-5, shops & restaurants. This one won't last long, schedule a showing today!
Key facts
- Owned slip
- Open living area
- Bonus loft
Tags
Neighborhood map
What this means for you Summary
Snapshot
- This is a 1-bed/1.0-bath other listed at $99k.
Deal economics
- At list price, monthly cash flow is $828 ($10k/yr) — positive.
- The deal already cash-flows at list — no discount required.
- Meets the 1% rule at list price ($2k rent vs $99k).
- Recommended offer: $90k (9.0% below list) — sets the bar for market timing.
- Cap rate 16.3% vs local median 2.2% in Portland — top-decile yield for the area; either an underpriced asset or a hidden risk that comps aren't pricing in. Stress-test before assuming the spread holds.
Location & tenants
- Location reads 77/100 on livability (#72 in OR, #3,256 nationally) — a middle-class / working-renter tenant base. Strengths: amenities A+, commute A+, health & safety A+; Watch: crime F, cost of living F.
- Market conditions: Rents flat; 298 active listings in the ZIP; 17 comparable units currently listed for rent nearby; rentals leasing fast (median 2d on market — plan ~1-2 weeks tenant-placement turnaround); solid renter incomes; 2,041 units permitted in Multnomah County in 2024 (905 in 5+ unit buildings).
Forward outlook
- Local home prices are declining (-3.0%/yr); year-one equity from $684 of loan paydown is wiped out by about $3k of value loss. Plan a longer hold.
- Multnomah County population projected at +33% by 2050 — long-run rental-demand tailwind backs the buy-and-hold thesis.
- At projected returns (-3.0% appreciation + 0.9% rent growth), your $28k cash investment doubles in ~4 years — after that, you're playing with house money.
Negotiation context
- It's been on market 96 days — a 9% lower offer ($90k) is reasonable based on typical stale-listing flexibility.
Risks & watch-outs
- Watch-outs: built in 1940 — expect roof / HVAC / electrical / plumbing capex.
Questions for the listing agent
- It's been on market 96 days. Have you received any prior offers? Is the seller open to a 9% concession, seller financing, or rate buy-down credit?
- Built in 1940 — when were the roof, HVAC, electrical panel, plumbing, and water heater last replaced?
- Why hasn't it sold? Are there any deal-killer items the seller is aware of (foundation, flood, title, zoning, code violations)?
- Is there a deadline driving the sale (1031 exchange, divorce, estate, relocation)? That informs how much negotiation room exists.
- Crime grade is F in this area — have there been break-ins, vandalism, or insurance claims at this property in the last 3 years? What carrier currently insures it and at what premium?
- What's the average days-on-market for RENTAL listings here right now (not sales)? A rising rental-DOM trend means longer vacancies and softer asking-rent achievability than the comps imply.
- What's the recent tenant-quality profile in this submarket — average credit score on applications, eviction rate, late-payment / NSF rate, and stable-employment percentage? A property-management company in the area should have these aggregated.
- How much new for-sale + rental construction is in the pipeline within 1–3 miles? Heavy new supply typically softens prices + rents 12–24 months out; constrained supply supports both.
Investment metrics
- 1% rule
- 1.93% ✓
- Cap rate
- 16.33%
- Cash-on-cash
- 35.84%
- DSCR
- 2.59
- GRM
- 4.3
CMA / ARV
- ARV (median comp)
- $327,168
- List price
- $99,000
- Delta
- -69.74%
- Verdict
- UNDERPRICED
- Comps
- 10 within 2.0 mi
Projected returns pro-forma
-3.0% appreciation · 0.89% rent growth · sell at horizon
- IRR
- 29.1%
- Equity multiple
- 2.18×
- Total profit
- $32,731
- Equity at exit
- $14,761
- IRR
- 35.2%
- Equity multiple
- 3.92×
- Total profit
- $80,856
- Equity at exit
- $8,560
Cash invested: $27,720 (down + closing). Projections, not guarantees.
Landlord ↔ Tenant lean methodology
- Overall (CITY)
- 0 Strongly Tenant-Friendly
- State Oregon
- 28 Tenant-Leaning · D+6
- County
- — inherits STATE
- City Portland
- 0 Strongly Tenant-Friendly · D+39
ZIP-level market 97217
- Rents YoY
- 0.9%
- Active inventory
- 298
- Price-to-rent
- 4.3×
Monthly cashflow live
- Estimated rent
- $1,914 high interval (Pro) →
- Mortgage (P&I)
- −$519
- Tax est. 1.5%
- −$124 /mo · $1,485/yr
- Insurance
- −$41
- HOA
- −$0
- Vacancy / Maint / Mgmt
- −$402
- Net cashflow
- $828
Break-even live
UW: 25.0% down · 7.5% · 30yr · 1.5% tax · 5.0% vac · 8.0% maint · 8.0% mgmt
Financing live
Cash to close
- Down payment
- $24,750
- Closing costs
- $2,970
- Reserves months
- —
- Total cash needed
- —
Loan-product check · same deal, 3 products live
Conventional
25% down · 7.5% · 30yr
- Down + closing
- —
- Monthly P&I
- —
- Monthly cashflow
- —
- DSCR
- —
- Eligible?
- —
Personal DTI + credit; lowest rate.
DSCR
20% down · 8.5% · 30yr
- Down + closing
- —
- Monthly P&I
- —
- Monthly cashflow
- —
- DSCR
- —
- Eligible?
- —
No personal income docs; deal must DSCR.
Hard money
10% down · 12.0% · 12mo
- Down + closing
- —
- Monthly P&I
- —
- Monthly cashflow
- —
- DSCR
- —
- Eligible?
- —
Short-term bridge; refi at stabilization.
Rent comps 17 comps
| Address | Beds | Baths | Sqft | Rent | $/sqft | DOM | Units | Dist |
|---|---|---|---|---|---|---|---|---|
| 1245 N Anchor Way Portland, OR | 2.0 | 1.0–2.0 | 856 | $1,725 | $2.01 | 1d | 16 | 0.58mi |
| 1055 N Anchor Way Portland, OR | 1.0–2.0 | 1.0–2.0 | 1056 | $1,375 | $1.30 | 1d | 34 | 0.69mi |
| 995 N Marine Dr Portland, OR | 2.0 | 1.0–2.0 | 924 | $1,753 | $1.90 | 2d | 11 | 0.81mi |
| 111 Parkway Pl Vancouver, WA | 1.0–2.0 | 1.0–2.0 | 983 | $2,150 | $2.19 | 1d | 3 | 0.99mi |
| 1111 W Columbia Way Vancouver, WA | 2.0 | 1.0–2.5 | 857 | $3,250 | $3.79 | 1d | 28 | 1.01mi |
| 440 W Columbia Way Vancouver, WA | 2.0 | 1.0–2.0 | 863 | $3,007 | $3.48 | 1d | 150 | 1.02mi |
| 500 W Columbia Way Vancouver, WA | 2.0 | 1.0–2.0 | 849 | $2,904 | $3.42 | 1d | 6 | 1.03mi |
| 1110 W Columbia Way Vancouver, WA | 2.0 | 1.0–2.0 | 783 | $2,740 | $3.50 | 1d | 13 | 1.05mi |
| 1000 W Columbia Way Vancouver, WA | 1.0–2.0 | 1.0–2.0 | 767 | $1,593 | $2.08 | 1d | 11 | 1.07mi |
| 110 N Tomahawk Island Dr Portland, OR | 1.0–2.0 | 1.0–2.0 | 994 | $1,495 | $1.50 | 1d | 27 | 1.09mi |
| 636 W 6th St Vancouver, WA | 1.0–2.0 | 1.0 | 723 | $1,856 | $2.57 | 1d | 8 | 1.15mi |
| 411 Columbia St Vancouver, WA | 2.0 | 1.0–2.0 | 818 | $2,437 | $2.98 | 1d | 14 | 1.15mi |
| 555 W 8th St Vancouver, WA | 1.0–2.0 | 1.0 | 695 | $1,335 | $1.92 | 1d | 11 | 1.22mi |
| 608 Washington St Vancouver, WA | 2.0 | 1.0–2.0 | 903 | $2,444 | $2.70 | 1d | 11 | 1.27mi |
| 300 W 8th St Vancouver, WA | 1.0–2.0 | 1.0–2.0 | 915 | $2,932 | $3.20 | 1d | 1 | 1.31mi |
| 511 W Evergreen Blvd Vancouver, WA | — | 1.0 | 445 | $1,098 | $2.47 | 2d | 1 | 1.33mi |
| 615 Main St Vancouver, WA | 1.0 | 1.0 | 500 | $1,170 | $2.34 | 2d | 1 | 1.33mi |
Listing history 8 events
-
2026-06-08days on market $99,000 Active 96 DOM
-
2026-06-07days on market $99,000 Active 95 DOM
-
2026-06-03days on market $99,000 Active 91 DOM
-
2026-06-02days on market $99,000 Active 90 DOM
-
2026-06-01days on market $99,000 Active 89 DOM
-
2026-05-31days on market $99,000 Active 88 DOM
-
2026-05-04price $99,000 387-char remark
Show marketing remark (387 chars)
Meet me at the river! Best priced floating home & OWNED SLIP on the river! Great layout with open living area plus a bonus loft/primary bedroom with beautiful river views! Located in the well maintained and popular Jantzen Beach Moorage where slips alone are valued around $100,000. Close proximity to I-5, shops & restaurants. This one won't last long, schedule a showing today!
-
2026-03-04$124,999 Active 387-char remark
Show marketing remark (387 chars)
Meet me at the river! Best priced floating home & OWNED SLIP on the river! Great layout with open living area plus a bonus loft/primary bedroom with beautiful river views! Located in the well maintained and popular Jantzen Beach Moorage where slips alone are valued around $100,000. Close proximity to I-5, shops & restaurants. This one won't last long, schedule a showing today!
ⓘ Source: listings_history table (triggers on properties + properties_extension) + one-shot
backfill from property_details.listing_events for pre-trigger history.
Climate risk First Street
- Heat 3/10 Moderate
- Air quality 10/10 Extreme 19 unhealthy d/yr today · 20 by 30 yrs out
Nearby sold comps map
Loading sold comps map…
Walkable amenities ~0.75 mi
Loading nearby amenities…
Taxation est. · year 1
- Rental income
- $22,967
- − Mortgage interest
- −$5,546
- − Property taxes
- −$1,485
- − Insurance
- −$495
- − Repairs & maintenance
- −$1,837
- − Management
- −$1,837
- − Depreciation
- −$2,880
- Taxable income
- $8,887
- Est. tax owed @ 24.0%
- −$2,133
- After-tax cash flow
- $7,801/yr
For passive investors: Depreciation is non-cash, so a rental often shows a tax loss while cash-flowing — sheltering income. Rental losses are passive: they offset passive income freely, and up to $25,000/yr can offset ordinary (W-2) income if you actively participate and your MAGI is under $100k (phasing out to $0 by $150k); unused losses carry forward. On sale, claimed depreciation is recaptured at up to 25%, and gains may owe capital-gains tax (a 1031 exchange can defer both). Figures are a year-1 estimate at your 24.0% rate — not tax advice; consult a CPA.
Schools (NCES district)
No district data.
Livability — Portland
- Score
- 77/100
- State rank
- #72
- US rank
- #3256
Category grades
Schools grade is shown separately in the Schools card above.
Census & demographics
- Census place
- Portland, OR
- County
- Multnomah County · 786,692 people
- City population
- 774,334
- Metro
- Portland-Vancouver-Hillsboro, OR-WA
- Population (ZIP)
- 35,169
- Household income
- $100,361
- Rent vs Own
- Severe rent burden
- 1532.0
Population outlook (Multnomah County) Hauer SSP2
- Today (2025)
- 930,825 people
- By 2030
- 996,904 · +7.1%
- By 2040
- 1,121,379 · +20.5%
- By 2050
- 1,242,124 · +33.4%
- By 2075
- 1,464,431 · +57.3%
- By 2100
- 1,576,181 · +69.3%
Race, ethnicity, and origin ACS 2023
- Neighborhood character
- Predominantly White (71%)
- Race & ethnicity
- White 71% Two or more races 12% Hispanic / Latino 9% Black 7% Asian 3%
- Hispanic origin (detail)
- Mexican 5%
- Common ancestry
- Italian 5% Slovak 4% Portuguese 3%
- Foreign-born
- 8% · Canada, China, Vietnam
- Languages at home
- 90% English-only · Spanish 4% Other Indo-European 1% Chinese 1%
Political lean MEDSL · Multnomah
- 2024 margin
- Solid D (+62.1) · D 79.3% · R 17.2% · Other 3.5%
- 2008→2024 swing
- +6.0pp toward D · 2008: 56.1pp · 2024: 62.1pp
- All cycles
- 2024: D+62.1 2020: D+61.3 2016: D+58.3 2012: D+54.9 2008: D+56.1
Not yet ingested
- Civics
- —
Market trends
- HPI YoY
- ▼ -747.13%
- Current HPI
- 370.7526
- Rent YoY
- ▲ 0.89%
- Metro
- Portland-Vancouver-Hillsboro, OR-WA
- State GDP YoY
- ▲ 2.05%
- F500 in state
- 2
Industry mix (Fortune 500 HQ in OR)
| Industry | F500 HQs | Revenue |
|---|---|---|
| Consumer Goods | 1 | $51B |
|
||
Price history
-20.8% since first listed2 events — show timeline
- 2026-05-04 Price Changed $99,000 RMLS
- 2026-03-04 Listed $124,999 RMLS
Cash-flow waterfall
monthlySold comps — $/sqft
last 12 mo · ≤1 miLoading sold comps…