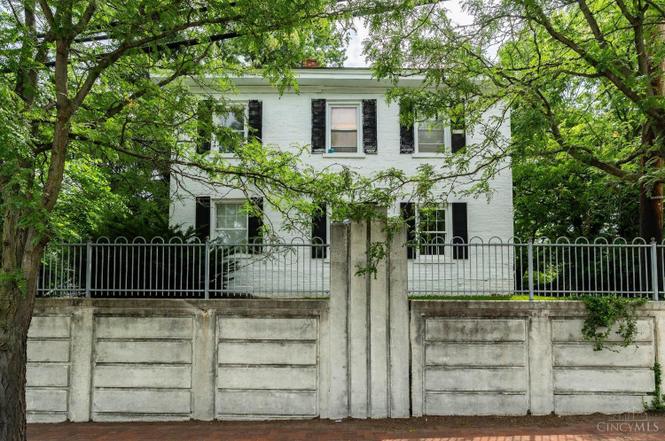
 Duplex
2320 Beechmont Ave · Cincinnati, OH
Flood risk 1/10 · Minimal
- FEMA flood zone
- X (unshaded)
- Chance of flooding over 30 yrs
- 0.0%
- Est. flood insurance / yr
- $473 – $860
Fire risk 1/10 · Minimal
- Est. fire insurance / yr
- $713 – $1,323
Heat risk 4/10 · Minor
- Hot days now (above 102°F)
- 7 days/yr
- Hot days in 30 yrs
- 18 days/yr
Wind risk 2/10 · Minimal
- Chance of severe wind over 30 yrs
- 1.0%
Air-quality risk 3/10 · Minor
- Unhealthy air days now
- 2 days/yr
- Unhealthy air days in 30 yrs
- 4 days/yr
Risk factors via First Street. Map © Google.
Why this score? — see what drove the D grade
The composite is a weighted blend of 9 inputs, each scored 0–100. Each bar is that input's sub-score; the figure is the points it added to the 100-point composite (weight × sub-score).
- Cash flow +14.8/30.0
- ARV discount +6.2/15.0
- DSCR +4.5/10.0
- 1% rule +4.1/10.0
- Livability +4.0/5.0
- Rent growth +3.1/5.0
- Schools +2.5/10.0
- Condition / age +2.5/5.0
- Appreciation +0.0/10.0
$299,000
🖨 Deal sheet 📄 Offer letter ✓ Due diligence
Multi-family units
County records classify this as Multi-Family (2-4 Unit). Listing-text estimate: 2 units. confirmed
Listing remarks MLS
Nice Duplex Conveniently Located Near the Heart of Mt. Washington. Updated 2 Bedroom, 1 Bath First Floor Unit w/Laminate Flooring Throughout. Full Bath with Ceramic Flooring. Updated Kitchen w/Quartz Countertops, Island & Stainless Appliances. Spacious Living/Dining Room. Second Floor 1 Bedroom, 1 Bath Has Some Hardwood Flooring, Full Bath, Living/Dining Room. Off Street Parking. All Appliances Included. Selling AS IS.
Key facts
- Brand new range
- Refrigerator
- Duplex
Tags
Property features AI
Finance
- Other: Zoned for multi-family
- Financial info: Two-unit property with current rents: 1-bedroom unit $900, 2-bedroom unit $1,800
Exterior
- Parking: Off-street parking with 4 open spaces; Private drive with rear parking access
- Utilities: Public water (owner pays); Public sewer; Natural gas
- Home design: Duplex; Two levels
- Construction: Shingle roof; Stone foundation; Brick construction
- Exterior features: Front porch; Vinyl insulated windows; Brick exterior
Interior
- Bedrooms: Unit 1: 1 bedroom; Unit 2: 2 bedrooms
- Bathrooms: Unit 1: 1 full bathroom; Unit 2: 1 full bathroom
- Heating & cooling: Forced air gas heating (heat paid by tenant); Central air conditioning; Separate A/C for units; Separate gas and electric meters
- Interior features: Partial basement
Neighborhood map
What this means for you Summary
Snapshot
- This is a 2 × 3-bed/1.0-bath units multifamily listed at $299k.
Deal economics
- At list price, monthly cash flow is $80 ($955/yr) — positive. Per door: $40/mo.
- The deal already cash-flows at list — no discount required.
- To meet the 1% rule (rent ≥ 1% of price), the offer needs to be $272k (9.2% below list).
- Recommended offer: $272k (9.2% below list) — sets the bar for 1% rule.
- Cap rate 6.6% vs local median 3.9% in Cincinnati — top-decile yield for the area; either an underpriced asset or a hidden risk that comps aren't pricing in. Stress-test before assuming the spread holds.
Location & tenants
- Location reads 80/100 on livability (#130 in OH, #1,856 nationally) — a professional / high-income tenant draw. Strengths: amenities A+, commute A+, cost of living A+; Watch: employment D, crime F.
- Cincinnati Public Schools (urban): math 25% / reading 36% proficiency, ranked #581 of 656 in OH (top 89%) — families likely to look elsewhere, expect single-tenant / working-renter base with shorter leases; 70% free/reduced lunch — lower-income household profile, screen leases tightly.
- Market conditions: Rents rising (+2.4%/yr); 64 active listings in the ZIP; 3 comparable units currently listed for rent nearby; rentals leasing fast (median 13d on market — plan ~1-2 weeks tenant-placement turnaround); solid renter incomes; 801 units permitted in Hamilton County in 2024 (190 in 5+ unit buildings).
- This rent runs 36% of the median local income ($90k/yr) — at the standard rent-burdened threshold; future hikes will face affordability resistance.
Forward outlook
- Local home prices are declining (-3.0%/yr); year-one equity from $2k of loan paydown is wiped out by about $9k of value loss. Plan a longer hold.
Negotiation context
- Only 3 days on market — expect competitive offers; lowballing is unlikely to land.
- 12 sale attempts since 22y ago with the ask held roughly flat each time — persistent listings suggest the price (not the market) is what's stuck; bring a comps-based counter.
Risks & watch-outs
- Watch-outs: built in 1860 — expect roof / HVAC / electrical / plumbing capex.
Questions for the listing agent
- Can we see the unit-by-unit rent roll, current vacancy, and any below-market leases? What's the average tenancy length?
- What capital expenditures (roof, boiler, parking lot, exteriors) have been made in the last 5 years, and what's planned in the next 2?
- Built in 1860 — when were the roof, HVAC, electrical panel, plumbing, and water heater last replaced?
- Is there a deadline driving the sale (1031 exchange, divorce, estate, relocation)? That informs how much negotiation room exists.
- Schools are B-rated — typically a magnet for longer-tenancy family renters. What's the average tenant stay here, and is there a school-zone premium baked into asking?
- Crime grade is F in this area — have there been break-ins, vandalism, or insurance claims at this property in the last 3 years? What carrier currently insures it and at what premium?
- The area grade is low — what's the realistic commute time and amenity access for the typical tenant pool here? Any planned neighborhood developments (good or bad) we should know about?
- What's the average days-on-market for RENTAL listings here right now (not sales)? A rising rental-DOM trend means longer vacancies and softer asking-rent achievability than the comps imply.
- What's the recent tenant-quality profile in this submarket — average credit score on applications, eviction rate, late-payment / NSF rate, and stable-employment percentage? A property-management company in the area should have these aggregated.
- How much new apartment / multifamily construction is in the pipeline within 1–3 miles? Heavy new supply (>2% of stock underway) typically softens rents 12–24 months out; light construction supports rent growth.
Investment metrics
- 1% rule
- 0.91% ✗
- Cap rate
- 6.61%
- Cash-on-cash
- 1.14%
- DSCR
- 1.05
- GRM
- 9.2
CMA / ARV
- ARV (on-the-fly)
- $290,628
- Comps found
- 3
Show comp detail 3 sales within ~0.75 mi
| Address | Dist | Beds/Ba | Sqft | Sold | Price | $/sf | Match |
|---|---|---|---|---|---|---|---|
| 2320 Beechmont Ave | 0.00mi | 3/2.0 | 2,106 (0%) | 13mo | $265,000 | $126 | 89 |
| 6234 Crestview Pl | 0.08mi | 3/3.0 | 2,330 (+11%) | 16mo | $320,665 | $138 | 61 |
| 6004 Wayside Ave | 0.57mi | 4/2.0 (+1) | 2,093 (-1%) | 15mo | $295,000 | $141 | 55 |
Match score weights: distance 35% · size 25% · config 20% · recency 20%. Top-matched comps best support the ARV.
Projected returns pro-forma
-3.0% appreciation · 2.39% rent growth · sell at horizon
- IRR
- -15.2%
- Equity multiple
- 0.46×
- Total profit
- $-44,996
- Equity at exit
- $44,582
- IRR
- -7.6%
- Equity multiple
- 0.53×
- Total profit
- $-39,203
- Equity at exit
- $25,852
Cash invested: $83,720 (down + closing). Projections, not guarantees.
Landlord ↔ Tenant lean methodology
- Overall (STATE)
- 73 Landlord-Friendly
- State Ohio
- 73 Landlord-Friendly · R+6
- County
- — inherits STATE
- City
- — inherits STATE
ZIP-level market 45230
- Rents YoY
- 2.4%
- Active inventory
- 64
- Price-to-rent
- 18.4×
Monthly cashflow live
- Estimated rent
- $2,715 high interval (Pro) →
- Mortgage (P&I)
- −$1,568
- Tax from tax record
- −$373 /mo · $4,472/yr
- Insurance
- −$125
- HOA
- −$0
- Vacancy / Maint / Mgmt
- −$570
- Net cashflow
- $80
Break-even live
2-unit breakdown (identical units grouped — click to expand)
| Units | Beds | Baths | Est. rent |
|---|---|---|---|
| 2× units | 3 | 1 | $2,714 |
| #1 | 3 | 1 | $1,357 |
| #2 | 3 | 1 | $1,357 |
| Total (2 units) | $2,715 | ||
UW: 25.0% down · 7.5% · 30yr · 1.5% tax · 5.0% vac · 8.0% maint · 8.0% mgmt
Financing live
Cash to close
- Down payment
- $74,750
- Closing costs
- $8,970
- Reserves months
- —
- Total cash needed
- —
Loan-product check · same deal, 3 products live
Conventional
25% down · 7.5% · 30yr
- Down + closing
- —
- Monthly P&I
- —
- Monthly cashflow
- —
- DSCR
- —
- Eligible?
- —
Personal DTI + credit; lowest rate.
DSCR
20% down · 8.5% · 30yr
- Down + closing
- —
- Monthly P&I
- —
- Monthly cashflow
- —
- DSCR
- —
- Eligible?
- —
No personal income docs; deal must DSCR.
Hard money
10% down · 12.0% · 12mo
- Down + closing
- —
- Monthly P&I
- —
- Monthly cashflow
- —
- DSCR
- —
- Eligible?
- —
Short-term bridge; refi at stabilization.
Rent comps 3 comps
| Address | Beds | Baths | Sqft | Rent | $/sqft | DOM | Units | Dist |
|---|---|---|---|---|---|---|---|---|
| 6019 Tridale Ct Cincinnati, OH | 3.0 | 2.0 | 1524 | $2,131 | $1.40 | 1d | 1 | 0.55mi |
| 6006 Stanhill Ct Cincinnati, OH | 3.0 | 2.0 | 2056 | $1,995 | $0.97 | 23d | 1 | 0.82mi |
| 6951 Copperglow Ct Cincinnati, OH | 4.0 | 2.5 | 1970 | $2,595 | $1.32 | 12d | 1 | 1.25mi |
Listing history 4 events
-
2026-06-18days on market $299,000 Active 3 DOM
-
2026-06-17days on market $299,000 Active 2 DOM
-
2026-06-16remarks 389-char remark
-
2026-06-16$299,000 Active 1 DOM
ⓘ Source: listings_history table (triggers on properties + properties_extension) + one-shot
backfill from property_details.listing_events for pre-trigger history.
Tax reassessment forecast OH · Partial reset (capped growth)
- Current annual tax
- $4,472 · $373/mo
- Projected year-2 tax
- $4,568 · $381/mo
- Expected delta
- +$96/yr (+$8/mo · 2.2%)
ⓘ Screening estimate from a state-policy table — verify with the county assessor before closing.
Climate risk First Street
- Flood 1/10 Low FEMA zone X (unshaded) · 0% chance over 30 yrs
- Wildfire 1/10 Low
- Heat 4/10 Moderate 7 d/yr ≥102°F today · 18 d/yr by 30 yrs out
- Wind 2/10 Low 100% chance of damaging wind over 30 yrs
- Air quality 3/10 Moderate 2 unhealthy d/yr today · 4 by 30 yrs out
Nearby sold comps map
Loading sold comps map…
Walkable amenities ~0.75 mi
Loading nearby amenities…
Taxation est. · year 1
- Rental income
- $32,580
- − Mortgage interest
- −$16,749
- − Property taxes
- −$4,472
- − Insurance
- −$1,495
- − Repairs & maintenance
- −$2,606
- − Management
- −$2,606
- − Depreciation
- −$8,698
- Taxable loss
- −$4,047
- Est. tax savings @ 24.0%
- +$971
- After-tax cash flow
- $1,927/yr
For passive investors: Depreciation is non-cash, so a rental often shows a tax loss while cash-flowing — sheltering income. Rental losses are passive: they offset passive income freely, and up to $25,000/yr can offset ordinary (W-2) income if you actively participate and your MAGI is under $100k (phasing out to $0 by $150k); unused losses carry forward. On sale, claimed depreciation is recaptured at up to 25%, and gains may owe capital-gains tax (a 1031 exchange can defer both). Figures are a year-1 estimate at your 24.0% rate — not tax advice; consult a CPA.
Schools (NCES district)
- District
- Cincinnati Public Schools
- NCES district ID
- 3904375
- Math proficiency
- 25% ▼ -19.00%
- Reading proficiency
- 36% ▼ -14.00%
- Median HH income
- $35,743
- Composite
- 25.21/100
- National rank
- #7508
- State rank
- #581 of 656 in OH
Livability — Cincinnati
- Score
- 80/100
- State rank
- #130
- US rank
- #1856
Category grades
Schools grade is shown separately in the Schools card above.
Census & demographics
- Census place
- Cincinnati, OH
- County
- Hamilton County · 701,295 people
- City population
- 505,555
- Metro
- Cincinnati, OH-KY-IN
- Population (ZIP)
- 27,501
- Household income
- $89,516
- Rent vs Own
- Severe rent burden
- 527.0
Population outlook (Hamilton County) Hauer SSP2
- Today (2025)
- 826,054 people
- By 2030
- 830,947 · +0.6%
- By 2040
- 832,319 · +0.8%
- By 2050
- 822,428 · -0.4%
- By 2075
- 788,688 · -4.5%
- By 2100
- 710,674 · -14.0%
Race, ethnicity, and origin ACS 2023
- Neighborhood character
- Predominantly White (86%)
- Race & ethnicity
- White 86% Two or more races 7% Hispanic / Latino 4% Black 4% Asian 1%
- Common ancestry
- Romanian 2% Iranian 2% Slovak 2%
- Foreign-born
- 3% · Canada, South Korea
- Languages at home
- 95% English-only · Spanish 3% German/W. Germanic 1%
Political lean MEDSL · Hamilton
- 2024 margin
- D (+14.9) · D 57.0% · R 42.1%
- 2008→2024 swing
- +7.9pp toward D · 2008: 7.0pp · 2024: 14.9pp
- All cycles
- 2024: D+14.9 2020: D+15.9 2016: D+9.5 2012: D+4.9 2008: D+7.0
Not yet ingested
- Civics
- —
Market trends
- HPI YoY
- ▼ -231.96%
- Current HPI
- 224.6954
- Rent YoY
- ▲ 2.39%
- Metro
- Cincinnati, OH-KY-IN
- State GDP YoY
- ▲ 1.98%
- F500 in state
- 48
Industry mix (Fortune 500 HQ in OH)
| Industry | F500 HQs | Revenue |
|---|---|---|
| Insurance | 3 | $145B |
|
||
| Industrial Machinery | 3 | $49B |
|
||
| Financial Services | 3 | $24B |
|
||
| Consumer Goods | 2 | $93B |
|
||
| Aerospace / Defense | 2 | $47B |
|
||
| Utilities | 2 | $33B |
|
||
Price history
+239.8% since first listed37 events — show timeline
- 2026-06-15 Listed $299,000 Cincy MLS
- 2025-05-19 Sold (Public Records) $265,000 Public Records
- 2025-05-09 Sold (MLS) $265,000 Cincy MLS
- 2025-04-08 Contingent — Cincy MLS
- 2025-03-18 Listed $280,000 Cincy MLS
- 2022-06-06 Sold (Public Records) $200,000 Public Records
- 2022-05-31 Sold (MLS) $200,000 Cincy MLS
- 2022-05-20 Contingent — Cincy MLS
- 2022-05-18 Listed $200,000 Cincy MLS
- 2020-11-24 Sold (Public Records) $145,000 Public Records
- 2020-11-06 Sold (MLS) $145,000 Cincy MLS
- 2020-08-29 Contingent — Cincy MLS
- 2020-08-11 Listed $155,000 Cincy MLS
- 2019-10-09 Sold (Public Records) $129,640 Public Records
- 2019-09-27 Sold (MLS) $129,640 Cincy MLS
- 2019-08-14 Contingent — Cincy MLS
- 2019-08-02 Listed $129,900 Cincy MLS
- 2019-06-19 Listing Removed — Cincy MLS
- 2019-06-02 Price Changed $129,900 Cincy MLS
- 2019-05-01 Price Changed $134,900 Cincy MLS
- 2019-04-16 Listed $139,000 Cincy MLS
- 2015-02-09 Sold (Public Records) $111,000 Public Records
- 2015-02-05 Sold (MLS) $111,000 Cincy MLS
- 2014-10-21 Listed $115,000 Cincy MLS
- 2010-08-20 Sold (Public Records) $77,500 Public Records
- 2010-08-17 Sold (MLS) $77,500 Cincy MLS
- 2010-05-11 Listed $82,900 Cincy MLS
- 2010-04-28 Listing Removed — Cincy MLS
- 2009-10-28 Listed $94,900 Cincy MLS
- 2007-03-04 Listing Removed — Cincy MLS
- 2006-10-15 Listed $120,000 Cincy MLS
- 2005-10-18 Listing Removed — Cincy MLS
- 2005-07-16 Listed $125,000 Cincy MLS
- 2005-05-13 Listing Removed — Cincy MLS
- 2004-10-06 Listed $125,000 Cincy MLS
- 1995-12-14 Sold (Public Records) $118,000 Public Records
- 1989-07-31 Sold (Public Records) $88,000 Public Records
Property tax history
+8.6%/yrLatest (2025): $4,472 · +0.1% YoY. Source: county tax records.
Cash-flow waterfall
monthlySold comps — $/sqft
last 12 mo · ≤1 miLoading sold comps…