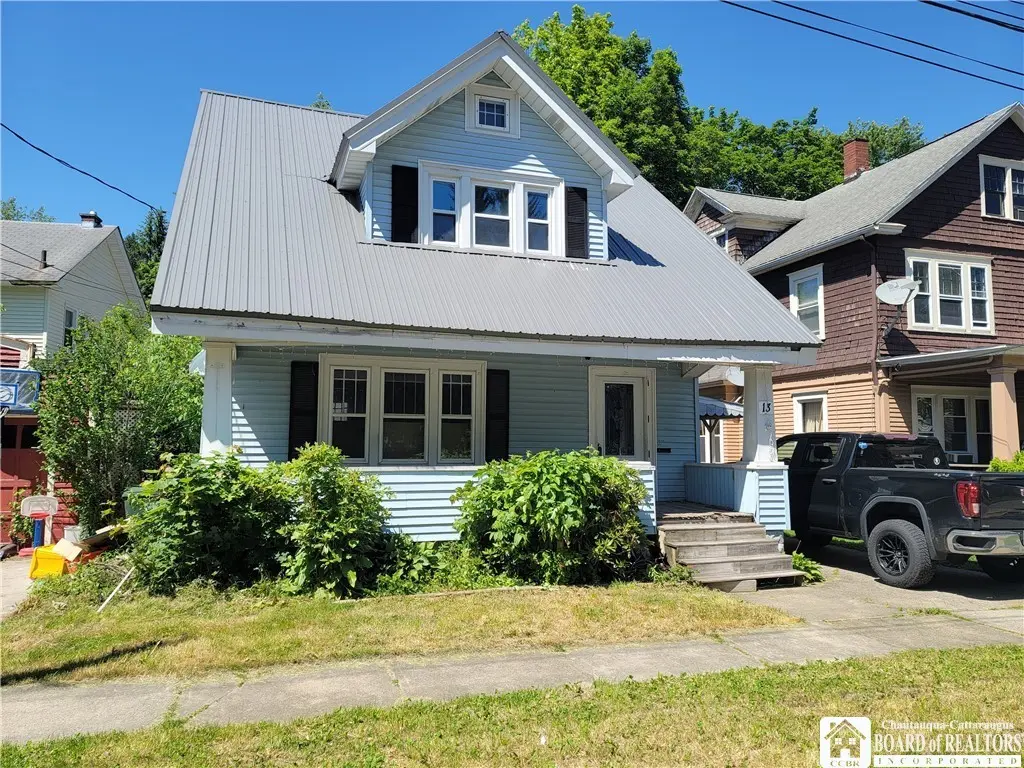
13 Linden Ave · Jamestown, NY
Flood risk 1/10 · Minimal
- FEMA flood zone
- —
- Chance of flooding over 30 yrs
- 0.0%
- Est. flood insurance / yr
- —
Fire risk 1/10 · Minimal
- Est. fire insurance / yr
- $691 – $1,283
Heat risk 2/10 · Minimal
- Hot days now (above 91°F)
- 7 days/yr
- Hot days in 30 yrs
- 17 days/yr
Wind risk 1/10 · Minimal
- Chance of severe wind over 30 yrs
- —
Air-quality risk 2/10 · Minimal
- Unhealthy air days now
- 0 days/yr
- Unhealthy air days in 30 yrs
- 1 days/yr
Risk factors via First Street. Map © Google.
Why this score? — see what drove the B- grade
The composite is a weighted blend of 9 inputs, each scored 0–100. Each bar is that input's sub-score; the figure is the points it added to the 100-point composite (weight × sub-score).
- Cash flow +30.0/30.0
- 1% rule +10.0/10.0
- DSCR +10.0/10.0
- ARV discount +7.5/15.0
- Livability +3.5/5.0
- Schools +3.1/10.0
- Rent growth +2.5/5.0
- Condition / age +2.5/5.0
- Appreciation +0.0/10.0
$30,000
🖨 Deal sheet (PDF) 📄 Offer letter ✓ Due diligence
Listing remarks MLS
Single Family 2 Story 3 bedroom 1 bath home, with old style charm and woodwork. Front entry into the foyer with built in closet space. Living room is spacious with tall ceilings. There is a fireplace but unsure if works or not, it was never used. Formal dining makes room for a large table with original wood framed windows and archways. Kitchen has old style cupboards and is spacious for a small breakfast table. Kitchen access to the full basement, new furnace and water heater. Laundry is in the basement. Upstairs features three bedrooms with walk in closets. Attic is full and would make for more space or storage. Currently rented. There is no backyard but a big front porch allows for fresh air enjoyment. Carport has a small storage unit built in the back. Roof is part metal on the front and asphalt on the back. Seller just repaired front steps. Electric needs updated as its fuses.
Key facts
- Dedicated driveway
- Carport
- Full basement
Tags
Property features AI
Exterior
- Parking: Carport (no garage)
- Utilities: Public water (connected); Sewer connected
- Home design: 2-story home; Existing construction; Vinyl siding
- Construction: Block foundation
- Exterior features: Concrete driveway; City street frontage; Rectangular residential lot (approx. 40 x 45)
Interior
- Kitchen: Gas cooktop
- Flooring: Hardwood; Luxury vinyl; Vinyl; Varies
- Bathrooms: 1 full bathroom
- Heating & cooling: Gas forced-air heating
- Interior features: Separate/formal dining room; Full basement
- Laundry & utility: Water heater
Neighborhood map
What this means for you Summary
Snapshot
- This is a 3-bed/1.0-bath single-family listed at $30k.
Deal economics
- At list price, monthly cash flow is $762 ($9k/yr) — positive.
- The deal already cash-flows at list — no discount required.
- Meets the 1% rule at list price ($1k rent vs $30k).
- Recommended offer: $30k (1.5% below list) — sets the bar for market timing.
- Cap rate 36.8% vs local median 16.8% in Jamestown — top-decile yield for the area; either an underpriced asset or a hidden risk that comps aren't pricing in. Stress-test before assuming the spread holds.
Location & tenants
- Location reads 69/100 on livability (#470 in NY) — a middle-class / working-renter tenant base. Strengths: cost of living A+, housing A+, health & safety A+; Watch: amenities D, crime F, commute F.
- Jamestown City School District (town): math 33% / reading 42% proficiency, ranked #553 of 590 in NY (top 94%) — families likely to look elsewhere, expect single-tenant / working-renter base with shorter leases.
- Zoned schools: Milton J Fletcher Elementary School (math 27% / reading 42%, grade F, #1,577 of 2,108 statewide, top 77%, 530 students, 74% FRL); Thomas Jefferson Middle School (math 25% / reading 40%, grade F, #504 of 729 statewide, top 70%, 406 students, 79% FRL); Jamestown High School (math 87% / reading 92%, grade A+, #265 of 1,100 statewide, top 26%, 1,315 students, 80% FRL) — zoned schools average 77% FRL vs 60% district-wide (17 pts higher); higher-poverty schools than district average — tighter screening recommended.
- Zoned-school proficiency averages 52% at this address vs 38% district-wide (+15 pts) — the actual schools serving this property are materially stronger than the Jamestown City School District average implies; a family-tenant draw the district grade alone would hide.
- Market conditions: 315 active listings in the ZIP; 3 comparable units currently listed for rent nearby; rentals lingering (median 45d on market — plan ~5-8 weeks vacancy on turnover, expect pricing pressure); 100% of comp listings sitting > 30 days — soft ceiling on asking rent; 127 units permitted in Chautauqua County in 2024 (0 in 5+ unit buildings).
Forward outlook
- Local home prices are declining (-3.0%/yr); year-one equity from $207 of loan paydown is wiped out by about $900 of value loss. Plan a longer hold.
- Chautauqua County population projected at -22% by 2050 — secular population decline; favor cash flow + early exit over multi-decade hold.
- At projected returns (-3.0% appreciation + 3.0% rent growth), your $8k cash investment doubles in ~1 year — after that, you're playing with house money.
Negotiation context
- It's been on market 16 days — a 2% lower offer ($30k) is reasonable based on typical stale-listing flexibility.
- 7 sale attempts since 26y ago with the ask held roughly flat each time — persistent listings suggest the price (not the market) is what's stuck; bring a comps-based counter.
- Current owner paid $20k; list at $30k implies a 50% gain — meaningful room to come down on a strong offer.
Risks & watch-outs
- Watch-outs: built in 1920 — expect roof / HVAC / electrical / plumbing capex.
Questions for the listing agent
- Built in 1920 — when were the roof, HVAC, electrical panel, plumbing, and water heater last replaced?
- Is there a deadline driving the sale (1031 exchange, divorce, estate, relocation)? That informs how much negotiation room exists.
- Crime grade is F in this area — have there been break-ins, vandalism, or insurance claims at this property in the last 3 years? What carrier currently insures it and at what premium?
- What's the average days-on-market for RENTAL listings here right now (not sales)? A rising rental-DOM trend means longer vacancies and softer asking-rent achievability than the comps imply.
- What's the recent tenant-quality profile in this submarket — average credit score on applications, eviction rate, late-payment / NSF rate, and stable-employment percentage? A property-management company in the area should have these aggregated.
- How much new for-sale + rental construction is in the pipeline within 1–3 miles? Heavy new supply typically softens prices + rents 12–24 months out; constrained supply supports both.
Investment metrics
- 1% rule
- 4.09% ✓
- Cap rate
- 36.78%
- Cash-on-cash
- 108.86%
- DSCR
- 5.84
- GRM
- 2.0
CMA / ARV
- ARV (on-the-fly)
- $87,703
- Comps found
- 12
Show comp detail 12 sales within ~0.75 mi
| Address | Dist | Beds/Ba | Sqft | Sold | Price | $/sf | Match |
|---|---|---|---|---|---|---|---|
| 9 Myers Ave | 0.11mi | 3/1.0 | 1,290 (-2%) | 3mo | $35,000 | $27 | 90 |
| 307 Newland Ave | 0.25mi | 3/1.0 | 1,334 (+2%) | 3mo | $50,000 | $37 | 82 |
| 306 Charles St | 0.34mi | 3/1.0 | 1,320 (+1%) | 5mo | $75,000 | $57 | 78 |
| 9 Stearns Ave | 0.20mi | 3/1.5 | 1,443 (+10%) | 3mo | $13,500 | $9 | 69 |
| 22 Linwood Ave | 0.56mi | 3/2.0 | 1,337 (+2%) | 3mo | $90,000 | $67 | 64 |
| 126 Crown St | 0.34mi | 3/1.0 | 1,496 (+14%) | 6mo | $106,500 | $71 | 55 |
| 214 Hazzard St | 0.41mi | 4/1.5 (+1) | 1,434 (+10%) | 5mo | $83,000 | $58 | 54 |
| 128 Howard St | 0.65mi | 2/1.0 (-1) | 1,404 (+7%) | 1mo | $38,000 | $27 | 52 |
| 117 Camp St | 0.74mi | 3/1.5 | 1,392 (+6%) | 2mo | $115,000 | $83 | 51 |
| 60 W Virginia Blvd | 0.62mi | 3/1.5 | 1,469 (+12%) | 4mo | $145,000 | $99 | 45 |
| 513 Prospect St | 0.56mi | 2/2.0 (-1) | 1,176 (-10%) | 4mo | $100,000 | $85 | 44 |
| 194 Hazeltine Ave | 0.50mi | 4/1.5 (+1) | 1,488 (+14%) | 6mo | $125,000 | $84 | 42 |
Match score weights: distance 35% · size 25% · config 20% · recency 20%. Top-matched comps best support the ARV.
Projected returns pro-forma
-3.0% appreciation · 3.0% rent growth · sell at horizon
- IRR
- —
- Equity multiple
- 6.20×
- Total profit
- $43,693
- Equity at exit
- $4,473
- IRR
- —
- Equity multiple
- 12.98×
- Total profit
- $100,620
- Equity at exit
- $2,594
Cash invested: $8,400 (down + closing). Projections, not guarantees.
Landlord ↔ Tenant lean methodology
- Overall (STATE)
- 15 Strongly Tenant-Friendly
- State New York
- 15 Strongly Tenant-Friendly · D+10
- County
- — inherits STATE
- City
- — inherits STATE
ZIP-level market 14701
- Home prices YoY
- -18.5%
- Active inventory
- 315
- Price-to-rent
- 2.0×
Monthly cashflow live
- Estimated rent
- $1,227 medium interval (Pro) →
- Mortgage (P&I)
- −$157
- Tax est. 1.5%
- −$38 /mo · $450/yr
- Insurance
- −$12
- HOA
- −$0
- Vacancy / Maint / Mgmt
- −$258
- Net cashflow
- $762
Break-even live
Sensitivity live
| Price | -10% $783 | -5% $772 | +0% $762 | +5% $752 | +10% $741 |
|---|---|---|---|---|---|
| Rent | -10% $665 | -5% $714 | +0% $762 | +5% $811 | +10% $859 |
| Rate | -1.0pp $777 | -0.5pp $770 | base $762 | +0.5pp $754 | +1.0pp $746 |
UW: 25.0% down · 7.5% · 30yr · 1.5% tax · 5.0% vac · 8.0% maint · 8.0% mgmt
Financing live
Cash to close
- Down payment
- $7,500
- Closing costs
- $900
- Reserves months
- —
- Total cash needed
- —
Loan-product check · same deal, 3 products live
Conventional
25% down · 7.5% · 30yr
- Down + closing
- —
- Monthly P&I
- —
- Monthly cashflow
- —
- DSCR
- —
- Eligible?
- —
Personal DTI + credit; lowest rate.
DSCR
20% down · 8.5% · 30yr
- Down + closing
- —
- Monthly P&I
- —
- Monthly cashflow
- —
- DSCR
- —
- Eligible?
- —
No personal income docs; deal must DSCR.
Hard money
10% down · 12.0% · 12mo
- Down + closing
- —
- Monthly P&I
- —
- Monthly cashflow
- —
- DSCR
- —
- Eligible?
- —
Short-term bridge; refi at stabilization.
Rent comps 3 comps
| Address | Beds | Baths | Sqft | Rent | $/sqft | DOM | Units | Dist |
|---|---|---|---|---|---|---|---|---|
| 148 Maple St Jamestown, NY | 3.0 | 1.0 | 1424 | $1,350 | $0.95 | 45d | 1 | 0.55mi |
| 317 Fairmount Ave Unit G-1 Jamestown, NY | 2.0 | 2.0 | 1215 | $1,295 | $1.07 | 45d | 1 | 1.19mi |
| 21 Spring St Jamestown, NY | 2.0 | 1.0 | 1000 | $1,000 | $1.00 | 45d | 1 | 1.29mi |
Listing history 12 events
-
2026-06-21days on market $30,000 Active 16 DOM
-
2026-06-19days on market $30,000 Active 14 DOM
-
2026-06-18days on market $30,000 Active 13 DOM
-
2026-06-17days on market $30,000 Active 12 DOM
-
2026-06-16days on market $30,000 Active 11 DOM
-
2026-06-15days on market $30,000 Active 10 DOM
-
2026-06-14days on market $30,000 Active 8 DOM
-
2026-06-12days on market $30,000 Active 7 DOM
-
2026-06-09days on market $30,000 Active 4 DOM
-
2026-06-08days on market $30,000 Active 3 DOM
-
2026-06-07remarks 396-char remark
-
2026-06-07$30,000 Active 2 DOM
ⓘ Source: listings_history table (triggers on properties + properties_extension) + one-shot
backfill from property_details.listing_events for pre-trigger history.
Climate risk First Street
- Flood 1/10 Low 0% chance over 30 yrs
- Wildfire 1/10 Low
- Heat 2/10 Low 7 d/yr ≥91°F today · 17 d/yr by 30 yrs out
- Wind 1/10 Low
- Air quality 2/10 Low 0 unhealthy d/yr today · 1 by 30 yrs out
Nearby sold comps map
Loading sold comps map…
Walkable amenities ~0.75 mi
Loading nearby amenities…
Taxation est. · year 1
- Rental income
- $14,725
- − Mortgage interest
- −$1,680
- − Property taxes
- −$450
- − Insurance
- −$150
- − Repairs & maintenance
- −$1,178
- − Management
- −$1,178
- − Depreciation
- −$873
- Taxable income
- $9,216
- Est. tax owed @ 24.0%
- −$2,212
- After-tax cash flow
- $6,933/yr
For passive investors: Depreciation is non-cash, so a rental often shows a tax loss while cash-flowing — sheltering income. Rental losses are passive: they offset passive income freely, and up to $25,000/yr can offset ordinary (W-2) income if you actively participate and your MAGI is under $100k (phasing out to $0 by $150k); unused losses carry forward. On sale, claimed depreciation is recaptured at up to 25%, and gains may owe capital-gains tax (a 1031 exchange can defer both). Figures are a year-1 estimate at your 24.0% rate — not tax advice; consult a CPA.
Schools (NCES district)
- District
- Jamestown City School District
- NCES district ID
- 3615630
- Math proficiency
- 33% ▼ -3.00%
- Reading proficiency
- 42% ▲ 5.00%
- Median HH income
- $32,240
- Composite
- 30.69/100
- National rank
- #6176
- State rank
- #553 of 590 in NY
Livability — Jamestown
- Score
- 69/100
- State rank
- #470
- US rank
- #8213
Category grades
Schools grade is shown separately in the Schools card above.
Census & demographics
- Census place
- Jamestown, NY
- County
- Chautauqua County · 38,461 people
- City population
- 38,461
- Metro
- Jamestown-Dunkirk-Fredonia, NY
- Population (ZIP)
- 38,461
- Household income
- $49,685
- Rent vs Own
- Severe rent burden
- 1838.0
Population outlook (Chautauqua County) Hauer SSP2
- Today (2025)
- 123,454 people
- By 2030
- 118,509 · -4.0%
- By 2040
- 107,311 · -13.1%
- By 2050
- 96,703 · -21.7%
- By 2075
- 76,757 · -37.8%
- By 2100
- 60,984 · -50.6%
Race, ethnicity, and origin ACS 2023
- Neighborhood character
- Predominantly White (82%)
- Race & ethnicity
- White 82% Hispanic / Latino 11% Two or more races 6% Black 3%
- Hispanic origin (detail)
- Puerto Rican 8%
- Common ancestry
- Romanian 6% Lithuanian 2% Slovak 2%
- Foreign-born
- 3% · Canada
- Languages at home
- 92% English-only · Spanish 6% Other Indo-European 1% French/Haitian/Cajun 1%
Political lean MEDSL · Chautauqua
- 2024 margin
- Strong R (+22.0) · D 39.0% · R 61.0%
- 2008→2024 swing
- -22.9pp toward R · 2008: 0.9pp · 2024: -22.0pp
- All cycles
- 2024: R+22.0 2020: R+19.8 2016: R+24.6 2012: R+8.2 2008: D+0.9
Not yet ingested
- Civics
- —
Market trends
- HPI YoY
- ▼ -58.93%
- Current HPI
- 259.402
- Rent YoY
- —
- Metro
- Jamestown-Dunkirk-Fredonia, NY
- State GDP YoY
- ▲ 2.60%
- F500 in state
- 92
Industry mix (Fortune 500 HQ in NY)
| Industry | F500 HQs | Revenue |
|---|---|---|
| Financial Services | 10 | $950B |
|
||
| Consumer Goods | 9 | $162B |
|
||
| Insurance | 4 | $225B |
|
||
| Telecommunications | 2 | $144B |
|
||
| Pharmaceuticals | 2 | $112B |
|
||
| Media / Entertainment | 2 | $69B |
|
||
Price history
-17.8% since first listed16 events — show timeline
- 2026-06-05 Listed $30,000 UNYREIS
- 2024-03-11 Sold (MLS) $20,000 UNYREIS
- 2024-01-12 Pending — UNYREIS
- 2023-11-21 Pending — UNYREIS
- 2023-11-11 Price Changed $31,999 UNYREIS
- 2023-09-16 Listed $39,900 UNYREIS
- 2016-05-12 Listed $35,900 UNYREIS
- 2016-05-12 Listed $35,900 UNYREIS
- 2005-01-14 Sold (MLS) $15,600 UNYREIS
- 2005-01-07 Sold (Public Records) $15,600 Public Records
- 2004-09-13 Listed $19,900 UNYREIS
- 2004-06-14 Sold (Public Records) $28,268 Public Records
- 2003-07-08 Listed $34,900 UNYREIS
- 2001-04-12 Sold (MLS) $32,000 UNYREIS
- 2001-04-11 Sold (Public Records) $32,000 Public Records
- 2000-06-03 Listed $36,500 UNYREIS
Property tax history
-4.3%/yrLatest (2025): $1,946 · +4.8% YoY. Source: county tax records.
Cash-flow waterfall
monthlySold comps — $/sqft
last 12 mo · ≤1 miLoading sold comps…