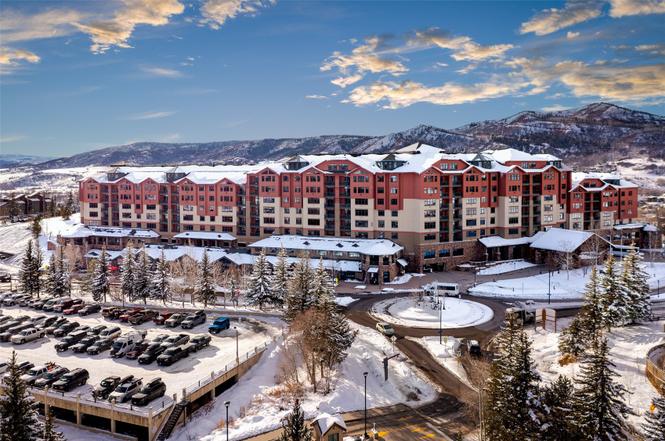
2300 Mount Werner Cir Unit 201/202 · Steamboat Springs, CO
Flood risk 1/10 · Minimal
- FEMA flood zone
- X (unshaded)
- Chance of flooding over 30 yrs
- 0.0%
- Est. flood insurance / yr
- $507 – $1,088
Fire risk 5/10 · Moderate
- Est. fire insurance / yr
- $939 – $1,743
Heat risk 2/10 · Minimal
- Hot days now (above 80°F)
- 8 days/yr
- Hot days in 30 yrs
- 22 days/yr
Wind risk 1/10 · Minimal
- Chance of severe wind over 30 yrs
- —
Air-quality risk 4/10 · Minor
- Unhealthy air days now
- 5 days/yr
- Unhealthy air days in 30 yrs
- 5 days/yr
Risk factors via First Street. Map © Google.
Why this score? — see what drove the B grade
The composite is a weighted blend of 9 inputs, each scored 0–100. Each bar is that input's sub-score; the figure is the points it added to the 100-point composite (weight × sub-score).
- Cash flow +27.3/30.0
- 1% rule +10.0/10.0
- DSCR +9.5/10.0
- ARV discount +7.5/15.0
- Schools +5.3/10.0
- Rent growth +5.0/5.0
- Livability +3.7/5.0
- Condition / age +2.5/5.0
- Appreciation +0.0/10.0
$165,000
🖨 Deal sheet 📄 Offer letter ✓ Due diligence
Listing remarks
No stairs, no elevator — just easy access at The Steamboat Grand. This 1/8 fractional ownership gives you 6–7 weeks per year in the heart of the Steamboat Ski Resort base area. The popular Alpenglow floor plan includes two units with a lock-off setup, offering 2 bedrooms and 3 bathrooms. The layout features one king bed, two queen beds, and daybeds in the main living area for extra sleeping space for guests. Located at the end of the hall on the first level, you can walk right out the door, across the street to the owner’s ski storage, and on to the gondola. Owners enjoy full access to The Grand’s amenities, including the heated pool, hot tubs, fitness center, sauna,
Key facts
- Fitness center
- Lock-off setup
- Sauna
Tags
Property features AI
Finance
- Other: On-site management, elevators, and reception area in the building
- Financial info: Association fee: $8,067 annually (approximately $672.25/month)
- HOA & community: Homeowners association with fitness center; Annual association fee
Exterior
- Parking: Underground community garage; 1 garage space
- Utilities: Public water; Public sewer; Cable available; Electricity available; Natural gas available; Water available; Sewer available
- Home design: Residential timeshare; Planned Unit Development zoning
- Construction: Concrete, wood siding, and steel siding construction; Composition roof
- Exterior features: Community pool; Storage; Near public transit; Paved road access; Has a view
Interior
- Kitchen: Dishwasher; Electric range; Microwave; Refrigerator
- Flooring: Concrete; Tile
- Bathrooms: 3 full bathrooms
- Heating & cooling: Forced air heating (natural gas); Cooling system
- Interior features: Furnished; Gas fireplace
- Laundry & utility: Common area laundry room
Neighborhood map
What this means for you Summary
Snapshot
- This is a 2-bed/3.0-bath timeshare listed at $165k.
Deal economics
- At list price, monthly cash flow is $478 ($6k/yr) — positive.
- The deal already cash-flows at list — no discount required.
- Meets the 1% rule at list price ($3k rent vs $165k).
- Recommended offer: $150k (9.0% below list) — sets the bar for market timing.
- Cap rate 9.8% vs local median 0.1% in Steamboat Springs — top-decile yield for the area; either an underpriced asset or a hidden risk that comps aren't pricing in. Stress-test before assuming the spread holds.
Location & tenants
- Location reads 74/100 on livability (#41 in CO, #4,975 nationally) — a middle-class / working-renter tenant base. Strengths: commute A+, employment A+, schools B; Watch: health & safety C-, amenities D, cost of living F.
- Steamboat Springs School District No. RE-2 (town): math 49% / reading 72% proficiency, ranked #4 of 86 in CO (top 5%) — acceptable for families but not a draw, mixed tenant base, ~2y average lease; only 12% free/reduced lunch — higher-income household profile.
- Market conditions: Rents rising fast (+10.6%/yr); 555 active listings in the ZIP; solid renter incomes; 597 units permitted in Routt County in 2024 (418 in 5+ unit buildings).
- This rent runs 32% of the median local income ($110k/yr) — at the standard rent-burdened threshold; future hikes will face affordability resistance.
Forward outlook
- Local home prices are declining (-3.0%/yr); year-one equity from $1k of loan paydown is wiped out by about $5k of value loss. Plan a longer hold.
- Routt County population projected at +18% by 2050 — long-run rental-demand tailwind backs the buy-and-hold thesis.
- At projected returns (-3.0% appreciation + 8.0% rent growth), your $46k cash investment doubles in ~6 years — after that, you're playing with house money.
Negotiation context
- It's been on market 120 days — a 9% lower offer ($150k) is reasonable based on typical stale-listing flexibility.
- 2 sale attempts since 17y ago with the ask held roughly flat each time — persistent listings suggest the price (not the market) is what's stuck; bring a comps-based counter.
Risks & watch-outs
- Watch-outs: HOA is 23% of rent.
- Climate carrying-cost: moderate wildfire risk — expect insurance premiums to compound above CPI over the hold.
Questions for the listing agent
- It's been on market 120 days. Have you received any prior offers? Is the seller open to a 9% concession, seller financing, or rate buy-down credit?
- What does the HOA fee cover, when was the last increase, and are there any pending special assessments or reserve-fund shortfalls?
- Why hasn't it sold? Are there any deal-killer items the seller is aware of (foundation, flood, title, zoning, code violations)?
- Is there a deadline driving the sale (1031 exchange, divorce, estate, relocation)? That informs how much negotiation room exists.
- Schools are B-rated — typically a magnet for longer-tenancy family renters. What's the average tenant stay here, and is there a school-zone premium baked into asking?
- What's the average days-on-market for RENTAL listings here right now (not sales)? A rising rental-DOM trend means longer vacancies and softer asking-rent achievability than the comps imply.
- What's the recent tenant-quality profile in this submarket — average credit score on applications, eviction rate, late-payment / NSF rate, and stable-employment percentage? A property-management company in the area should have these aggregated.
- How much new for-sale + rental construction is in the pipeline within 1–3 miles? Heavy new supply typically softens prices + rents 12–24 months out; constrained supply supports both.
Investment metrics
- 1% rule
- 1.76% ✓
- Cap rate
- 9.77%
- Cash-on-cash
- 12.42%
- DSCR
- 1.55
- GRM
- 4.7
CMA / ARV
No comps found within radius.
Projected returns pro-forma
-3.0% appreciation · 8.0% rent growth · sell at horizon
- IRR
- 9.9%
- Equity multiple
- 1.42×
- Total profit
- $19,509
- Equity at exit
- $24,602
- IRR
- 24.0%
- Equity multiple
- 3.77×
- Total profit
- $127,816
- Equity at exit
- $14,266
Cash invested: $46,200 (down + closing). Projections, not guarantees.
Landlord ↔ Tenant lean methodology
- Overall (STATE)
- 38 Tenant-Leaning
- State Colorado
- 38 Tenant-Leaning · D+4
- County
- — inherits STATE
- City
- — inherits STATE
ZIP-level market 80487
- Rents YoY
- 10.6%
- Active inventory
- 555
- Price-to-rent
- 4.7×
Monthly cashflow live
- Estimated rent
- $2,900 medium interval (Pro) →
- Mortgage (P&I)
- −$865
- Tax est. 1.5%
- −$206 /mo · $2,475/yr
- Insurance
- −$69
- HOA
- −$672
- Vacancy / Maint / Mgmt
- −$609
- Net cashflow
- $478
Break-even live
UW: 25.0% down · 7.5% · 30yr · 1.5% tax · 5.0% vac · 8.0% maint · 8.0% mgmt
Financing live
Cash to close
- Down payment
- $41,250
- Closing costs
- $4,950
- Reserves months
- —
- Total cash needed
- —
Loan-product check · same deal, 3 products live
Conventional
25% down · 7.5% · 30yr
- Down + closing
- —
- Monthly P&I
- —
- Monthly cashflow
- —
- DSCR
- —
- Eligible?
- —
Personal DTI + credit; lowest rate.
DSCR
20% down · 8.5% · 30yr
- Down + closing
- —
- Monthly P&I
- —
- Monthly cashflow
- —
- DSCR
- —
- Eligible?
- —
No personal income docs; deal must DSCR.
Hard money
10% down · 12.0% · 12mo
- Down + closing
- —
- Monthly P&I
- —
- Monthly cashflow
- —
- DSCR
- —
- Eligible?
- —
Short-term bridge; refi at stabilization.
HOA detail
- Monthly dues
- $672 · $8,064/yr
- Likely covers
- poolgym
Listing history 19 events
-
2026-06-19days on market $165,000 Active 120 DOM
-
2026-06-18days on market $165,000 Active 119 DOM
-
2026-06-17days on market $165,000 Active 118 DOM
-
2026-06-16days on market $165,000 Active 117 DOM
-
2026-06-15days on market $165,000 Active 116 DOM
-
2026-06-14days on market $165,000 Active 114 DOM
-
2026-06-12days on market $165,000 Active 113 DOM
-
2026-06-09days on market $165,000 Active 110 DOM
-
2026-06-08days on market $165,000 Active 109 DOM
-
2026-06-07days on market $165,000 Active 108 DOM
-
2026-06-07days on market $165,000 Active 107 DOM
-
2026-06-04days on market $165,000 Active 104 DOM
-
2026-06-02days on market $165,000 Active 103 DOM
-
2026-06-01days on market $165,000 Active 102 DOM
-
2026-05-31days on market $165,000 Active 101 DOM
-
2026-05-31days on market $165,000 Active 100 DOM
-
2026-02-19$170,000 Active
-
2010-05-02historical
-
2009-12-15$82,500
ⓘ Source: listings_history table (triggers on properties + properties_extension) + one-shot
backfill from property_details.listing_events for pre-trigger history.
Climate risk First Street
- Flood 1/10 Low FEMA zone X (unshaded) · 0% chance over 30 yrs
- Wildfire 5/10 Major
- Heat 2/10 Low 8 d/yr ≥80°F today · 22 d/yr by 30 yrs out
- Wind 1/10 Low
- Air quality 4/10 Moderate 5 unhealthy d/yr today · 5 by 30 yrs out
Nearby sold comps map
Loading sold comps map…
Walkable amenities ~0.75 mi
Loading nearby amenities…
Taxation est. · year 1
- Rental income
- $34,794
- − Mortgage interest
- −$9,243
- − Property taxes
- −$2,475
- − Insurance
- −$825
- − Repairs & maintenance
- −$2,784
- − Management
- −$2,784
- − HOA
- −$8,064
- − Depreciation
- −$4,800
- Taxable income
- $3,821
- Est. tax owed @ 24.0%
- −$917
- After-tax cash flow
- $4,823/yr
For passive investors: Depreciation is non-cash, so a rental often shows a tax loss while cash-flowing — sheltering income. Rental losses are passive: they offset passive income freely, and up to $25,000/yr can offset ordinary (W-2) income if you actively participate and your MAGI is under $100k (phasing out to $0 by $150k); unused losses carry forward. On sale, claimed depreciation is recaptured at up to 25%, and gains may owe capital-gains tax (a 1031 exchange can defer both). Figures are a year-1 estimate at your 24.0% rate — not tax advice; consult a CPA.
Schools (NCES district)
- District
- Steamboat Springs School District No. RE-2
- NCES district ID
- 0806660
- Math proficiency
- 49% ▼ -9.00%
- Reading proficiency
- 72% ▲ 1.00%
- Median HH income
- $67,833
- Composite
- 53.1/100
- National rank
- #1513
- State rank
- #4 of 86 in CO
Livability — Steamboat Springs
- Score
- 74/100
- State rank
- #41
- US rank
- #4975
Category grades
Schools grade is shown separately in the Schools card above.
Census & demographics
- Census place
- Steamboat Springs, CO
- County
- Routt County · 18,525 people
- City population
- 18,525
- Metro
- Steamboat Springs, CO
- Population (ZIP)
- 18,525
- Household income
- $109,659
- Rent vs Own
- Severe rent burden
- 644.0
Population outlook (Routt County) Hauer SSP2
- Today (2025)
- 27,283 people
- By 2030
- 28,555 · +4.7%
- By 2040
- 30,578 · +12.1%
- By 2050
- 32,328 · +18.5%
- By 2075
- 36,897 · +35.2%
- By 2100
- 38,794 · +42.2%
Race, ethnicity, and origin ACS 2023
- Neighborhood character
- Predominantly White (80%)
- Race & ethnicity
- White 80% Two or more races 12% Hispanic / Latino 9%
- Hispanic origin (detail)
- Mexican 6%
- Common ancestry
- Romanian 5% Slovak 3% Lithuanian 3%
- Foreign-born
- 7% · Canada
- Languages at home
- 92% English-only · Spanish 6% Other Indo-European 1% French/Haitian/Cajun 1%
Political lean MEDSL · Routt
- 2024 margin
- Strong D (+27.7) · D 62.5% · R 34.8% · Other 2.8%
- 2008→2024 swing
- +0.9pp no change · 2008: 26.9pp · 2024: 27.7pp
- All cycles
- 2024: D+27.7 2020: D+27.6 2016: D+17.0 2012: D+15.6 2008: D+26.9
Not yet ingested
- Civics
- —
Market trends
- HPI YoY
- ▼ -342.73%
- Current HPI
- 471.8844
- Rent YoY
- ▲ 10.61%
- Metro
- Steamboat Springs, CO
- State GDP YoY
- ▲ 1.95%
- F500 in state
- 14
Industry mix (Fortune 500 HQ in CO)
| Industry | F500 HQs | Revenue |
|---|---|---|
| Technology Distribution | 1 | $31B |
|
||
| Food / Agriculture | 1 | $18B |
|
||
| Packaging | 1 | $14B |
|
||
| Healthcare | 1 | $13B |
|
||
| Energy | 1 | $10B |
|
||
| Technology | 1 | $4B |
|
||
Price history
+106.1% since first listed3 events — show timeline
- 2026-02-19 Listed $170,000 SAR
- 2010-05-02 Listing Removed — REColorado as Distributed by MLS Grid
- 2009-12-15 Listed $82,500 REColorado as Distributed by MLS Grid
Cash-flow waterfall
monthlySold comps — $/sqft
last 12 mo · ≤1 miLoading sold comps…