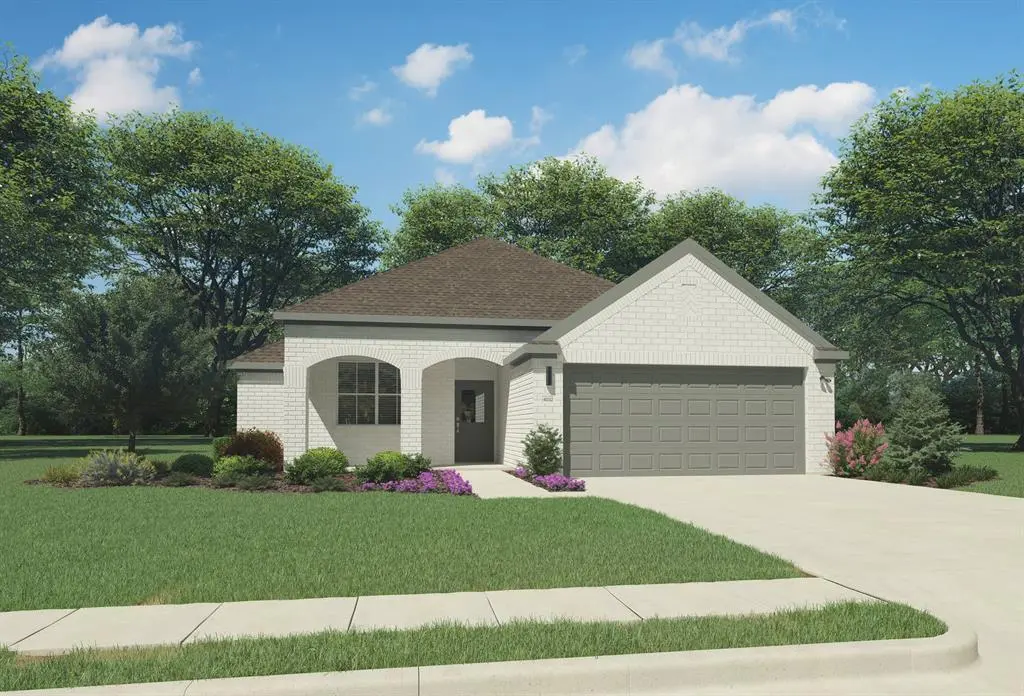
732 Brightstar Dr · Fort Worth, TX
Flood risk No data
- FEMA flood zone
- —
- Chance of flooding over 30 yrs
- —
- Est. flood insurance / yr
- —
Fire risk No data
- Est. fire insurance / yr
- —
Heat risk No data
- Hot days now (above threshold)
- —
- Hot days in 30 yrs
- —
Wind risk No data
- Chance of severe wind over 30 yrs
- —
Air-quality risk No data
- Unhealthy air days now
- —
- Unhealthy air days in 30 yrs
- —
Risk factors via First Street. Map © Google.
Why this score? — see what drove the D grade
The composite is a weighted blend of 9 inputs, each scored 0–100. Each bar is that input's sub-score; the figure is the points it added to the 100-point composite (weight × sub-score).
- Cash flow +10.0/30.0
- ARV discount +7.8/15.0
- Schools +6.2/10.0
- Livability +4.0/5.0
- Condition / age +4.0/5.0
- Rent growth +3.5/5.0
- 1% rule +3.3/10.0
- DSCR +2.8/10.0
- Appreciation +0.0/10.0
$375,990
🖨 Deal sheet (PDF) 📄 Offer letter ✓ Due diligence
Listing remarks MLS
The Emmy II boasts an expansive main living area with a gourmet island kitchen, beautiful living room and snug dining area. The addition of a covered patio amplifies your entertaining space, so be sure to add a bistro table and chairs for morning cappuccino al fresco with neighbors. Three secondary bedrooms offer private space but can flex into the ultimate hobby room, yoga spot or home office!
Key facts
- Hobby room
- Covered patio
- Private space
Tags
Property features AI
Finance
- Other: Community features include curbs, jogging/bike path, park, playground, and sidewalks
- Financial info: No second mortgage; Loan type: Treat as clear
- HOA & community: Mandatory HOA (Morningstar); HOA managed by Prestige Star Management; HOA covers full use of facilities and grounds maintenance; HOA fee $265 quarterly
Exterior
- Parking: Attached 2-car garage with garage door opener; 2 covered parking spaces
- Security: Smoke detectors; Carbon monoxide detector(s); Prewired for security
- Utilities: Municipal utility district; Curbs; Water-conserving features: low-flow fixtures, efficient hot water distribution, water-smart landscaping; Energy-efficient features: appliances, HVAC, insulation, lighting
- Home design: Single-family residence; One story; New construction (incomplete); Smart home features included; Subdivision: Morningstar; Facing direction not specified
- Construction: Brick, rock/stone, and siding exterior; Composition roof; Slab foundation; Year built: 2025
- Exterior features: Covered porch(es); Covered patio/porch; Gutters; Exterior lighting; Private yard; Back yard fencing (wood)
Interior
- Kitchen: Dishwasher; Disposal; Electric oven; Gas cooktop; Microwave; Pantry
- Bedrooms: 4 bedrooms (all on the main level); Primary bedroom on main level
- Flooring: Carpet; Laminate; Tile
- Bathrooms: 2 full bathrooms
- Heating & cooling: Central heating; Central air; Ceiling fans
- Interior features: Open floorplan; Vaulted ceilings; Pantry; Decorative lighting; Cable TV available; High-speed internet available; Prewired; Walk-in closets
- Laundry & utility: Full-size washer/dryer area; Washer hookup; Electric dryer hookup; Utility room; Tankless water heater
Neighborhood map
What this means for you Summary
Snapshot
- This is a 4-bed/2.0-bath single-family listed at $376k. Condition is rated good.
Deal economics
- At list price, monthly cash flow is $-230 ($-3k/yr) — negative.
- To cash-flow at today's rent, offer at most $343k (8.8% below list).
- To meet the 1% rule (rent ≥ 1% of price), the offer needs to be $311k (17.3% below list).
- Recommended offer: $311k (17.3% below list) — sets the bar for 1% rule.
- Cap rate 5.6% vs local median 3.9% in Fort Worth — top-decile yield for the area; either an underpriced asset or a hidden risk that comps aren't pricing in. Stress-test before assuming the spread holds.
Location & tenants
- Location reads 80/100 on livability (#49 in TX, #1,954 nationally) — a professional / high-income tenant draw. Strengths: amenities A+, cost of living A+, housing A+; Watch: crime F.
- Aledo ISD (rural): math 66% / reading 68% proficiency, ranked #11 of 826 in TX (top 1%) — acceptable for families but not a draw, mixed tenant base, ~2y average lease; only 14% free/reduced lunch — higher-income household profile.
- Zoned schools: Annetta El (784 students, 20% FRL); Aledo Middle (math 69% / reading 72%, grade A, #57 of 1,662 statewide, top 3%, 944 students, 11% FRL); Aledo H S (math 87% / reading 50%, grade B, #147 of 1,632 statewide, top 9%, 1,622 students, 14% FRL) — zoned schools at 15% FRL track the district average.
- Market conditions: Rents rising (+3.8%/yr); 825 active listings in the ZIP; 2 comparable units currently listed for rent nearby; high-income renter base; 437 units permitted in Parker County in 2024 (0 in 5+ unit buildings).
Forward outlook
- Local home prices are declining (-3.0%/yr); year-one equity from $3k of loan paydown is wiped out by about $11k of value loss. Plan a longer hold.
- Parker County population projected at +32% by 2050 — long-run rental-demand tailwind backs the buy-and-hold thesis.
Negotiation context
- It's been on market 41 days — a 3% lower offer ($365k) is reasonable based on typical stale-listing flexibility.
- 2 sale attempts with the ask held roughly flat each time — persistent listings suggest the price (not the market) is what's stuck; bring a comps-based counter.
Questions for the listing agent
- What do current leases actually rent for vs. the listed asking? Can we see a recent rent roll and the last 12 months of T-12 income?
- It's been on market 41 days. Have you received any prior offers? Is the seller open to a 17% concession, seller financing, or rate buy-down credit?
- What does the HOA fee cover, when was the last increase, and are there any pending special assessments or reserve-fund shortfalls?
- Is there a deadline driving the sale (1031 exchange, divorce, estate, relocation)? That informs how much negotiation room exists.
- Schools are D-rated, which usually means shorter tenancies and higher turnover. Who's the typical renter profile here, and what's been the actual vacancy rate?
- Crime grade is F in this area — have there been break-ins, vandalism, or insurance claims at this property in the last 3 years? What carrier currently insures it and at what premium?
- The area grade is low — what's the realistic commute time and amenity access for the typical tenant pool here? Any planned neighborhood developments (good or bad) we should know about?
- What's the average days-on-market for RENTAL listings here right now (not sales)? A rising rental-DOM trend means longer vacancies and softer asking-rent achievability than the comps imply.
- What's the recent tenant-quality profile in this submarket — average credit score on applications, eviction rate, late-payment / NSF rate, and stable-employment percentage? A property-management company in the area should have these aggregated.
- How much new for-sale + rental construction is in the pipeline within 1–3 miles? Heavy new supply typically softens prices + rents 12–24 months out; constrained supply supports both.
Investment metrics
- 1% rule
- 0.83% ✗
- Cap rate
- 5.56%
- Cash-on-cash
- -2.62%
- DSCR
- 0.88
- GRM
- 10.1
CMA / ARV
- ARV (median comp)
- $378,415
- List price
- $375,990
- Delta
- -0.64%
- Verdict
- FAIR
- Comps
- 20 within 1.0 mi
Show comp detail 12 sales within ~0.75 mi
| Address | Dist | Beds/Ba | Sqft | Sold | Price | $/sf | Match |
|---|---|---|---|---|---|---|---|
| 717 Bushman Dr | 0.08mi | 4/2.0 | 1,834 (+1%) | 1mo | $364,585 | $199 | 94 |
| 15153 Ram Rock Dr | 0.10mi | 4/2.0 | 1,834 (+1%) | 0mo | $367,085 | $200 | 93 |
| 15216 Supreme St | 0.12mi | 4/2.0 | 1,818 (0%) | 2mo | $364,990 | $201 | 92 |
| 15053 Green Bluff Dr | 0.21mi | 3/2.0 (-1) | 1,860 (+2%) | 2mo | $409,900 | $220 | 79 |
| 15041 Green Bluff Dr | 0.23mi | 4/2.0 | 1,939 (+7%) | 2mo | $439,900 | $227 | 77 |
| 712 Bushman Dr | 0.06mi | 4/2.5 | 2,035 (+12%) | 1mo | $382,185 | $188 | 75 |
| 15149 Ram Rock Dr | 0.10mi | 4/2.5 | 2,035 (+12%) | 0mo | $380,385 | $187 | 73 |
| 15213 Supreme St | 0.12mi | 3/2.0 (-1) | 2,002 (+10%) | 2mo | $389,990 | $195 | 71 |
| 14841 Gladstone Dr | 0.47mi | 3/2.0 (-1) | 1,876 (+3%) | 0mo | $364,900 | $195 | 68 |
| 14829 Complacent Way | 0.60mi | 3/2.0 (-1) | 1,816 (-0%) | 0mo | $359,000 | $198 | 66 |
| 441 Pickett Creek Dr | 0.25mi | 3/2.0 (-1) | 1,998 (+10%) | 2mo | $417,900 | $209 | 65 |
| 14824 Complacent Way | 0.58mi | 3/2.0 (-1) | 1,853 (+2%) | 0mo | $349,900 | $189 | 65 |
Match score weights: distance 35% · size 25% · config 20% · recency 20%. Top-matched comps best support the ARV.
Projected returns pro-forma
-3.0% appreciation · 3.82% rent growth · sell at horizon
- IRR
- -19.7%
- Equity multiple
- 0.31×
- Total profit
- $-72,877
- Equity at exit
- $56,061
- IRR
- -10.8%
- Equity multiple
- 0.32×
- Total profit
- $-71,107
- Equity at exit
- $32,509
Cash invested: $105,277 (down + closing). Projections, not guarantees.
Landlord ↔ Tenant lean methodology
- Overall (STATE)
- 87 Strongly Landlord-Friendly
- State Texas
- 87 Strongly Landlord-Friendly · R+5
- County
- — inherits STATE
- City
- — inherits STATE
ZIP-level market 76008
- Home prices YoY
- -16.5%
- Rents YoY
- 3.8%
- Active inventory
- 825
- Price-to-rent
- 10.1×
Monthly cashflow live
- Estimated rent
- $3,110 medium interval (Pro) →
- Mortgage (P&I)
- −$1,972
- Tax est. 1.5%
- −$470 /mo · $5,640/yr
- Insurance
- −$157
- HOA
- −$88
- Vacancy / Maint / Mgmt
- −$653
- Net cashflow
- $-230
Break-even live
Sensitivity live
| Price | -10% $30 | -5% $-100 | +0% $-230 | +5% $-360 | +10% $-490 |
|---|---|---|---|---|---|
| Rent | -10% $-475 | -5% $-353 | +0% $-230 | +5% $-107 | +10% $16 |
| Rate | -1.0pp $-40 | -0.5pp $-134 | base $-230 | +0.5pp $-327 | +1.0pp $-426 |
UW: 25.0% down · 7.5% · 30yr · 1.5% tax · 5.0% vac · 8.0% maint · 8.0% mgmt
Financing live
Cash to close
- Down payment
- $93,998
- Closing costs
- $11,280
- Reserves months
- —
- Total cash needed
- —
Loan-product check · same deal, 3 products live
Conventional
25% down · 7.5% · 30yr
- Down + closing
- —
- Monthly P&I
- —
- Monthly cashflow
- —
- DSCR
- —
- Eligible?
- —
Personal DTI + credit; lowest rate.
DSCR
20% down · 8.5% · 30yr
- Down + closing
- —
- Monthly P&I
- —
- Monthly cashflow
- —
- DSCR
- —
- Eligible?
- —
No personal income docs; deal must DSCR.
Hard money
10% down · 12.0% · 12mo
- Down + closing
- —
- Monthly P&I
- —
- Monthly cashflow
- —
- DSCR
- —
- Eligible?
- —
Short-term bridge; refi at stabilization.
Rent comps 2 comps
| Address | Beds | Baths | Sqft | Rent | $/sqft | DOM | Units | Dist |
|---|---|---|---|---|---|---|---|---|
| 15049 Chipwood Dr Aledo, TX | 3.0 | 3.0 | 2337 | $3,500 | $1.50 | 45d | 1 | 0.88mi |
| 616 Ardath Dr Aledo, TX | 3.0 | 2.0 | 2050 | $2,850 | $1.39 | 14d | 1 | 1.00mi |
HOA detail
- Monthly dues
- $88 · $1,056/yr
Listing history 16 events
-
2026-06-21days on market $375,990 Active 41 DOM
-
2026-06-18days on market $375,990 Active 38 DOM
-
2026-06-17days on market $375,990 Active 37 DOM
-
2026-06-16days on market $375,990 Active 36 DOM
-
2026-06-15days on market $375,990 Active 35 DOM
-
2026-06-13days on market $375,990 Active 33 DOM
-
2026-06-09days on market $375,990 Active 29 DOM
-
2026-06-08days on market $375,990 Active 28 DOM
-
2026-06-07days on market $375,990 Active 27 DOM
-
2026-06-04days on market $375,990 Active 24 DOM
-
2026-06-03days on market $375,990 Active 23 DOM
-
2026-06-02days on market $375,990 Active 22 DOM
-
2026-06-01days on market $375,990 Active 21 DOM
-
2026-05-31days on market $375,990 Active 20 DOM
-
2026-05-11$375,990 Active 470-char remark
-
2026-05-08$375,990 Active 397-char remark
Show marketing remark (397 chars)
The Emmy II boasts an expansive main living area with a gourmet island kitchen, beautiful living room and snug dining area. The addition of a covered patio amplifies your entertaining space, so be sure to add a bistro table and chairs for morning cappuccino al fresco with neighbors. Three secondary bedrooms offer private space but can flex into the ultimate hobby room, yoga spot or home office!
ⓘ Source: listings_history table (triggers on properties + properties_extension) + one-shot
backfill from property_details.listing_events for pre-trigger history.
Nearby sold comps map
Loading sold comps map…
Walkable amenities ~0.75 mi
Loading nearby amenities…
Taxation est. · year 1
- Rental income
- $37,315
- − Mortgage interest
- −$21,061
- − Property taxes
- −$5,640
- − Insurance
- −$1,880
- − Repairs & maintenance
- −$2,985
- − Management
- −$2,985
- − HOA
- −$1,056
- − Depreciation
- −$10,938
- Taxable loss
- −$9,231
- Est. tax savings @ 24.0%
- +$2,215
- After-tax cash flow
- $-543/yr
For passive investors: Depreciation is non-cash, so a rental often shows a tax loss while cash-flowing — sheltering income. Rental losses are passive: they offset passive income freely, and up to $25,000/yr can offset ordinary (W-2) income if you actively participate and your MAGI is under $100k (phasing out to $0 by $150k); unused losses carry forward. On sale, claimed depreciation is recaptured at up to 25%, and gains may owe capital-gains tax (a 1031 exchange can defer both). Figures are a year-1 estimate at your 24.0% rate — not tax advice; consult a CPA.
Condition & rehab AI · 30 photos
This home is in excellent condition with modern finishes and a well-maintained exterior. It offers a good balance of style and functionality, making it an attractive option for both buyers and renters.
Value-add opportunities
- Both Painting the exterior and interior walls — Fresh paint can enhance curb appeal and interior aesthetics.
- Both Adding a smart home system — Modern technology can increase both resale and rental value.
- Resale Upgrading the flooring in the bathrooms — High-quality flooring can significantly boost the home's appeal to potential buyers.
- Rental Installing smart lighting in the kitchen and bathrooms — Smart lighting can make the home more energy-efficient and appealing to renters looking for modern amenities.
Renovation cost estimate screening
Value-add ROI direction
- Both Painting the exterior and interior walls — Fresh paint can enhance curb appeal and interior aesthetics. ↑
- Both Adding a smart home system — Modern technology can increase both resale and rental value. ↑
- Resale Upgrading the flooring in the bathrooms — High-quality flooring can significantly boost the home's appeal to potential buyers. ↑
- Rental Installing smart lighting in the kitchen and bathrooms — Smart lighting can make the home more energy-efficient and appealing to renters looking for modern amenities. ↑
ⓘ Cost ranges are severity-bucket heuristics (US national rule-of-thumb). Get contractor quotes + a written scope before underwriting a rehab budget.
Schools (NCES district)
- District
- Aledo ISD
- NCES district ID
- 4807780
- Math proficiency
- 66% ▼ -8.00%
- Reading proficiency
- 68% ▼ -2.00%
- Median HH income
- $102,936
- Composite
- 61.94/100
- National rank
- #725
- State rank
- #11 of 826 in TX
Livability — Fort Worth
- Score
- 80/100
- State rank
- #49
- US rank
- #1954
Category grades
Schools grade is shown separately in the Schools card above.
Census & demographics
- County
- Parker County · 144,797 people
- City population
- 911,619
- Metro
- Dallas-Fort Worth-Arlington, TX
- Population (ZIP)
- 25,165
- Household income
- $168,314
- Rent vs Own
- Severe rent burden
- 27.0
Population outlook (Parker County) Hauer SSP2
- Today (2025)
- 147,426 people
- By 2030
- 157,863 · +7.1%
- By 2040
- 177,519 · +20.4%
- By 2050
- 194,786 · +32.1%
- By 2075
- 238,799 · +62.0%
- By 2100
- 264,126 · +79.2%
Race, ethnicity, and origin ACS 2023
- Neighborhood character
- Predominantly White (83%)
- Race & ethnicity
- White 83% Hispanic / Latino 12% Two or more races 7%
- Hispanic origin (detail)
- Mexican 10%
- Common ancestry
- Lithuanian 3% Slovak 3% Italian 3%
- Foreign-born
- 2% · Canada
- Languages at home
- 93% English-only · Spanish 5% German/W. Germanic 1%
Political lean MEDSL · Parker
- 2024 margin
- Solid R (+66.4) · D 16.4% · R 82.8%
- 2008→2024 swing
- -11.2pp toward R · 2008: -55.2pp · 2024: -66.4pp
- All cycles
- 2024: R+66.4 2020: R+64.4 2016: R+67.5 2012: R+65.8 2008: R+55.2
Not yet ingested
- Civics
- —
Market trends
- HPI YoY
- ▼ -48.05%
- Current HPI
- 242.9582
- Rent YoY
- ▲ 3.82%
- Metro
- Dallas-Fort Worth-Arlington, TX
- State GDP YoY
- ▲ 3.95%
- F500 in state
- 110
Industry mix (Fortune 500 HQ in TX)
| Industry | F500 HQs | Revenue |
|---|---|---|
| Energy | 16 | $1,198B |
|
||
| Technology | 5 | $198B |
|
||
| Engineering / Construction | 4 | $72B |
|
||
| Energy Services | 3 | $60B |
|
||
| Utilities | 3 | $41B |
|
||
| Healthcare | 2 | $330B |
|
||
Price history
+0.0% since first listed2 events — show timeline
- 2026-05-11 Listed $375,990 NTREIS
- 2026-05-08 Listed $375,990 Zillow
Cash-flow waterfall
monthlySold comps — $/sqft
last 12 mo · ≤1 miLoading sold comps…