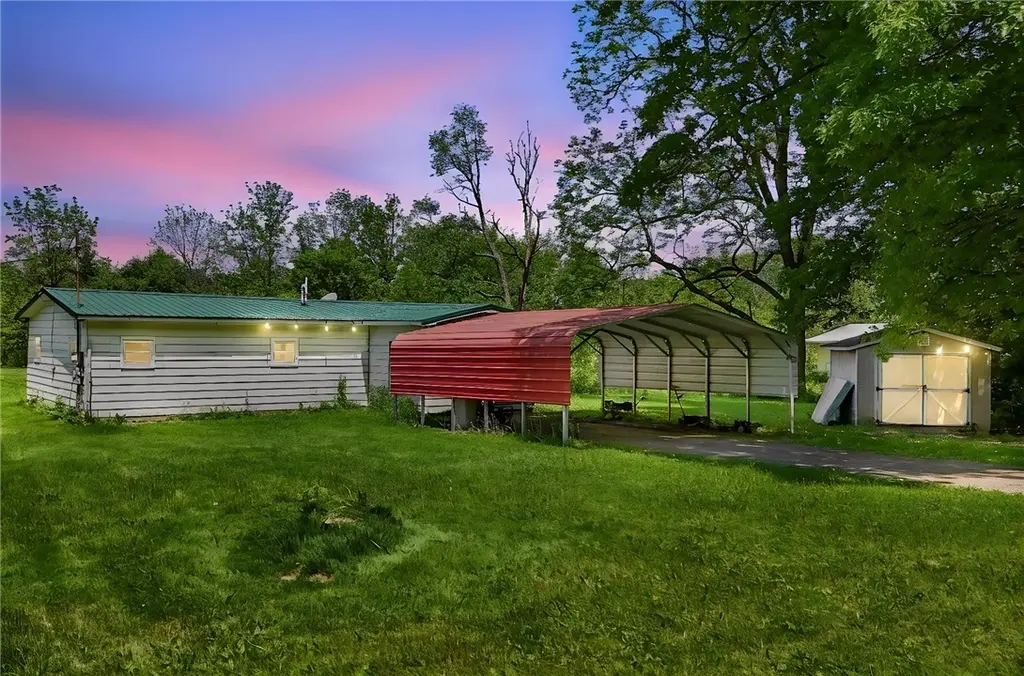
54 Dublin Rd · South Lansing, NY
Flood risk 1/10 · Minimal
- FEMA flood zone
- X
- Chance of flooding over 30 yrs
- 0.0%
- Est. flood insurance / yr
- $473 – $860
Fire risk 3/10 · Minor
- Est. fire insurance / yr
- $691 – $1,283
Heat risk 2/10 · Minimal
- Hot days now (above 95°F)
- 6 days/yr
- Hot days in 30 yrs
- 12 days/yr
Wind risk 2/10 · Minimal
- Chance of severe wind over 30 yrs
- 1.0%
Air-quality risk 2/10 · Minimal
- Unhealthy air days now
- 0 days/yr
- Unhealthy air days in 30 yrs
- 1 days/yr
Risk factors via First Street. Map © Google.
Why this score? — see what drove the B grade
The composite is a weighted blend of 9 inputs, each scored 0–100. Each bar is that input's sub-score; the figure is the points it added to the 100-point composite (weight × sub-score).
- Cash flow +30.0/30.0
- 1% rule +10.0/10.0
- DSCR +10.0/10.0
- ARV discount +7.5/15.0
- Schools +5.1/10.0
- Rent growth +2.5/5.0
- Livability +2.5/5.0
- Condition / age +2.5/5.0
- Appreciation +0.0/10.0
$79,000
🖨 Deal sheet 📄 Offer letter ✓ Due diligence
Listing remarks
Affordable, practical, and well-positioned, this property offers the convenience of one-level living, usable outdoor space, and a location that balances peaceful country living with easy access to area amenities. Set on nearly an acre, you'll enjoy a rural setting while remaining just minutes from Lansing, Myers Park, and Cayuga Lake, with Cornell University and Downtown Ithaca only a short drive away. A functional floor plan provides comfortable living spaces, three bedrooms, and plenty of natural light throughout. Situated on a block foundation, the home has benefited from several improvements over the years, including an updated windows, roof and mechanical system, offering added peace o
Key facts
- Updated windows
- One-level living
- Usable outdoor space
Tags
Property features AI
Exterior
- Parking: 2-car garage; Carport; Gravel driveway
- Utilities: Well water; Septic tank; Propane service
- Home design: One-story double wide mobile home; Residential property
- Construction: Aluminum siding; Block and slab foundation
- Exterior features: Metal roof; Rectangular lot; Other lot features (see remarks)
Interior
- Kitchen: Electric oven and range; Dishwasher; Refrigerator
- Bedrooms: 3 bedrooms on the main level
- Flooring: Carpet; Vinyl; Varied flooring
- Bathrooms: 1 full bathroom on the main level
- Heating & cooling: Propane forced air heating
- Interior features: 8 total rooms; Crawl space basement
- Laundry & utility: Main level laundry room; Washer and dryer; Electric water heater
Neighborhood map
What this means for you Summary
Snapshot
- This is a 3-bed/2.0-bath manufactured listed at $79k.
Deal economics
- At list price, monthly cash flow is $1k ($14k/yr) — positive.
- The deal already cash-flows at list — no discount required.
- Meets the 1% rule at list price ($2k rent vs $79k).
- Recommended offer: $78k (1.5% below list) — sets the bar for market timing.
- Cap rate 23.8% vs local median 2.2% in South Lansing — top-decile yield for the area; either an underpriced asset or a hidden risk that comps aren't pricing in. Stress-test before assuming the spread holds.
Location & tenants
- Location reads: area grade B — affects rentability + tenant quality, not the cash-flow math above.
- Lansing Central School District (rural): math 53% / reading 62% proficiency, ranked #244 of 590 in NY (top 41%) — acceptable for families but not a draw, mixed tenant base, ~2y average lease; only 19% free/reduced lunch — higher-income household profile.
- Zoned schools: Raymond C Buckley Elementary School (math 37% / reading 67%, grade C-, #988 of 2,108 statewide, top 49%, 405 students, 32% FRL).
- Market conditions: 29 active listings in the ZIP; 382 units permitted in Tompkins County in 2024 (208 in 5+ unit buildings).
Forward outlook
- Local home prices are declining (-3.0%/yr); year-one equity from $546 of loan paydown is wiped out by about $2k of value loss. Plan a longer hold.
- Tompkins County population projected at +17% by 2050 — long-run rental-demand tailwind backs the buy-and-hold thesis.
- At projected returns (-3.0% appreciation + 3.0% rent growth), your $22k cash investment doubles in ~2 years — after that, you're playing with house money.
Negotiation context
- It's been on market 15 days — a 2% lower offer ($78k) is reasonable based on typical stale-listing flexibility.
- Current owner paid $35k; list at $79k implies a 126% gain — meaningful room to come down on a strong offer.
Questions for the listing agent
- Built in 1969 — when were the roof, HVAC, electrical panel, plumbing, and water heater last replaced?
- Is there a deadline driving the sale (1031 exchange, divorce, estate, relocation)? That informs how much negotiation room exists.
- What's the average days-on-market for RENTAL listings here right now (not sales)? A rising rental-DOM trend means longer vacancies and softer asking-rent achievability than the comps imply.
- What's the recent tenant-quality profile in this submarket — average credit score on applications, eviction rate, late-payment / NSF rate, and stable-employment percentage? A property-management company in the area should have these aggregated.
- How much new for-sale + rental construction is in the pipeline within 1–3 miles? Heavy new supply typically softens prices + rents 12–24 months out; constrained supply supports both.
Investment metrics
- 1% rule
- 2.73% ✓
- Cap rate
- 23.78%
- Cash-on-cash
- 62.46%
- DSCR
- 3.78
- GRM
- 3.1
CMA / ARV
No comps found within radius.
Projected returns pro-forma
-3.0% appreciation · 3.0% rent growth · sell at horizon
- IRR
- 61.4%
- Equity multiple
- 3.74×
- Total profit
- $60,562
- Equity at exit
- $11,779
- IRR
- 66.0%
- Equity multiple
- 7.66×
- Total profit
- $147,308
- Equity at exit
- $6,830
Cash invested: $22,120 (down + closing). Projections, not guarantees.
Landlord ↔ Tenant lean methodology
- Overall (STATE)
- 15 Strongly Tenant-Friendly
- State New York
- 15 Strongly Tenant-Friendly · D+10
- County
- — inherits STATE
- City
- — inherits STATE
ZIP-level market 14882
- Home prices YoY
- -11.0%
- Active inventory
- 29
- Price-to-rent
- 3.1×
Monthly cashflow live
- Estimated rent
- $2,158 medium interval (Pro) →
- Mortgage (P&I)
- −$414
- Tax from tax record
- −$107 /mo · $1,279/yr
- Insurance
- −$33
- HOA
- −$0
- Vacancy / Maint / Mgmt
- −$453
- Net cashflow
- $1,151
Break-even live
UW: 25.0% down · 7.5% · 30yr · 1.5% tax · 5.0% vac · 8.0% maint · 8.0% mgmt
Financing live
Cash to close
- Down payment
- $19,750
- Closing costs
- $2,370
- Reserves months
- —
- Total cash needed
- —
Loan-product check · same deal, 3 products live
Conventional
25% down · 7.5% · 30yr
- Down + closing
- —
- Monthly P&I
- —
- Monthly cashflow
- —
- DSCR
- —
- Eligible?
- —
Personal DTI + credit; lowest rate.
DSCR
20% down · 8.5% · 30yr
- Down + closing
- —
- Monthly P&I
- —
- Monthly cashflow
- —
- DSCR
- —
- Eligible?
- —
No personal income docs; deal must DSCR.
Hard money
10% down · 12.0% · 12mo
- Down + closing
- —
- Monthly P&I
- —
- Monthly cashflow
- —
- DSCR
- —
- Eligible?
- —
Short-term bridge; refi at stabilization.
Listing history 12 events
-
2026-06-17status $79,000 Pending 15 DOM
-
2026-06-17days on market $79,000 Active Under Contract 15 DOM
-
2026-06-16days on market $79,000 Active Under Contract 14 DOM
-
2026-06-15days on market $79,000 Active Under Contract 13 DOM
-
2026-06-14days on market $79,000 Active Under Contract 11 DOM
-
2026-06-13days on market $79,000 Active Under Contract 10 DOM
-
2026-06-10statusdays on market $79,000 Active Under Contract 8 DOM
-
2026-06-09days on market $79,000 Active 7 DOM
-
2026-06-08days on market $79,000 Active 6 DOM
-
2026-06-07days on market $79,000 Active 5 DOM
-
2026-06-03remarks 699-char remark
-
2026-06-03$79,000 Active 1 DOM
ⓘ Source: listings_history table (triggers on properties + properties_extension) + one-shot
backfill from property_details.listing_events for pre-trigger history.
Tax reassessment forecast NY · Partial reset (capped growth)
- Current annual tax
- $1,279 · $107/mo
- Projected year-2 tax
- $1,307 · $109/mo
- Expected delta
- +$28/yr (+$2/mo · 2.2%)
ⓘ Screening estimate from a state-policy table — verify with the county assessor before closing.
Climate risk First Street
- Flood 1/10 Low FEMA zone X · 0% chance over 30 yrs
- Wildfire 3/10 Moderate
- Heat 2/10 Low 6 d/yr ≥95°F today · 12 d/yr by 30 yrs out
- Wind 2/10 Low 100% chance of damaging wind over 30 yrs
- Air quality 2/10 Low 0 unhealthy d/yr today · 1 by 30 yrs out
Nearby sold comps map
Loading sold comps map…
Walkable amenities ~0.75 mi
Loading nearby amenities…
Taxation est. · year 1
- Rental income
- $25,900
- − Mortgage interest
- −$4,425
- − Property taxes
- −$1,279
- − Insurance
- −$395
- − Repairs & maintenance
- −$2,072
- − Management
- −$2,072
- − Depreciation
- −$2,298
- Taxable income
- $13,359
- Est. tax owed @ 24.0%
- −$3,206
- After-tax cash flow
- $10,609/yr
For passive investors: Depreciation is non-cash, so a rental often shows a tax loss while cash-flowing — sheltering income. Rental losses are passive: they offset passive income freely, and up to $25,000/yr can offset ordinary (W-2) income if you actively participate and your MAGI is under $100k (phasing out to $0 by $150k); unused losses carry forward. On sale, claimed depreciation is recaptured at up to 25%, and gains may owe capital-gains tax (a 1031 exchange can defer both). Figures are a year-1 estimate at your 24.0% rate — not tax advice; consult a CPA.
Schools (NCES district)
- District
- Lansing Central School District
- NCES district ID
- 3616710
- Math proficiency
- 53% ▼ -9.00%
- Reading proficiency
- 62% ▲ 2.00%
- Median HH income
- $70,215
- Composite
- 50.9/100
- National rank
- #1788
- State rank
- #244 of 590 in NY
Livability — South Lansing
No livability data for this city. (Only ~50 U.S. cities are tracked.)
Census & demographics
- Population (ZIP)
- 4,193
Population outlook (Tompkins County) Hauer SSP2
- Today (2025)
- 113,958 people
- By 2030
- 118,774 · +4.2%
- By 2040
- 125,927 · +10.5%
- By 2050
- 133,599 · +17.2%
- By 2075
- 156,759 · +37.6%
- By 2100
- 169,896 · +49.1%
Race, ethnicity, and origin ACS 2023
- Neighborhood character
- Predominantly White (91%)
- Race & ethnicity
- White 91% Hispanic / Latino 3% Two or more races 3% Black 3%
- Common ancestry
- Italian 4% Romanian 3% Slovak 2%
- Foreign-born
- 4% · Canada
- Languages at home
- 96% English-only · Other Indo-European 2% German/W. Germanic 1% Spanish 1%
Political lean MEDSL · Tompkins
- 2024 margin
- Solid D (+50.6) · D 75.3% · R 24.7%
- 2008→2024 swing
- +8.6pp toward D · 2008: 42.1pp · 2024: 50.6pp
- All cycles
- 2024: D+50.6 2020: D+49.2 2016: D+42.1 2012: D+39.8 2008: D+42.1
Not yet ingested
- Civics
- —
Market trends
- HPI YoY
- ▼ -47.13%
- Current HPI
- 380.8807
- Rent YoY
- —
- Metro
- —
- State GDP YoY
- ▲ 2.60%
- F500 in state
- 92
Industry mix (Fortune 500 HQ in NY)
| Industry | F500 HQs | Revenue |
|---|---|---|
| Financial Services | 10 | $950B |
|
||
| Consumer Goods | 9 | $162B |
|
||
| Insurance | 4 | $225B |
|
||
| Telecommunications | 2 | $144B |
|
||
| Pharmaceuticals | 2 | $112B |
|
||
| Media / Entertainment | 2 | $69B |
|
||
Price history
+125.7% since first listed2 events — show timeline
- 2026-06-02 Listed $79,000 IBRMLS
- 2013-08-13 Sold (Public Records) $35,000 Public Records
Property tax history
+3.9%/yrLatest (2025): $1,279 · +4.4% YoY. Source: county tax records.
Cash-flow waterfall
monthlySold comps — $/sqft
last 12 mo · ≤1 miLoading sold comps…