 Multi-family
106-07 Guy R Brewer Blvd · New York, NY
Flood risk No data
- FEMA flood zone
- —
- Chance of flooding over 30 yrs
- —
- Est. flood insurance / yr
- —
Fire risk No data
- Est. fire insurance / yr
- —
Heat risk No data
- Hot days now (above threshold)
- —
- Hot days in 30 yrs
- —
Wind risk No data
- Chance of severe wind over 30 yrs
- —
Air-quality risk No data
- Unhealthy air days now
- —
- Unhealthy air days in 30 yrs
- —
Risk factors via First Street. Map © Google.
Why this score? — see what drove the B+ grade
The composite is a weighted blend of 9 inputs, each scored 0–100. Each bar is that input's sub-score; the figure is the points it added to the 100-point composite (weight × sub-score).
- Cash flow +30.0/30.0
- ARV discount +15.0/15.0
- 1% rule +10.0/10.0
- DSCR +10.0/10.0
- Schools +5.0/10.0
- Livability +3.8/5.0
- Rent growth +2.5/5.0
- Condition / age +1.0/5.0
- Appreciation +0.0/10.0
$859,999
🖨 Deal sheet (PDF) 📄 Offer letter ✓ Due diligence
Multi-family units
County records classify this as Multi-Family (2-4 Unit). Listing-text estimate: 1 unit. estimate disagrees with records
Listing remarks
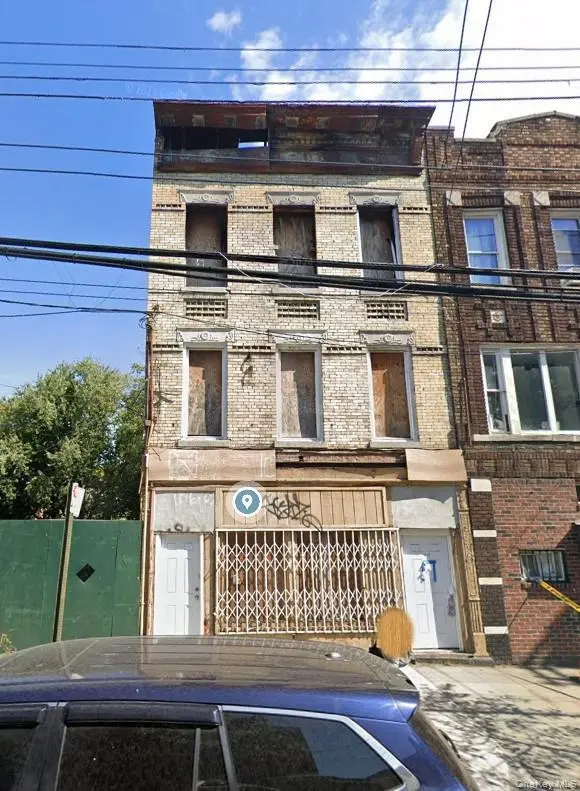
Excellent Development Opportunity right at the Guy R Brewer Blvd in Jamaica, Queens. Zoning R7A, C1-4. Lot Size 20X100, Total Buildable 8000 Sqft. Currently has a 3300 sqft structure of a three-story mixed-use building. Need complete renovation. The Property will be delivered with an approved plan for a 7-family plus storefront mixed-use building. Conveniently located next to York College, 2 blocks from Jamaica Center Train Station, and close to all community amenities. EXCELLENT LOCATION!
Key facts
- Zoning r7a c1-4
- Next to york college
- 2,000 sq ft lot
Tags
Property features AI
Exterior
- Parking: On-street parking
- Utilities: Public sewer; Other utilities (see remarks)
- Home design: Triplex; Fixer condition
- Construction: Brick construction
- Exterior features: Brick exterior; Not waterfront
Interior
- Heating & cooling: No central cooling; No listed heating or other heating
- Interior features: Full basement; Other interior features
Neighborhood map
What this means for you Summary
Snapshot
- This is a multifamily listed at $860k. Condition is rated poor.
Deal economics
- At list price, monthly cash flow is $6k ($71k/yr) — positive.
- The deal already cash-flows at list — no discount required.
- Meets the 1% rule at list price ($15k rent vs $860k).
- Recommended offer: $834k (3.0% below list) — sets the bar for market timing.
- Cap rate 14.6% vs local median 2.6% in New York — top-decile yield for the area; either an underpriced asset or a hidden risk that comps aren't pricing in. Stress-test before assuming the spread holds.
Location & tenants
- Location reads 75/100 on livability (#268 in NY, #4,188 nationally) — a middle-class / working-renter tenant base. Strengths: amenities A+, commute A+, health & safety A; Watch: crime F, cost of living F.
- Zoned schools: Elm Tree Elementary School (math 27% / reading 52%, grade F, #1,444 of 2,108 statewide, top 71%, 806 students, 94% FRL); Is 227 Louis Armstrong (math 52% / reading 69%, grade B+, #153 of 729 statewide, top 21%, 1,528 students, 68% FRL); Midwood High School (math 94% / reading 96%, grade A+, #83 of 1,100 statewide, top 8%, 4,062 students, 73% FRL).
- Market conditions: 121 active listings in the ZIP; 8 comparable units currently listed for rent nearby; rentals at typical pace (median 26d on market — plan ~3-4 weeks tenant-placement turnaround); solid renter incomes; 5,302 units permitted in Queens County in 2024 (4,918 in 5+ unit buildings).
- At $15,054/mo this rent would consume 233% of the median local household income ($78k/yr) (locally 1701% of renters already pay >50% of income on rent) — very limited rent-growth headroom before tenants either downsize or default.
Forward outlook
- Local home prices are declining (-3.0%/yr); year-one equity from $6k of loan paydown is wiped out by about $26k of value loss. Plan a longer hold.
- Queens County population projected at +16% by 2050 — long-run rental-demand tailwind backs the buy-and-hold thesis.
- At projected returns (-3.0% appreciation + 3.0% rent growth), your $241k cash investment doubles in ~5 years — after that, you're playing with house money.
Negotiation context
- It's been on market 33 days — a 3% lower offer ($834k) is reasonable based on typical stale-listing flexibility.
- 2 sale attempts since 2y ago; this cycle's ask is 8% above the opening price — seller raised mid-cycle; expect resistance to lowballs.
Risks & watch-outs
- Watch-outs: built in 1931 — expect roof / HVAC / electrical / plumbing capex.
Questions for the listing agent
- It's been on market 33 days. Have you received any prior offers? Is the seller open to a 3% concession, seller financing, or rate buy-down credit?
- Have any recent inspections been done? Can we get a copy of the seller's disclosures and any deferred-maintenance estimates?
- Built in 1931 — when were the roof, HVAC, electrical panel, plumbing, and water heater last replaced?
- Is there a deadline driving the sale (1031 exchange, divorce, estate, relocation)? That informs how much negotiation room exists.
- Schools are B-rated — typically a magnet for longer-tenancy family renters. What's the average tenant stay here, and is there a school-zone premium baked into asking?
- Crime grade is F in this area — have there been break-ins, vandalism, or insurance claims at this property in the last 3 years? What carrier currently insures it and at what premium?
- What's the average days-on-market for RENTAL listings here right now (not sales)? A rising rental-DOM trend means longer vacancies and softer asking-rent achievability than the comps imply.
- What's the recent tenant-quality profile in this submarket — average credit score on applications, eviction rate, late-payment / NSF rate, and stable-employment percentage? A property-management company in the area should have these aggregated.
- How much new apartment / multifamily construction is in the pipeline within 1–3 miles? Heavy new supply (>2% of stock underway) typically softens rents 12–24 months out; light construction supports rent growth.
Investment metrics
- 1% rule
- 1.75% ✓
- Cap rate
- 14.59%
- Cash-on-cash
- 29.65%
- DSCR
- 2.32
- GRM
- 4.8
CMA / ARV
- ARV (on-the-fly)
- $1,386,000
- Comps found
- 4
Show comp detail 4 sales within ~0.75 mi
| Address | Dist | Beds/Ba | Sqft | Sold | Price | $/sf | Match |
|---|---|---|---|---|---|---|---|
| 106 -07 Guy R Brewer Blvd | 0.35mi | 4/2.0 | 3,300 (0%) | 14mo | $601,000 | $182 | 72 |
| 17207A 90th Ave | 0.73mi | 9/6.0 | 3,240 (-2%) | 5mo | $1,360,000 | $420 | 59 |
| 10615 155th St | 0.36mi | 8/5.0 | 2,920 (-12%) | 11mo | $1,150,000 | $394 | 55 |
| 109-10 157th St | 0.48mi | 6/3.0 | 2,850 (-14%) | 3mo | $1,340,000 | $470 | 53 |
Match score weights: distance 35% · size 25% · config 20% · recency 20%. Top-matched comps best support the ARV.
Projected returns pro-forma
-3.0% appreciation · 3.0% rent growth · sell at horizon
- IRR
- 24.2%
- Equity multiple
- 2.00×
- Total profit
- $239,791
- Equity at exit
- $128,229
- IRR
- 32.0%
- Equity multiple
- 3.90×
- Total profit
- $697,649
- Equity at exit
- $74,357
Cash invested: $240,800 (down + closing). Projections, not guarantees.
Landlord ↔ Tenant lean methodology
- Overall (CITY)
- 0 Strongly Tenant-Friendly
- State New York
- 15 Strongly Tenant-Friendly · D+10
- County
- — inherits STATE
- City New York
- 0 Strongly Tenant-Friendly · D+34
ZIP-level market 11433
- Active inventory
- 121
- Price-to-rent
- 33.3×
Monthly cashflow live
- Estimated rent
- $15,054 medium interval (Pro) →
- Mortgage (P&I)
- −$4,510
- Tax est. 1.5%
- −$1,075 /mo · $12,900/yr
- Insurance
- −$358
- HOA
- −$0
- Vacancy / Maint / Mgmt
- −$3,161
- Net cashflow
- $5,949
Break-even live
Sensitivity live
| Price | -10% $6,544 | -5% $6,247 | +0% $5,949 | +5% $5,652 | +10% $5,355 |
|---|---|---|---|---|---|
| Rent | -10% $4,760 | -5% $5,355 | +0% $5,949 | +5% $6,544 | +10% $7,139 |
| Rate | -1.0pp $6,382 | -0.5pp $6,168 | base $5,949 | +0.5pp $5,727 | +1.0pp $5,500 |
7-unit breakdown (identical units grouped — click to expand)
| Units | Beds | Baths | Est. rent |
|---|---|---|---|
| 7× units | 1 | 1 | $15,057 |
| #1 | 1 | 1 | $2,151 |
| #2 | 1 | 1 | $2,151 |
| #3 | 1 | 1 | $2,151 |
| #4 | 1 | 1 | $2,151 |
| #5 | 1 | 1 | $2,151 |
| #6 | 1 | 1 | $2,151 |
| #7 | 1 | 1 | $2,151 |
| Total (7 units) | $15,054 | ||
UW: 25.0% down · 7.5% · 30yr · 1.5% tax · 5.0% vac · 8.0% maint · 8.0% mgmt
Financing live
Cash to close
- Down payment
- $215,000
- Closing costs
- $25,800
- Reserves months
- —
- Total cash needed
- —
Loan-product check · same deal, 3 products live
Conventional
25% down · 7.5% · 30yr
- Down + closing
- —
- Monthly P&I
- —
- Monthly cashflow
- —
- DSCR
- —
- Eligible?
- —
Personal DTI + credit; lowest rate.
DSCR
20% down · 8.5% · 30yr
- Down + closing
- —
- Monthly P&I
- —
- Monthly cashflow
- —
- DSCR
- —
- Eligible?
- —
No personal income docs; deal must DSCR.
Hard money
10% down · 12.0% · 12mo
- Down + closing
- —
- Monthly P&I
- —
- Monthly cashflow
- —
- DSCR
- —
- Eligible?
- —
Short-term bridge; refi at stabilization.
Rent comps 8 comps
| Address | Beds | Baths | Sqft | Rent | $/sqft | DOM | Units | Dist |
|---|---|---|---|---|---|---|---|---|
| 146-54 106th Ave Unit 2nd Floor Jamaica, NY | 3.0 | 2.0 | 2618 | $3,500 | $1.34 | 18d | 1 | 0.65mi |
| 155-09 113th Ave Unit 2nd Jamaica, NY | 3.0 | 1.0 | 2500 | $2,800 | $1.12 | 26d | 1 | 0.83mi |
| 114-50 Sutphin Blvd Jamaica, NY | 2.0 | 1.0 | 2520 | $2,300 | $0.91 | 26d | 1 | 1.04mi |
| 9026 138th Pl Jamaica, NY | 3.0 | 1.5 | 2892 | $3,753 | $1.30 | 6d | 1 | 1.06mi |
| 90-24 138th Pl Unit 3 Jamaica, NY | 3.0 | 2.0 | 2500 | $3,500 | $1.40 | 26d | 1 | 1.06mi |
| 111-32 139th St Unit 2 Jamaica, NY | 3.0 | 2.0 | 3520 | $3,700 | $1.05 | 26d | 1 | 1.26mi |
| 127-28 103rd Rd Unit 1 South Richmond Hill, NY | 2.0 | 1.0 | 2520 | $2,800 | $1.11 | 26d | 1 | 1.44mi |
| 19018 Woodhull Ave Hollis, NY | 3.0 | 2.0 | 4530 | $3,000 | $0.66 | 26d | 1 | 1.48mi |
Listing history 17 events
-
2026-06-21days on market $859,999 Active 33 DOM
-
2026-06-18days on market $859,999 Active 30 DOM
-
2026-06-17pricedays on market $859,999 Active 29 DOM
-
2026-06-16days on market $799,000 Active 28 DOM
-
2026-06-15days on market $799,000 Active 27 DOM
-
2026-06-13days on market $799,000 Active 25 DOM
-
2026-06-10days on market $799,000 Active 21 DOM
-
2026-06-08days on market $799,000 Active 20 DOM
-
2026-06-08days on market $799,000 Active 19 DOM
-
2026-06-04days on market $799,000 Active 16 DOM
-
2026-06-03days on market $799,000 Active 15 DOM
-
2026-06-02days on market $799,000 Active 14 DOM
-
2026-06-01days on market $799,000 Active 13 DOM
-
2026-05-31days on market $799,000 Active 12 DOM
-
2026-05-19$799,000 Active
-
2024-11-11historical
-
2024-05-01$620,000 Active
ⓘ Source: listings_history table (triggers on properties + properties_extension) + one-shot
backfill from property_details.listing_events for pre-trigger history.
Nearby sold comps map
Loading sold comps map…
Walkable amenities ~0.75 mi
Loading nearby amenities…
Taxation est. · year 1
- Rental income
- $180,648
- − Mortgage interest
- −$48,173
- − Property taxes
- −$12,900
- − Insurance
- −$4,300
- − Repairs & maintenance
- −$14,452
- − Management
- −$14,452
- − Depreciation
- −$25,018
- Taxable income
- $61,353
- Est. tax owed @ 24.0%
- −$14,725
- After-tax cash flow
- $56,668/yr
For passive investors: Depreciation is non-cash, so a rental often shows a tax loss while cash-flowing — sheltering income. Rental losses are passive: they offset passive income freely, and up to $25,000/yr can offset ordinary (W-2) income if you actively participate and your MAGI is under $100k (phasing out to $0 by $150k); unused losses carry forward. On sale, claimed depreciation is recaptured at up to 25%, and gains may owe capital-gains tax (a 1031 exchange can defer both). Figures are a year-1 estimate at your 24.0% rate — not tax advice; consult a CPA.
Condition & rehab AI · 1 photo
This property requires extensive renovation, including landscaping, fencing repair, and exterior painting, to improve its resale and rental value.
Repairs flagged
- Major landscaping — Overgrown vegetation and debris
- Major fencing — Damaged and overgrown
- Major exterior paint — No visible paint condition
Value-add opportunities
- Both landscaping and fencing improvements — Enhances curb appeal and safety
- Both exterior painting — Improves property appearance and value
- Both roof inspection and repair — Ensures structural integrity and safety
Renovation cost estimate screening
| Repair item | Severity | Est. cost |
|---|---|---|
| landscaping · Overgrown vegetation and debris | Major | $15,000–50,000 |
| fencing · Damaged and overgrown | Major | $15,000–50,000 |
| exterior paint · No visible paint condition | Major | $15,000–50,000 |
| Total estimated repair cost · 3 items | $45,000–150,000 |
Value-add ROI direction
- Both landscaping and fencing improvements — Enhances curb appeal and safety ↑
- Both exterior painting — Improves property appearance and value ↑
- Both roof inspection and repair — Ensures structural integrity and safety ↑
ⓘ Cost ranges are severity-bucket heuristics (US national rule-of-thumb). Get contractor quotes + a written scope before underwriting a rehab budget.
Schools (NCES district)
No district data.
Livability — New York
- Score
- 75/100
- State rank
- #268
- US rank
- #4188
Category grades
Schools grade is shown separately in the Schools card above.
Census & demographics
- Census place
- New York, NY
- County
- Queens County · 1,914,869 people
- City population
- 7,731,280
- Metro
- New York-Newark-Jersey City, NY-NJ-PA
- Population (ZIP)
- 37,884
- Household income
- $77,519
- Rent vs Own
- Severe rent burden
- 1701.0
Population outlook (Queens County) Hauer SSP2
- Today (2025)
- 2,546,320 people
- By 2030
- 2,643,059 · +3.8%
- By 2040
- 2,815,563 · +10.6%
- By 2050
- 2,944,423 · +15.6%
- By 2075
- 3,123,338 · +22.7%
- By 2100
- 3,098,688 · +21.7%
Race, ethnicity, and origin ACS 2023
- Neighborhood character
- Diverse neighborhood (Simpson 0.65)
- Race & ethnicity
- Black 55% Asian 17% Hispanic / Latino 13% Two or more races 5% White 2% Native American 1%
- Hispanic origin (detail)
- Puerto Rican 3% Dominican 4%
- Common ancestry
- Hispanic 2%
- Foreign-born
- 42% · Canada, China, United Kingdom
- Languages at home
- 69% English-only · Other Indo-European 13% Spanish 11% French/Haitian/Cajun 4%
Political lean MEDSL · Queens
- 2024 margin
- Strong D (+24.6) · D 62.3% · R 37.7%
- 2008→2024 swing
- -26.2pp toward R · 2008: 50.8pp · 2024: 24.6pp
- All cycles
- 2024: D+24.6 2020: D+45.2 2016: D+53.4 2012: D+58.5 2008: D+50.8
Not yet ingested
- Civics
- —
Market trends
- HPI YoY
- ▼ -250.63%
- Current HPI
- 383.7055
- Rent YoY
- —
- Metro
- New York-Newark-Jersey City, NY-NJ-PA
- State GDP YoY
- ▲ 2.60%
- F500 in state
- 92
Industry mix (Fortune 500 HQ in NY)
| Industry | F500 HQs | Revenue |
|---|---|---|
| Financial Services | 10 | $950B |
|
||
| Consumer Goods | 9 | $162B |
|
||
| Insurance | 4 | $225B |
|
||
| Telecommunications | 2 | $144B |
|
||
| Pharmaceuticals | 2 | $112B |
|
||
| Media / Entertainment | 2 | $69B |
|
||
Price history
+28.9% since first listed3 events — show timeline
- 2026-05-19 Listed $799,000 OneKey® MLS as Distributed by MLS Grid
- 2024-11-11 Listing Removed — OneKey® MLS as Distributed by MLS Grid
- 2024-05-01 Listed $620,000 OneKey® MLS as Distributed by MLS Grid
Cash-flow waterfall
monthlySold comps — $/sqft
last 12 mo · ≤1 miLoading sold comps…