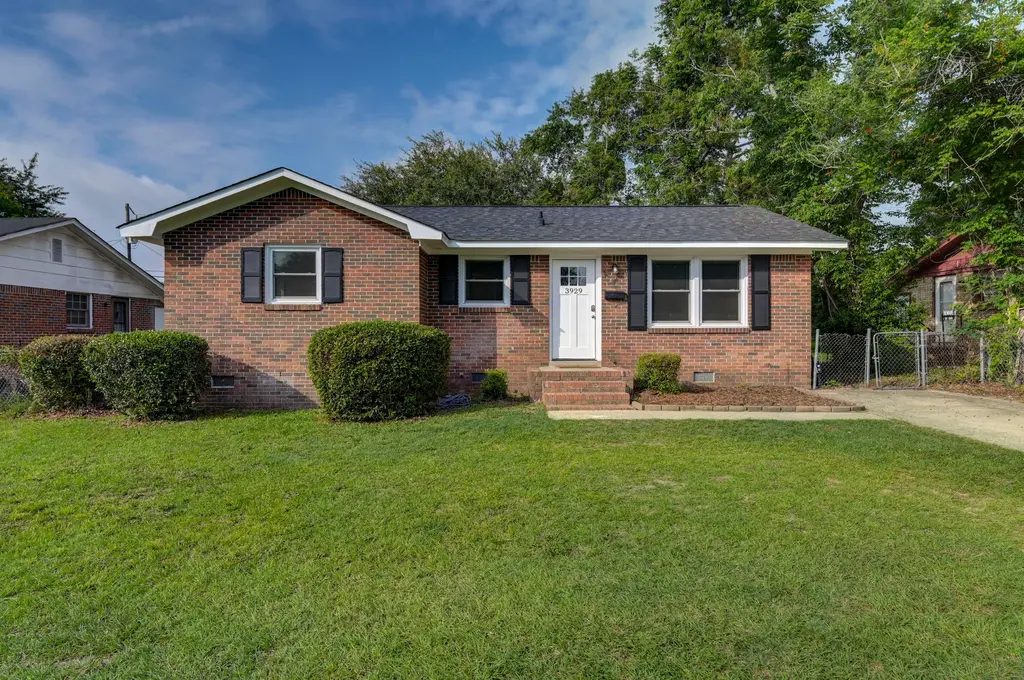
3929 Trotter Rd · Columbia, SC
Flood risk 1/10 · Minimal
- FEMA flood zone
- X (unshaded)
- Chance of flooding over 30 yrs
- 0.0%
- Est. flood insurance / yr
- $507 – $1,088
Fire risk 4/10 · Minor
- Est. fire insurance / yr
- $783 – $1,453
Heat risk 7/10 · Major
- Hot days now (above 108°F)
- 7 days/yr
- Hot days in 30 yrs
- 16 days/yr
Wind risk 6/10 · Moderate
- Chance of severe wind over 30 yrs
- 72.0%
Air-quality risk 3/10 · Minor
- Unhealthy air days now
- 2 days/yr
- Unhealthy air days in 30 yrs
- 2 days/yr
Risk factors via First Street. Map © Google.
Why this score? — see what drove the C+ grade
The composite is a weighted blend of 9 inputs, each scored 0–100. Each bar is that input's sub-score; the figure is the points it added to the 100-point composite (weight × sub-score).
- Cash flow +25.3/30.0
- DSCR +8.4/10.0
- ARV discount +7.5/15.0
- 1% rule +5.8/10.0
- Appreciation +5.0/10.0
- Livability +3.9/5.0
- Schools +2.6/10.0
- Rent growth +2.5/5.0
- Condition / age +2.5/5.0
$150,000
🖨 Deal sheet (PDF) 📄 Offer letter ✓ Due diligence
Listing remarks MLS
one story home with lots of potential. Cute yard, clean, and ready to sell
Key facts
- Convenient to dining
- Fenced-in backyard
- 7,840 sq ft lot
Tags
Property features AI
Finance
- Other: Property sits on approximately 0.18 acre
- Financial info: Details not provided
- HOA & community: Details not provided
Exterior
- Parking: Details not provided
- Security: Details not provided
- Utilities: Public water; Public sewer
- Home design: Brick exterior above the foundation; Crawlspace foundation
- Construction: Brick-all-sides exterior finish; Crawlspace foundation
- Exterior features: Patio; Privacy fence; Paved road access
Interior
- Kitchen: Eat-in kitchen; Tiled backsplash; Ceiling fan; Free-standing range
- Bedrooms: Master bedroom on the main level with hardwood floors; Second bedroom on the main level with hardwood floors; Third bedroom on the main level with hardwood floors
- Flooring: Hardwood flooring throughout main living and bedrooms; Vinyl flooring in part of the kitchen
- Bathrooms: One full bathroom
- Heating & cooling: Central heating; Central cooling
- Interior features: Hardwood floors in living areas; Ceiling fan in the kitchen; Free-standing range; Eat-in kitchen with tiled backsplash; Vinyl flooring in part of the kitchen; Utility room for laundry
- Laundry & utility: Laundry in a utility room on the main level
Neighborhood map
What this means for you Summary
Snapshot
- This is a 3-bed/1.0-bath single-family listed at $150k.
Deal economics
- At list price, monthly cash flow is $343 ($4k/yr) — positive.
- The deal already cash-flows at list — no discount required.
- Meets the 1% rule at list price ($2k rent vs $150k).
- Cap rate 9.0% vs local median 5.0% in Columbia — top-decile yield for the area; either an underpriced asset or a hidden risk that comps aren't pricing in. Stress-test before assuming the spread holds.
Location & tenants
- Location reads 78/100 on livability (#18 in SC, #2,436 nationally) — a middle-class / working-renter tenant base. Strengths: amenities A+, commute A+, cost of living A+; Watch: employment D, crime F.
- Richland 01 (urban): math 26% / reading 36% proficiency, ranked #54 of 80 in SC (top 68%) — families likely to look elsewhere, expect single-tenant / working-renter base with shorter leases; 64% free/reduced lunch — lower-income household profile, screen leases tightly.
- Zoned schools: Caughman Road Elementary (math 22% / reading 27%, grade F, #452 of 597 statewide, top 78%, 707 students, 100% FRL); Hopkins Middle (math 8% / reading 17%, grade F, #213 of 229 statewide, top 94%, 493 students, 100% FRL); Lower Richland High (math 5% / reading 64%, grade F, #185 of 196 statewide, top 94%, 1,244 students, 100% FRL) — zoned schools average 100% FRL vs 64% district-wide (36 pts higher); higher-poverty schools than district average — tighter screening recommended.
- Market conditions: 1 active listings in the ZIP; 9 comparable units currently listed for rent nearby; rentals at typical pace (median 26d on market — plan ~3-4 weeks tenant-placement turnaround); 3,472 units permitted in Richland County in 2024 (1,096 in 5+ unit buildings).
Forward outlook
- In year one you build about $6k of equity ($1k loan paydown + $4k appreciation (3.0% local appreciation)).
- Richland County population projected at +30% by 2050 — long-run rental-demand tailwind backs the buy-and-hold thesis.
- At projected returns (3.0% appreciation + 3.0% rent growth), your $42k cash investment doubles in ~4 years — after that, you're playing with house money.
- By year 7, paydown + projected appreciation supports a ~$35k cash-out refi (75% LTV) — recoverable capital for the next deal without selling this one.
Negotiation context
- Only 11 days on market — expect competitive offers; lowballing is unlikely to land.
- 2 sale attempts since 5y ago with the ask held roughly flat each time — persistent listings suggest the price (not the market) is what's stuck; bring a comps-based counter.
- Current owner paid $95k; list at $150k implies a 58% gain — meaningful room to come down on a strong offer.
Risks & watch-outs
- Climate carrying-cost: major wind risk, 72% chance of damaging wind over 30y; extreme-heat days projected 7→16/yr by 2055 (HVAC capex compounding) — expect insurance premiums to compound above CPI over the hold.
Questions for the listing agent
- Built in 1972 — when were the roof, HVAC, electrical panel, plumbing, and water heater last replaced?
- Is there a deadline driving the sale (1031 exchange, divorce, estate, relocation)? That informs how much negotiation room exists.
- Schools are D-rated, which usually means shorter tenancies and higher turnover. Who's the typical renter profile here, and what's been the actual vacancy rate?
- Crime grade is F in this area — have there been break-ins, vandalism, or insurance claims at this property in the last 3 years? What carrier currently insures it and at what premium?
- What's the average days-on-market for RENTAL listings here right now (not sales)? A rising rental-DOM trend means longer vacancies and softer asking-rent achievability than the comps imply.
- What's the recent tenant-quality profile in this submarket — average credit score on applications, eviction rate, late-payment / NSF rate, and stable-employment percentage? A property-management company in the area should have these aggregated.
- How much new for-sale + rental construction is in the pipeline within 1–3 miles? Heavy new supply typically softens prices + rents 12–24 months out; constrained supply supports both.
Investment metrics
- 1% rule
- 1.08% ✓
- Cap rate
- 9.04%
- Cash-on-cash
- 9.80%
- DSCR
- 1.44
- GRM
- 7.7
CMA / ARV
No comps found within radius.
Projected returns pro-forma
3.0% appreciation · 3.0% rent growth · sell at horizon
- IRR
- 16.7%
- Equity multiple
- 1.95×
- Total profit
- $39,876
- Equity at exit
- $67,446
- IRR
- 18.2%
- Equity multiple
- 3.65×
- Total profit
- $111,324
- Equity at exit
- $103,943
Cash invested: $42,000 (down + closing). Projections, not guarantees.
Landlord ↔ Tenant lean methodology
- Overall (STATE)
- 90 Strongly Landlord-Friendly
- State South Carolina
- 90 Strongly Landlord-Friendly · R+6
- County
- — inherits STATE
- City
- — inherits STATE
ZIP-level market 29209-4347
- Active inventory
- 1
- Price-to-rent
- 7.7×
Monthly cashflow live
- Estimated rent
- $1,627 high interval (Pro) →
- Mortgage (P&I)
- −$787
- Tax from tax record
- −$93 /mo · $1,119/yr
- Insurance
- −$62
- HOA
- −$0
- Lot rent
- −$0
- Vacancy / Maint / Mgmt
- −$342
- Net cashflow
- $343
Break-even live
Sensitivity live
| Price | -10% $428 | -5% $385 | +0% $343 | +5% $300 | +10% $258 |
|---|---|---|---|---|---|
| Rent | -10% $214 | -5% $279 | +0% $343 | +5% $407 | +10% $471 |
| Rate | -1.0pp $418 | -0.5pp $381 | base $343 | +0.5pp $304 | +1.0pp $264 |
UW: 25.0% down · 7.5% · 30yr · 1.5% tax · 5.0% vac · 8.0% maint · 8.0% mgmt
Financing live
Cash to close
- Down payment
- $37,500
- Closing costs
- $4,500
- Reserves months
- —
- Total cash needed
- —
Loan-product check · same deal, 3 products live
Conventional
25% down · 7.5% · 30yr
- Down + closing
- —
- Monthly P&I
- —
- Monthly cashflow
- —
- DSCR
- —
- Eligible?
- —
Personal DTI + credit; lowest rate.
DSCR
20% down · 8.5% · 30yr
- Down + closing
- —
- Monthly P&I
- —
- Monthly cashflow
- —
- DSCR
- —
- Eligible?
- —
No personal income docs; deal must DSCR.
Hard money
10% down · 12.0% · 12mo
- Down + closing
- —
- Monthly P&I
- —
- Monthly cashflow
- —
- DSCR
- —
- Eligible?
- —
Short-term bridge; refi at stabilization.
Rent comps 9 comps
| Address | Beds | Baths | Sqft | Rent | $/sqft | DOM | Units | Dist |
|---|---|---|---|---|---|---|---|---|
| 313 Shoreditch Dr Columbia, SC | 3.0 | 1.5 | 1056 | $1,775 | $1.68 | 26d | 1 | 0.20mi |
| 305 Shoreditch Dr Columbia, SC | 3.0 | 1.5 | 1378 | $1,586 | $1.15 | 21d | 1 | 0.22mi |
| 302 Crooked Pine Ct Columbia, SC | 3.0 | 2.0 | 1399 | $1,883 | $1.35 | 26d | 1 | 0.40mi |
| 385 Saskatoon Dr Unit 385 Columbia, SC | 3.0 | 2.0 | 1330 | $2,000 | $1.50 | 26d | 1 | 0.57mi |
| 4022 Ulmer Rd Columbia, SC | 2.0–3.0 | 1.0–2.0 | 1202 | $1,322 | $1.10 | 21d | 1 | 0.70mi |
| 329 Ovanta Rd Columbia, SC | 3.0 | 1.5 | 1100 | $1,200 | $1.09 | 26d | 1 | 0.84mi |
| 101 Shagbark Ave Columbia, SC | 3.0 | 1.0 | 1000 | $1,295 | $1.29 | 21d | 1 | 0.86mi |
| 429 Mockernut Ln Columbia, SC | 3.0 | 1.0 | 1010 | $1,250 | $1.24 | 26d | 1 | 0.87mi |
| 2705 Prince Charles Ct Columbia, SC | 4.0 | 2.0 | 1466 | $1,906 | $1.30 | 26d | 1 | 1.50mi |
Listing history 8 events
-
2026-06-23days on market $150,000 Active 11 DOM
-
2026-06-21days on market $150,000 Active 10 DOM
-
2026-06-18days on market $150,000 Active 7 DOM
-
2026-06-17days on market $150,000 Active 6 DOM
-
2026-06-16days on market $150,000 Active 5 DOM
-
2026-06-15days on market $150,000 Active 4 DOM
-
2026-06-14remarks 681-char remark
-
2026-06-14$150,000 Active 2 DOM
ⓘ Source: listings_history table (triggers on properties + properties_extension) + one-shot
backfill from property_details.listing_events for pre-trigger history.
Tax reassessment forecast SC · Resets to sale price
- Current annual tax
- $1,119 · $93/mo
- Projected year-2 tax
- $1,119 · $93/mo
- Expected delta
- $0/yr ($0/mo · 0.0%)
ⓘ Screening estimate from a state-policy table — verify with the county assessor before closing.
Climate risk First Street
- Flood 1/10 Low FEMA zone X (unshaded) · 0% chance over 30 yrs
- Wildfire 4/10 Moderate
- Heat 7/10 Severe 7 d/yr ≥108°F today · 16 d/yr by 30 yrs out
- Wind 6/10 Major 72% chance of damaging wind over 30 yrs
- Air quality 3/10 Moderate 2 unhealthy d/yr today · 2 by 30 yrs out
Nearby sold comps map
Loading sold comps map…
Walkable amenities ~0.75 mi
Loading nearby amenities…
Taxation est. · year 1
- Rental income
- $19,523
- − Mortgage interest
- −$8,402
- − Property taxes
- −$1,119
- − Insurance
- −$750
- − Repairs & maintenance
- −$1,562
- − Management
- −$1,562
- − Depreciation
- −$4,364
- Taxable income
- $1,764
- Est. tax owed @ 24.0%
- −$423
- After-tax cash flow
- $3,691/yr
For passive investors: Depreciation is non-cash, so a rental often shows a tax loss while cash-flowing — sheltering income. Rental losses are passive: they offset passive income freely, and up to $25,000/yr can offset ordinary (W-2) income if you actively participate and your MAGI is under $100k (phasing out to $0 by $150k); unused losses carry forward. On sale, claimed depreciation is recaptured at up to 25%, and gains may owe capital-gains tax (a 1031 exchange can defer both). Figures are a year-1 estimate at your 24.0% rate — not tax advice; consult a CPA.
Schools (NCES district)
- District
- Richland 01
- NCES district ID
- 4503360
- Math proficiency
- 26% ▼ -7.00%
- Reading proficiency
- 36% ▼ -5.00%
- Median HH income
- $38,931
- Composite
- 25.94/100
- National rank
- #7335
- State rank
- #54 of 80 in SC
Livability — Columbia
- Score
- 78/100
- State rank
- #18
- US rank
- #2436
Category grades
Schools grade is shown separately in the Schools card above.
Census & demographics
No demographic data for this ZIP.
Market trends
- HPI YoY
- —
- Current HPI
- —
- Rent YoY
- —
- Metro
- —
- State GDP YoY
- ▲ 4.51%
- F500 in state
- 2
Industry mix (Fortune 500 HQ in SC)
| Industry | F500 HQs | Revenue |
|---|---|---|
| Packaging | 1 | $7B |
|
||
Price history
+495.3% since first listed7 events — show timeline
- 2026-06-11 Listed $150,000 Consolidated MLS
- 2021-06-07 Sold (Public Records) $95,000 Public Records
- 2021-06-04 Sold (MLS) $95,000 SPMLS
- 2021-05-20 Pending — SPMLS
- 2021-04-22 Contingent — SPMLS
- 2021-04-15 Listed $90,000 SPMLS
- 1987-06-01 Sold (Public Records) $25,197 Public Records
Property tax history
-3.7%/yrLatest (2025): $1,119 · +4.2% YoY. Source: county tax records.
Cash-flow waterfall
monthlySold comps — $/sqft
last 12 mo · ≤1 miLoading sold comps…