410 White Willow Dr · Nevada, TX
Flood risk 7/10 · Major
- FEMA flood zone
- X (unshaded)
- Chance of flooding over 30 yrs
- 0.99%
- Est. flood insurance / yr
- $507 – $1,088
Fire risk 7/10 · Major
- Est. fire insurance / yr
- $1,222 – $2,270
Heat risk 7/10 · Major
- Hot days now (above 110°F)
- 7 days/yr
- Hot days in 30 yrs
- 23 days/yr
Wind risk 6/10 · Moderate
- Chance of severe wind over 30 yrs
- 27.0%
Air-quality risk 2/10 · Minimal
- Unhealthy air days now
- 2 days/yr
- Unhealthy air days in 30 yrs
- 2 days/yr
Risk factors via First Street. Map © Google.
Why this score? — see what drove the D+ grade
The composite is a weighted blend of 9 inputs, each scored 0–100. Each bar is that input's sub-score; the figure is the points it added to the 100-point composite (weight × sub-score).
- ARV discount +12.8/15.0
- Appreciation +10.0/10.0
- Cash flow +7.7/30.0
- Schools +3.2/10.0
- Livability +3.2/5.0
- 1% rule +2.5/10.0
- Rent growth +2.5/5.0
- Condition / age +2.5/5.0
- DSCR +1.8/10.0
$264,490
🖨 Deal sheet (PDF) 📄 Offer letter ✓ Due diligence
Listing remarks
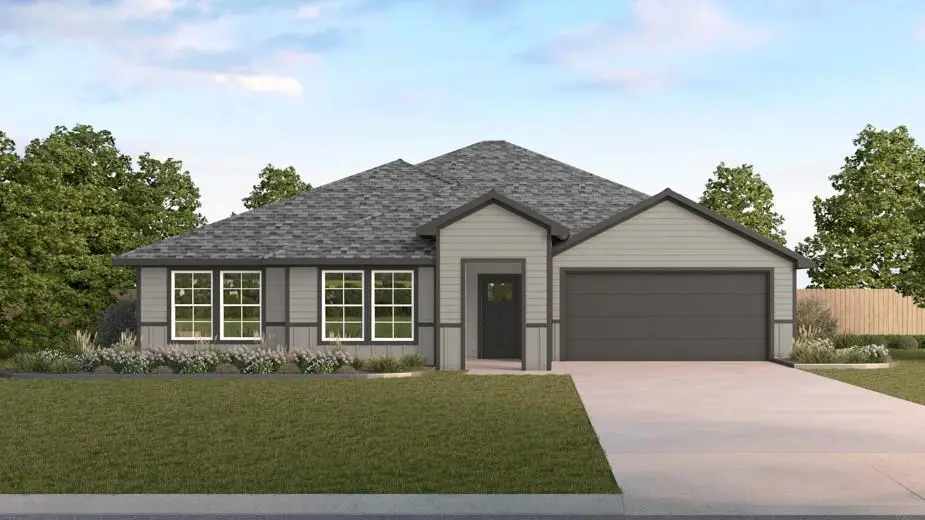
New! Beautiful single story floor plan! Four bedrooms, two full baths, open floor plan with covered patio. Home includes, island kitchen, granite counters throughout, LED lighting, full sprinkler system, professionally engineered post tension foundation, and much more! Waverly Estates is a new D. R. Horton community in Josephine. The community is conveniently located just minutes from Interstate 30, providing easy access to Rockwall and the DFW Metroplex. Waverly Estates offers a variety of single-family homes to choose from. If you're looking for a new home in the Josephine area, Waverly Estates is the perfect community for you.
Key facts
- Island kitchen
- Covered patio
- Granite counters
Tags
Property features AI
Finance
- Financial info: Acceptable financing: Cash, Conventional, FHA, USDA, VA; No second mortgage
- HOA & community: Mandatory association with semi-annual fee ($275) managed by AAM; Association fee includes full use of facilities
Exterior
- Parking: Attached 2-car garage (approx. 20' x 20', 10' height); 2 covered parking spaces
- Security: Smoke detectors; Carbon monoxide detectors
- Utilities: City water; City sewer; Located in a municipal utility district; Energy-efficient features including upgraded attic insulation, HVAC, insulation, lighting, thermostat, and windows
- Home design: Single family residence; One story; New construction (completed in 2026); Not attached to another property
- Construction: Composition roof; Slab foundation; New construction
- Exterior features: Wood fencing; Less than 0.5 acre lot
Interior
- Kitchen: Dishwasher; Disposal; Electric range; Microwave; Water line to refrigerator; Breakfast bar; Built-in cabinets; Natural stone/granite counters
- Bedrooms: Primary bedroom on level 1 with ensuite bath and walk-in closet; Three additional bedrooms on level 1 (split bedroom plan)
- Flooring: Carpet; Laminate
- Bathrooms: Two full bathrooms
- Heating & cooling: Central heating (natural gas); Central air (electric)
- Interior features: Open floorplan with decorative lighting; Eat-in kitchen with kitchen island and pantry; Granite counters; Cable TV and high-speed internet available
Neighborhood map
What this means for you Summary
Snapshot
- This is a 4-bed/2.0-bath single-family listed at $264k.
Deal economics
- At list price, monthly cash flow is $-377 ($-5k/yr) — negative.
- To cash-flow at today's rent, offer at most $210k (20.6% below list).
- To meet the 1% rule (rent ≥ 1% of price), the offer needs to be $198k (25.2% below list).
- Recommended offer: $198k (25.2% below list) — sets the bar for 1% rule.
- Cap rate 4.9% vs local median 1.9% in Nevada — top-decile yield for the area; either an underpriced asset or a hidden risk that comps aren't pricing in. Stress-test before assuming the spread holds.
Location & tenants
- Location reads 63/100 on livability (#881 in TX) — a middle-class / working-renter tenant base. Strengths: employment A+, housing A+, crime A; Watch: amenities F, commute F, health & safety F.
- Community ISD (rural): math 30% / reading 38% proficiency, ranked #479 of 826 in TX (top 58%) — families likely to look elsewhere, expect single-tenant / working-renter base with shorter leases.
- Zoned schools: Leland E Edge Middle (math 25% / reading 35%, grade F, #1,056 of 1,662 statewide, top 65%, 931 students, 53% FRL) — zoned schools average 53% FRL vs 36% district-wide (18 pts higher); higher-poverty schools than district average — tighter screening recommended.
- Market conditions: 421 active listings in the ZIP; 5 comparable units currently listed for rent nearby; rentals at typical pace (median 27d on market — plan ~3-4 weeks tenant-placement turnaround); 40% of comp listings sitting > 30 days — soft ceiling on asking rent; 19,194 units permitted in Collin County in 2024 (3,988 in 5+ unit buildings).
Forward outlook
- In year one you build about $28k of equity ($2k loan paydown + $26k appreciation (10.0% local appreciation)).
- Collin County population projected at +60% by 2050 — long-run rental-demand tailwind backs the buy-and-hold thesis.
- By year 2, paydown + projected appreciation supports a ~$45k cash-out refi (75% LTV) — recoverable capital for the next deal without selling this one.
Negotiation context
- It's been on market 26 days — a 2% lower offer ($261k) is reasonable based on typical stale-listing flexibility.
Risks & watch-outs
- Watch-outs: flood insurance adds $66/mo.
- Climate carrying-cost: major flood risk; major wind risk, 27% chance of damaging wind over 30y; major wildfire risk; extreme-heat days projected 7→23/yr by 2055 (HVAC capex compounding) — expect insurance premiums to compound above CPI over the hold.
Questions for the listing agent
- What do current leases actually rent for vs. the listed asking? Can we see a recent rent roll and the last 12 months of T-12 income?
- What's the actual annual flood-insurance premium (NFIP or private), and is the property in a SFHA with mandatory coverage?
- What does the HOA fee cover, when was the last increase, and are there any pending special assessments or reserve-fund shortfalls?
- Is there a deadline driving the sale (1031 exchange, divorce, estate, relocation)? That informs how much negotiation room exists.
- The area grade is low — what's the realistic commute time and amenity access for the typical tenant pool here? Any planned neighborhood developments (good or bad) we should know about?
- What's the average days-on-market for RENTAL listings here right now (not sales)? A rising rental-DOM trend means longer vacancies and softer asking-rent achievability than the comps imply.
- What's the recent tenant-quality profile in this submarket — average credit score on applications, eviction rate, late-payment / NSF rate, and stable-employment percentage? A property-management company in the area should have these aggregated.
- How much new for-sale + rental construction is in the pipeline within 1–3 miles? Heavy new supply typically softens prices + rents 12–24 months out; constrained supply supports both.
Investment metrics
- 1% rule
- 0.75% ✗
- Cap rate
- 4.88%
- Cash-on-cash
- -5.04%
- DSCR
- 0.78
- GRM
- 11.1
CMA / ARV
- ARV (on-the-fly)
- $299,520
- Comps found
- 12
Show comp detail 12 sales within ~0.75 mi
| Address | Dist | Beds/Ba | Sqft | Sold | Price | $/sf | Match |
|---|---|---|---|---|---|---|---|
| 504 Gooseberry Dr | 0.12mi | 4/2.0 | 1,801 (-4%) | 4mo | $259,990 | $144 | 84 |
| 511 Silver Birch Dr | 0.12mi | 4/2.0 | 1,801 (-4%) | 7mo | $310,490 | $172 | 82 |
| 410 Silver Birch Dr | 0.12mi | 4/2.0 | 1,801 (-4%) | 9mo | $303,990 | $169 | 81 |
| 502 Gooseberry Dr | 0.12mi | 4/2.0 | 2,024 (+8%) | 5mo | $295,990 | $146 | 76 |
| 507 Saddle Blanket Dr | 0.12mi | 4/2.0 | 2,024 (+8%) | 5mo | $320,990 | $159 | 76 |
| 509 Silver Birch Dr | 0.12mi | 4/2.0 | 2,024 (+8%) | 6mo | $299,990 | $148 | 76 |
| 1213 Bristlecone Dr | 0.12mi | 4/2.0 | 1,655 (-12%) | 2mo | $263,990 | $160 | 73 |
| 510 Silver Birch Dr | 0.12mi | 4/3.0 | 2,034 (+9%) | 3mo | $285,990 | $141 | 73 |
| 508 Gooseberry Dr | 0.12mi | 4/2.0 | 1,655 (-12%) | 6mo | $296,990 | $179 | 70 |
| 503 Silver Birch Dr | 0.12mi | 4/3.0 | 2,034 (+9%) | 8mo | $297,490 | $146 | 70 |
| 510 English Oak Dr | 0.12mi | 4/2.0 | 1,655 (-12%) | 8mo | $280,490 | $169 | 69 |
| 515 Hubbard Cir | 0.48mi | 3/2.0 (-1) | 1,820 (-3%) | 0mo | $425,000 | $234 | 68 |
Match score weights: distance 35% · size 25% · config 20% · recency 20%. Top-matched comps best support the ARV.
Projected returns pro-forma
10.0% appreciation · 3.0% rent growth · sell at horizon
- IRR
- 20.0%
- Equity multiple
- 2.62×
- Total profit
- $120,122
- Equity at exit
- $238,274
- IRR
- 18.3%
- Equity multiple
- 6.03×
- Total profit
- $372,829
- Equity at exit
- $513,846
Cash invested: $74,057 (down + closing). Projections, not guarantees.
Landlord ↔ Tenant lean methodology
- Overall (STATE)
- 87 Strongly Landlord-Friendly
- State Texas
- 87 Strongly Landlord-Friendly · R+5
- County
- — inherits STATE
- City
- — inherits STATE
ZIP-level market 75173
- Home prices YoY
- 3.1%
- Active inventory
- 421
- Price-to-rent
- 11.1×
Monthly cashflow live
- Estimated rent
- $1,979 high interval (Pro) →
- Mortgage (P&I)
- −$1,387
- Tax est. 1.5%
- −$331 /mo · $3,967/yr
- Insurance
- −$110
- Flood insurance flood zone
- −$66 /mo · $798/yr
- HOA
- −$46
- Vacancy / Maint / Mgmt
- −$415
- Net cashflow
- $-377
Break-even live
Sensitivity live
| Price | -10% $-194 | -5% $-286 | +0% $-377 | +5% $-469 | +10% $-560 |
|---|---|---|---|---|---|
| Rent | -10% $-534 | -5% $-455 | +0% $-377 | +5% $-299 | +10% $-221 |
| Rate | -1.0pp $-244 | -0.5pp $-310 | base $-377 | +0.5pp $-446 | +1.0pp $-515 |
UW: 25.0% down · 7.5% · 30yr · 1.5% tax · 5.0% vac · 8.0% maint · 8.0% mgmt
Financing live
Cash to close
- Down payment
- $66,122
- Closing costs
- $7,935
- Reserves months
- —
- Total cash needed
- —
Loan-product check · same deal, 3 products live
Conventional
25% down · 7.5% · 30yr
- Down + closing
- —
- Monthly P&I
- —
- Monthly cashflow
- —
- DSCR
- —
- Eligible?
- —
Personal DTI + credit; lowest rate.
DSCR
20% down · 8.5% · 30yr
- Down + closing
- —
- Monthly P&I
- —
- Monthly cashflow
- —
- DSCR
- —
- Eligible?
- —
No personal income docs; deal must DSCR.
Hard money
10% down · 12.0% · 12mo
- Down + closing
- —
- Monthly P&I
- —
- Monthly cashflow
- —
- DSCR
- —
- Eligible?
- —
Short-term bridge; refi at stabilization.
Rent comps 5 comps
| Address | Beds | Baths | Sqft | Rent | $/sqft | DOM | Units | Dist |
|---|---|---|---|---|---|---|---|---|
| 1213 Bristlecone DR Josephine, TX | 4.0 | 2.0 | 1649 | $1,900 | $1.15 | 8d | 1 | 0.09mi |
| 831 Lexington Ln Nevada, TX | 4.0 | 2.5 | 2089 | $2,095 | $1.00 | 14d | 1 | 1.01mi |
| 6425 Mirage St Nevada, TX | 3.0 | 2.0 | 1344 | $2,050 | $1.53 | 26d | 1 | 1.06mi |
| 422 E FM 6 Nevada, TX | 5.0 | 2.0 | 1942 | $2,700 | $1.39 | 45d | 1 | 1.32mi |
| 450 Collin St Nevada, TX | 3.0 | 2.0 | 1572 | $2,000 | $1.27 | 45d | 1 | 1.47mi |
HOA detail
- Monthly dues
- $46 · $552/yr
Listing history 17 events
-
2026-06-21days on market $264,490 Active 26 DOM
-
2026-06-18days on market $264,490 Active 23 DOM
-
2026-06-17days on market $264,490 Active 22 DOM
-
2026-06-16days on market $264,490 Active 21 DOM
-
2026-06-15days on market $264,490 Active 20 DOM
-
2026-06-13days on market $264,490 Active 18 DOM
-
2026-06-13days on market $264,490 Active 17 DOM
-
2026-06-10price $264,490 Active 14 DOM
-
2026-06-09days on market $277,490 Active 14 DOM
-
2026-06-08days on market $277,490 Active 13 DOM
-
2026-06-07days on market $277,490 Active 12 DOM
-
2026-06-04days on market $277,490 Active 9 DOM
-
2026-06-03days on market $277,490 Active 8 DOM
-
2026-06-02days on market $277,490 Active 7 DOM
-
2026-06-01days on market $277,490 Active 6 DOM
-
2026-05-31days on market $277,490 Active 5 DOM
-
2026-05-26$277,490 Active
ⓘ Source: listings_history table (triggers on properties + properties_extension) + one-shot
backfill from property_details.listing_events for pre-trigger history.
Climate risk First Street
- Flood 7/10 Severe FEMA zone X (unshaded) · 99% chance over 30 yrs
- Wildfire 7/10 Severe
- Heat 7/10 Severe 7 d/yr ≥110°F today · 23 d/yr by 30 yrs out
- Wind 6/10 Major 27% chance of damaging wind over 30 yrs
- Air quality 2/10 Low 2 unhealthy d/yr today · 2 by 30 yrs out
Nearby sold comps map
Loading sold comps map…
Walkable amenities ~0.75 mi
Loading nearby amenities…
Taxation est. · year 1
- Rental income
- $23,743
- − Mortgage interest
- −$14,816
- − Property taxes
- −$3,967
- − Insurance
- −$2,120
- − Repairs & maintenance
- −$1,899
- − Management
- −$1,899
- − HOA
- −$552
- − Depreciation
- −$7,694
- Taxable loss
- −$9,205
- Est. tax savings @ 24.0%
- +$2,209
- After-tax cash flow
- $-2,317/yr
For passive investors: Depreciation is non-cash, so a rental often shows a tax loss while cash-flowing — sheltering income. Rental losses are passive: they offset passive income freely, and up to $25,000/yr can offset ordinary (W-2) income if you actively participate and your MAGI is under $100k (phasing out to $0 by $150k); unused losses carry forward. On sale, claimed depreciation is recaptured at up to 25%, and gains may owe capital-gains tax (a 1031 exchange can defer both). Figures are a year-1 estimate at your 24.0% rate — not tax advice; consult a CPA.
Schools (NCES district)
- District
- Community ISD
- NCES district ID
- 4814850
- Math proficiency
- 30% ▼ -23.00%
- Reading proficiency
- 38% ▼ -11.00%
- Median HH income
- $71,841
- Composite
- 31.58/100
- National rank
- #5951
- State rank
- #479 of 826 in TX
Livability — Nevada
- Score
- 63/100
- State rank
- #881
- US rank
- #15880
Category grades
Schools grade is shown separately in the Schools card above.
Census & demographics
- Population (ZIP)
- 9,284
Population outlook (Collin County) Hauer SSP2
- Today (2025)
- 1,210,074 people
- By 2030
- 1,358,201 · +12.2%
- By 2040
- 1,654,061 · +36.7%
- By 2050
- 1,937,359 · +60.1%
- By 2075
- 2,567,039 · +112.1%
- By 2100
- 2,952,048 · +144.0%
Race, ethnicity, and origin ACS 2023
- Neighborhood character
- Majority White (65%)
- Race & ethnicity
- White 65% Hispanic / Latino 28% Two or more races 15% Black 2% Native American 1%
- Hispanic origin (detail)
- Mexican 26%
- Common ancestry
- Slovak 2% Serbian 1% Iranian 1%
- Foreign-born
- 17% · Canada, Jamaica
- Languages at home
- 74% English-only · Spanish 24% Arabic 1%
Political lean MEDSL · Collin
- 2024 margin
- R (+11.1) · D 43.1% · R 54.3% · Other 2.6%
- 2008→2024 swing
- +14.4pp toward D · 2008: -25.6pp · 2024: -11.1pp
- All cycles
- 2024: R+11.1 2020: R+4.3 2016: R+17.0 2012: R+31.6 2008: R+25.6
Not yet ingested
- Civics
- —
Market trends
- HPI YoY
- ▲ 10.09%
- Current HPI
- 331.12
- Rent YoY
- —
- Metro
- —
- State GDP YoY
- ▲ 3.95%
- F500 in state
- 110
Industry mix (Fortune 500 HQ in TX)
| Industry | F500 HQs | Revenue |
|---|---|---|
| Energy | 16 | $1,198B |
|
||
| Technology | 5 | $198B |
|
||
| Engineering / Construction | 4 | $72B |
|
||
| Energy Services | 3 | $60B |
|
||
| Utilities | 3 | $41B |
|
||
| Healthcare | 2 | $330B |
|
||
Price history
1 event — show timeline
- 2026-05-26 Listed $277,490 NTREIS
Cash-flow waterfall
monthlySold comps — $/sqft
last 12 mo · ≤1 miLoading sold comps…