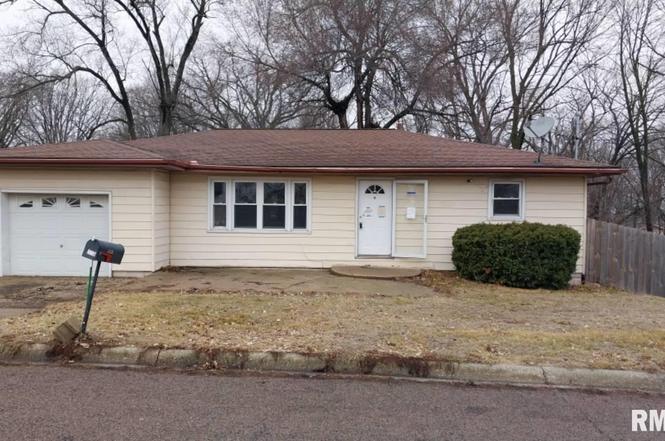
328 Randolph St · East Peoria, IL
Flood risk 1/10 · Minimal
- FEMA flood zone
- X (unshaded)
- Chance of flooding over 30 yrs
- 0.0%
- Est. flood insurance / yr
- $473 – $860
Fire risk 1/10 · Minimal
- Est. fire insurance / yr
- $804 – $1,492
Heat risk 3/10 · Minor
- Hot days now (above 104°F)
- 7 days/yr
- Hot days in 30 yrs
- 18 days/yr
Wind risk 2/10 · Minimal
- Chance of severe wind over 30 yrs
- 1.0%
Air-quality risk 3/10 · Minor
- Unhealthy air days now
- 1 days/yr
- Unhealthy air days in 30 yrs
- 3 days/yr
Risk factors via First Street. Map © Google.
Why this score? — see what drove the B- grade
The composite is a weighted blend of 9 inputs, each scored 0–100. Each bar is that input's sub-score; the figure is the points it added to the 100-point composite (weight × sub-score).
- Cash flow +26.4/30.0
- ARV discount +15.0/15.0
- DSCR +9.0/10.0
- 1% rule +8.5/10.0
- Livability +3.8/5.0
- Rent growth +2.5/5.0
- Condition / age +2.5/5.0
- Schools +1.5/10.0
- Appreciation +0.0/10.0
$99,900
🖨 Deal sheet (PDF) 📄 Offer letter ✓ Due diligence
Listing remarks MLS
Updated & move-in ready 3-bedroom, 1 1/2 bath home on over 1/2 acre lot in East Peoria. This ranch home is located on a dead-end street, spacious kitchen, double lot with privacy backyard, attached 1-stall garage, stainless steel appliances, and oversized living room. Updates include new paint, carpet, & laminate flooring, built-in kitchen cutting board, ceiling fans, painted kitchen cabinets with new hardware, updated bathroom, and all new electrical. Basement is great storage area or to be finished off. Hot tub stays. Home Warranty included.
Key facts
- Privacy backyard
- Spacious kitchen
- Dead-end street
Tags
Neighborhood map
What this means for you Summary
Snapshot
- This is a 3-bed/1.5-bath single-family listed at $100k.
Deal economics
- At list price, monthly cash flow is $260 ($3k/yr) — positive.
- The deal already cash-flows at list — no discount required.
- Meets the 1% rule at list price ($1k rent vs $100k).
- Recommended offer: $98k (1.5% below list) — sets the bar for market timing.
- Cap rate 9.4% vs local median 4.6% in East Peoria — top-decile yield for the area; either an underpriced asset or a hidden risk that comps aren't pricing in. Stress-test before assuming the spread holds.
Location & tenants
- Location reads 75/100 on livability (#209 in IL, #3,927 nationally) — a middle-class / working-renter tenant base. Strengths: cost of living A+, housing A+, health & safety A+; Watch: amenities D, commute F.
- East Peoria Chsd 309 (suburban): math 17% / reading 15% proficiency, ranked #482 of 620 in IL (top 78%) — low school quality limits family demand, transient renter base, plan for 1-2y turnover.
- Zoned schools: Don D Shute Elem School (192 students, 0% FRL); Central Jr High School (math 12% / reading 18%, grade F, #501 of 665 statewide, top 77%, 462 students, 0% FRL); East Peoria High School (math 17% / reading 15%, grade F, #457 of 693 statewide, top 66%, 947 students, 0% FRL).
- Market conditions: 146 active listings in the ZIP; 1 comparable units currently listed for rent nearby; 77 units permitted in Tazewell County in 2024 (0 in 5+ unit buildings).
Forward outlook
- Local home prices are declining (-3.0%/yr); year-one equity from $691 of loan paydown is wiped out by about $3k of value loss. Plan a longer hold.
- Tazewell County population projected at -15% by 2050 — secular population decline; favor cash flow + early exit over multi-decade hold.
- At projected returns (-3.0% appreciation + 3.0% rent growth), your $28k cash investment doubles in ~10 years — after that, you're playing with house money.
Negotiation context
- It's been on market 16 days — a 2% lower offer ($98k) is reasonable based on typical stale-listing flexibility.
- 3 sale attempts since 11y ago with the ask held roughly flat each time — persistent listings suggest the price (not the market) is what's stuck; bring a comps-based counter.
Risks & watch-outs
- Watch-outs: property tax is 2.9% of price; built in 1953 — expect roof / HVAC / electrical / plumbing capex.
Questions for the listing agent
- Built in 1953 — when were the roof, HVAC, electrical panel, plumbing, and water heater last replaced?
- Property tax is high relative to price — has the assessment been appealed recently, and will the sale trigger a re-assessment?
- Is there a deadline driving the sale (1031 exchange, divorce, estate, relocation)? That informs how much negotiation room exists.
- Schools are F-rated, which usually means shorter tenancies and higher turnover. Who's the typical renter profile here, and what's been the actual vacancy rate?
- What's the average days-on-market for RENTAL listings here right now (not sales)? A rising rental-DOM trend means longer vacancies and softer asking-rent achievability than the comps imply.
- What's the recent tenant-quality profile in this submarket — average credit score on applications, eviction rate, late-payment / NSF rate, and stable-employment percentage? A property-management company in the area should have these aggregated.
- How much new for-sale + rental construction is in the pipeline within 1–3 miles? Heavy new supply typically softens prices + rents 12–24 months out; constrained supply supports both.
Investment metrics
- 1% rule
- 1.35% ✓
- Cap rate
- 9.42%
- Cash-on-cash
- 11.16%
- DSCR
- 1.50
- GRM
- 6.2
CMA / ARV
- ARV (on-the-fly)
- $119,850
- Comps found
- 12
Show comp detail 12 sales within ~0.75 mi
| Address | Dist | Beds/Ba | Sqft | Sold | Price | $/sf | Match |
|---|---|---|---|---|---|---|---|
| 328 Randolph St | 0.00mi | 3/1.5 | 1,275 (0%) | 2mo | $75,000 | $59 | 99 |
| 617 N Stewart St | 0.29mi | 3/2.0 | 1,248 (-2%) | 3mo | $150,000 | $120 | 79 |
| 615 Pekin Ave | 0.22mi | 3/1.0 | 1,276 (+0%) | 13mo | $65,000 | $51 | 77 |
| 304 Park Ave | 0.31mi | 3/1.5 | 1,256 (-2%) | 11mo | $157,000 | $125 | 74 |
| 121 Apple Ct | 0.74mi | 3/1.5 | 1,279 (+0%) | 3mo | $175,400 | $137 | 62 |
| 411 W Muller Rd | 0.41mi | 2/1.0 (-1) | 1,302 (+2%) | 12mo | $121,500 | $93 | 60 |
| 317 Smith St | 0.63mi | 3/1.0 | 1,270 (-0%) | 13mo | $120,000 | $94 | 57 |
| 326 Park Ave | 0.35mi | 3/1.0 | 1,104 (-13%) | 5mo | $102,000 | $92 | 55 |
| 408 Glendale St | 0.55mi | 3/1.0 | 1,302 (+2%) | 20mo | $60,000 | $46 | 52 |
| 331 Mckinley St | 0.61mi | 2/1.0 (-1) | 1,356 (+6%) | 3mo | $115,000 | $85 | 51 |
| 221 N Stewart St | 0.62mi | 3/1.0 | 1,120 (-12%) | 2mo | $135,000 | $121 | 47 |
| 122 Holland Ct | 0.61mi | 4/2.0 (+1) | 1,182 (-7%) | 11mo | $124,000 | $105 | 43 |
Match score weights: distance 35% · size 25% · config 20% · recency 20%. Top-matched comps best support the ARV.
Projected returns pro-forma
-3.0% appreciation · 3.0% rent growth · sell at horizon
- IRR
- 0.4%
- Equity multiple
- 1.02×
- Total profit
- $477
- Equity at exit
- $14,895
- IRR
- 10.2%
- Equity multiple
- 1.79×
- Total profit
- $22,129
- Equity at exit
- $8,638
Cash invested: $27,972 (down + closing). Projections, not guarantees.
Landlord ↔ Tenant lean methodology
- Overall (STATE)
- 43 Moderately Tenant-Leaning
- State Illinois
- 43 Moderately Tenant-Leaning · D+7
- County
- — inherits STATE
- City
- — inherits STATE
ZIP-level market 61611
- Home prices YoY
- -30.8%
- Active inventory
- 146
- Price-to-rent
- 6.2×
Monthly cashflow live
- Estimated rent
- $1,350 medium interval (Pro) →
- Mortgage (P&I)
- −$524
- Tax from tax record
- −$241 /mo · $2,889/yr
- Insurance
- −$42
- HOA
- −$0
- Vacancy / Maint / Mgmt
- −$284
- Net cashflow
- $260
Break-even live
Sensitivity live
| Price | -10% $317 | -5% $288 | +0% $260 | +5% $232 | +10% $204 |
|---|---|---|---|---|---|
| Rent | -10% $154 | -5% $207 | +0% $260 | +5% $314 | +10% $367 |
| Rate | -1.0pp $311 | -0.5pp $286 | base $260 | +0.5pp $234 | +1.0pp $208 |
UW: 25.0% down · 7.5% · 30yr · 1.5% tax · 5.0% vac · 8.0% maint · 8.0% mgmt
Financing live
Cash to close
- Down payment
- $24,975
- Closing costs
- $2,997
- Reserves months
- —
- Total cash needed
- —
Loan-product check · same deal, 3 products live
Conventional
25% down · 7.5% · 30yr
- Down + closing
- —
- Monthly P&I
- —
- Monthly cashflow
- —
- DSCR
- —
- Eligible?
- —
Personal DTI + credit; lowest rate.
DSCR
20% down · 8.5% · 30yr
- Down + closing
- —
- Monthly P&I
- —
- Monthly cashflow
- —
- DSCR
- —
- Eligible?
- —
No personal income docs; deal must DSCR.
Hard money
10% down · 12.0% · 12mo
- Down + closing
- —
- Monthly P&I
- —
- Monthly cashflow
- —
- DSCR
- —
- Eligible?
- —
Short-term bridge; refi at stabilization.
Rent comps 1 comps
| Address | Beds | Baths | Sqft | Rent | $/sqft | DOM | Units | Dist |
|---|---|---|---|---|---|---|---|---|
| 204 Pekin Ave Apt 2 East Peoria, IL | 2.0 | 1.0 | 1150 | $1,350 | $1.17 | 15d | 1 | 0.34mi |
Listing history 7 events
-
2026-03-25status Pending
-
2026-03-09$99,900 Active
-
2022-04-04soldstatus $130,000 557-char remark
Show marketing remark (557 chars)
Updated & move-in ready 3-bedroom, 1 1/2 bath home on over 1/2 acre lot in East Peoria. This ranch home is located on a dead-end street, spacious kitchen, double lot with privacy backyard, attached 1-stall garage, stainless steel appliances, and oversized living room. Updates include new paint, carpet, & laminate flooring, built-in kitchen cutting board, ceiling fans, painted kitchen cabinets with new hardware, updated bathroom, and all new electrical. Basement is great storage area or to be finished off. Hot tub stays. Home Warranty included.
-
2022-04-04soldstatus $130,000
Show marketing remark (557 chars)
Updated & move-in ready 3-bedroom, 1 1/2 bath home on over 1/2 acre lot in East Peoria. This ranch home is located on a dead-end street, spacious kitchen, double lot with privacy backyard, attached 1-stall garage, stainless steel appliances, and oversized living room. Updates include new paint, carpet, & laminate flooring, built-in kitchen cutting board, ceiling fans, painted kitchen cabinets with new hardware, updated bathroom, and all new electrical. Basement is great storage area or to be finished off. Hot tub stays. Home Warranty included.
-
2022-01-29$130,000 557-char remark
Show marketing remark (557 chars)
Updated & move-in ready 3-bedroom, 1 1/2 bath home on over 1/2 acre lot in East Peoria. This ranch home is located on a dead-end street, spacious kitchen, double lot with privacy backyard, attached 1-stall garage, stainless steel appliances, and oversized living room. Updates include new paint, carpet, & laminate flooring, built-in kitchen cutting board, ceiling fans, painted kitchen cabinets with new hardware, updated bathroom, and all new electrical. Basement is great storage area or to be finished off. Hot tub stays. Home Warranty included.
-
2015-09-10soldstatus $91,000 273-char remark
Show marketing remark (273 chars)
Well maintained 3 bedroom ranch home on two wooded lots, centrally located in East Peoria. Enjoy all spring has to offer on the oversized deck. This home also features a walk out basement and detached yard shed. Home is in an estate and will be sold “AS-IS”.
-
2015-05-06$89,000 273-char remark
Show marketing remark (273 chars)
Well maintained 3 bedroom ranch home on two wooded lots, centrally located in East Peoria. Enjoy all spring has to offer on the oversized deck. This home also features a walk out basement and detached yard shed. Home is in an estate and will be sold “AS-IS”.
ⓘ Source: listings_history table (triggers on properties + properties_extension) + one-shot
backfill from property_details.listing_events for pre-trigger history.
Tax reassessment forecast IL · Partial reset (capped growth)
- Current annual tax
- $2,889 · $241/mo
- Projected year-2 tax
- $2,889 · $241/mo
- Expected delta
- $0/yr ($0/mo · 0.0%)
ⓘ Screening estimate from a state-policy table — verify with the county assessor before closing.
Climate risk First Street
- Flood 1/10 Low FEMA zone X (unshaded) · 0% chance over 30 yrs
- Wildfire 1/10 Low
- Heat 3/10 Moderate 7 d/yr ≥104°F today · 18 d/yr by 30 yrs out
- Wind 2/10 Low 100% chance of damaging wind over 30 yrs
- Air quality 3/10 Moderate 1 unhealthy d/yr today · 3 by 30 yrs out
Nearby sold comps map
Loading sold comps map…
Walkable amenities ~0.75 mi
Loading nearby amenities…
Taxation est. · year 1
- Rental income
- $16,200
- − Mortgage interest
- −$5,596
- − Property taxes
- −$2,889
- − Insurance
- −$500
- − Repairs & maintenance
- −$1,296
- − Management
- −$1,296
- − Depreciation
- −$2,906
- Taxable income
- $1,717
- Est. tax owed @ 24.0%
- −$412
- After-tax cash flow
- $2,711/yr
For passive investors: Depreciation is non-cash, so a rental often shows a tax loss while cash-flowing — sheltering income. Rental losses are passive: they offset passive income freely, and up to $25,000/yr can offset ordinary (W-2) income if you actively participate and your MAGI is under $100k (phasing out to $0 by $150k); unused losses carry forward. On sale, claimed depreciation is recaptured at up to 25%, and gains may owe capital-gains tax (a 1031 exchange can defer both). Figures are a year-1 estimate at your 24.0% rate — not tax advice; consult a CPA.
Schools (NCES district)
- District
- East Peoria Chsd 309
- NCES district ID
- 1713230
- Math proficiency
- 17% ▼ -6.00%
- Reading proficiency
- 15% ▼ -9.00%
- Median HH income
- $51,439
- Composite
- 14.75/100
- National rank
- #9394
- State rank
- #482 of 620 in IL
Livability — East Peoria
- Score
- 75/100
- State rank
- #209
- US rank
- #3927
Category grades
Schools grade is shown separately in the Schools card above.
Census & demographics
- Census place
- East Peoria, IL
- City population
- 23,698
- Population (ZIP)
- 23,698
Population outlook (Tazewell County) Hauer SSP2
- Today (2025)
- 131,252 people
- By 2030
- 128,028 · -2.5%
- By 2040
- 120,443 · -8.2%
- By 2050
- 111,872 · -14.8%
- By 2075
- 89,843 · -31.5%
- By 2100
- 66,468 · -49.4%
Race, ethnicity, and origin ACS 2023
- Neighborhood character
- Predominantly White (92%)
- Race & ethnicity
- White 92% Two or more races 4% Hispanic / Latino 3% Black 1%
- Common ancestry
- Lithuanian 3% Italian 2% Romanian 2%
- Foreign-born
- 1%
- Languages at home
- 98% English-only · Spanish 1%
Political lean MEDSL · Tazewell
- 2024 margin
- Strong R (+26.7) · D 35.8% · R 62.5% · Other 1.8%
- 2008→2024 swing
- -20.6pp toward R · 2008: -6.0pp · 2024: -26.7pp
- All cycles
- 2024: R+26.7 2020: R+25.6 2016: R+28.5 2012: R+17.9 2008: R+6.0
Not yet ingested
- Civics
- —
Market trends
- HPI YoY
- ▼ -71.82%
- Current HPI
- 161.385
- Rent YoY
- —
- Metro
- —
- State GDP YoY
- ▲ 1.59%
- F500 in state
- 60
Industry mix (Fortune 500 HQ in IL)
| Industry | F500 HQs | Revenue |
|---|---|---|
| Insurance | 4 | $201B |
|
||
| Consumer Goods | 4 | $87B |
|
||
| Industrial Machinery | 3 | $64B |
|
||
| Healthcare | 2 | $55B |
|
||
| Retail / Pharmacy | 1 | $148B |
|
||
| Agriculture / Food | 1 | $86B |
|
||
Price history
+12.2% since first listed7 events — show timeline
- 2026-03-25 Pending — RMLSA as Distributed by MLS Grid
- 2026-03-09 Listed $99,900 RMLSA as Distributed by MLS Grid
- 2022-04-04 Sold (Public Records) $130,000 Public Records
- 2022-04-04 Sold (MLS) $130,000 RMLSA as Distributed by MLS Grid
- 2022-01-29 Listed $130,000 RMLSA as Distributed by MLS Grid
- 2015-09-10 Sold (MLS) $91,000 RMLSA as Distributed by MLS Grid
- 2015-05-06 Listed $89,000 RMLSA as Distributed by MLS Grid
Property tax history
+4.6%/yrLatest (2024): $2,889 · +5.3% YoY. Source: county tax records.
Cash-flow waterfall
monthlySold comps — $/sqft
last 12 mo · ≤1 miLoading sold comps…