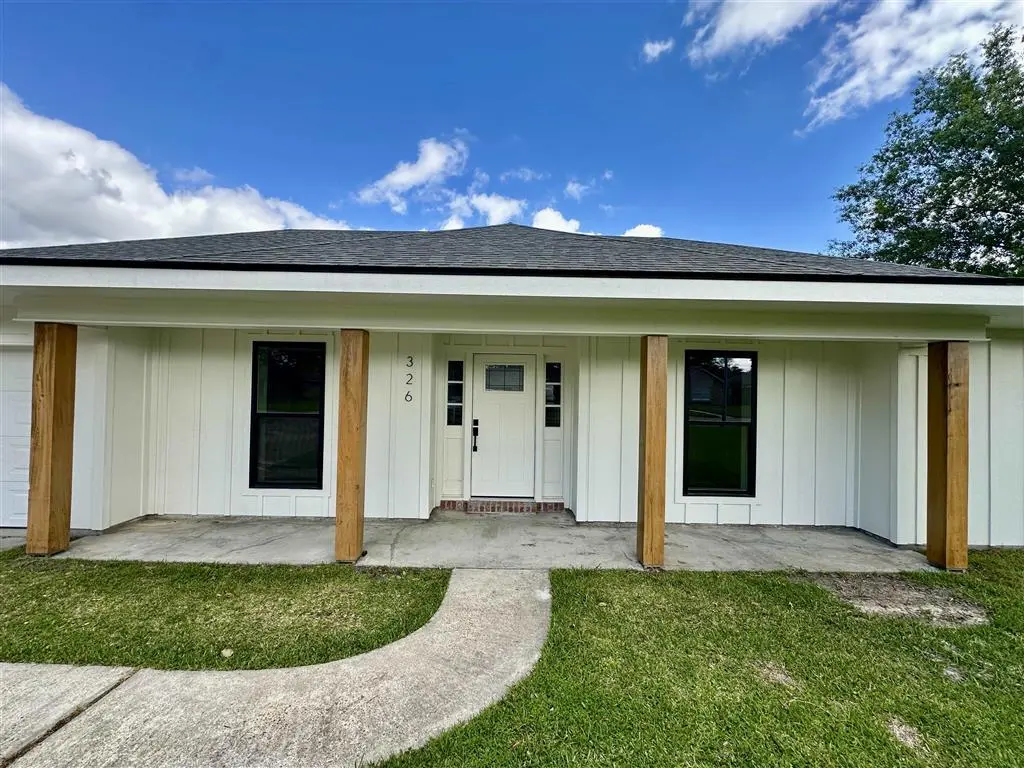
326 Vanessa Ave · Lake Charles, LA
Flood risk 3/10 · Minor
- FEMA flood zone
- X (unshaded)
- Chance of flooding over 30 yrs
- 0.1%
- Est. flood insurance / yr
- $507 – $1,088
Fire risk 1/10 · Minimal
- Est. fire insurance / yr
- $1,269 – $2,357
Heat risk 9/10 · Severe
- Hot days now (above 109°F)
- 7 days/yr
- Hot days in 30 yrs
- 22 days/yr
Wind risk 9/10 · Severe
- Chance of severe wind over 30 yrs
- 99.0%
Air-quality risk 2/10 · Minimal
- Unhealthy air days now
- 1 days/yr
- Unhealthy air days in 30 yrs
- 1 days/yr
Risk factors via First Street. Map © Google.
Why this score? — see what drove the C+ grade
The composite is a weighted blend of 9 inputs, each scored 0–100. Each bar is that input's sub-score; the figure is the points it added to the 100-point composite (weight × sub-score).
- Cash flow +24.5/30.0
- ARV discount +9.3/15.0
- DSCR +7.9/10.0
- 1% rule +5.3/10.0
- Rent growth +5.0/5.0
- Livability +3.4/5.0
- Schools +3.1/10.0
- Condition / age +2.5/5.0
- Appreciation +0.0/10.0
$292,000
🖨 Deal sheet (PDF) 📄 Offer letter ✓ Due diligence
Listing remarks MLS
This property offers a 4-bedroom 2.5 bath floor plan situated on 0.23 acres of land. Gutted to the studs. Schedule your showing today!
Key facts
- New plumbing
- New electrical
- New roof
Tags
Neighborhood map
What this means for you Summary
Snapshot
- This is a 4-bed/2.5-bath single-family listed at $292k.
Deal economics
- At list price, monthly cash flow is $599 ($7k/yr) — positive.
- The deal already cash-flows at list — no discount required.
- Meets the 1% rule at list price ($3k rent vs $292k).
- Cap rate 8.8% vs local median 4.2% in Lake Charles — top-decile yield for the area; either an underpriced asset or a hidden risk that comps aren't pricing in. Stress-test before assuming the spread holds.
Location & tenants
- Location reads 68/100 on livability (#95 in LA) — a middle-class / working-renter tenant base. Strengths: commute A+, cost of living A+, housing A+; Watch: crime F, amenities F, employment D-.
- Calcasieu Parish (other): math 30% / reading 44% proficiency, ranked #29 of 98 in LA (top 30%) — families likely to look elsewhere, expect single-tenant / working-renter base with shorter leases.
- Zoned schools: Dolby Elementary School (math 42% / reading 62%, grade C-, #108 of 646 statewide, top 18%, 381 students, 64% FRL); F. K. White Middle School (math 26% / reading 39%, grade F, #104 of 218 statewide, top 48%, 661 students, 67% FRL); Alfred M. Barbe High School (math 41% / reading 56%, grade D, #41 of 265 statewide, top 16%, 1,991 students, 41% FRL) — zoned schools at 57% FRL track the district average.
- Market conditions: Rents rising fast (+15.1%/yr); 464 active listings in the ZIP; 2 comparable units currently listed for rent nearby; solid renter incomes; 1,298 units permitted in Calcasieu Parish in 2024 (526 in 5+ unit buildings).
- This rent runs 42% of the median local income ($86k/yr) — at the standard rent-burdened threshold; future hikes will face affordability resistance.
Forward outlook
- Local home prices are declining (-3.0%/yr); year-one equity from $2k of loan paydown is wiped out by about $9k of value loss. Plan a longer hold.
- Calcasieu County population projected at +11% by 2050 — modest demand growth; plan on rents tracking national, not racing it.
- At projected returns (-3.0% appreciation + 8.0% rent growth), your $82k cash investment doubles in ~8 years — after that, you're playing with house money.
Negotiation context
- Only 1 days on market — expect competitive offers; lowballing is unlikely to land.
- 2 sale attempts since 4y ago with the ask held roughly flat each time — persistent listings suggest the price (not the market) is what's stuck; bring a comps-based counter.
- Current owner paid $135k; list at $292k implies a 116% gain — meaningful room to come down on a strong offer.
Risks & watch-outs
- Climate carrying-cost: severe wind risk, 99% chance of damaging wind over 30y; extreme-heat days projected 7→22/yr by 2055 (HVAC capex compounding) — expect insurance premiums to compound above CPI over the hold.
Questions for the listing agent
- Is there a deadline driving the sale (1031 exchange, divorce, estate, relocation)? That informs how much negotiation room exists.
- Schools are B-rated — typically a magnet for longer-tenancy family renters. What's the average tenant stay here, and is there a school-zone premium baked into asking?
- Crime grade is F in this area — have there been break-ins, vandalism, or insurance claims at this property in the last 3 years? What carrier currently insures it and at what premium?
- What's the average days-on-market for RENTAL listings here right now (not sales)? A rising rental-DOM trend means longer vacancies and softer asking-rent achievability than the comps imply.
- What's the recent tenant-quality profile in this submarket — average credit score on applications, eviction rate, late-payment / NSF rate, and stable-employment percentage? A property-management company in the area should have these aggregated.
- How much new for-sale + rental construction is in the pipeline within 1–3 miles? Heavy new supply typically softens prices + rents 12–24 months out; constrained supply supports both.
Investment metrics
- 1% rule
- 1.03% ✓
- Cap rate
- 8.76%
- Cash-on-cash
- 8.79%
- DSCR
- 1.39
- GRM
- 8.1
CMA / ARV
- ARV (on-the-fly)
- $303,996
- Comps found
- 12
Show comp detail 12 sales within ~0.75 mi
| Address | Dist | Beds/Ba | Sqft | Sold | Price | $/sf | Match |
|---|---|---|---|---|---|---|---|
| 445 Washington | 0.20mi | 4/2.0 | 2,177 (+1%) | 3mo | $189,000 | $87 | 84 |
| 114 Heather St | 0.20mi | 3/— (-1) | 2,271 (+5%) | 9mo | $200,000 | $88 | 70 |
| 115 Greenway St | 0.16mi | 4/2.0 | 1,900 (-12%) | 2mo | $263,400 | $139 | 69 |
| 209 Vanessa Ave | 0.18mi | 3/2.0 (-1) | 1,974 (-8%) | 12mo | $255,000 | $129 | 61 |
| 256 Overhill Dr Dr | 0.50mi | 4/2.5 | 2,300 (+7%) | 7mo | $335,000 | $146 | 60 |
| 629 Becky Ln | 0.57mi | 4/2.0 | 1,990 (-8%) | 9mo | $305,000 | $153 | 51 |
| 625 Archwood St | 0.58mi | 4/2.5 | 2,458 (+14%) | 3mo | $392,500 | $160 | 47 |
| 729 Dianne Ln | 0.57mi | 3/2.0 (-1) | 1,959 (-9%) | 12mo | $315,000 | $161 | 41 |
| 616 Becky Ln | 0.53mi | 4/2.0 | 1,874 (-13%) | 13mo | $305,000 | $163 | 40 |
| 1300 Westmoreland St | 0.71mi | 3/3.0 (-1) | 2,387 (+11%) | 4mo | $255,000 | $107 | 39 |
| 644 Becky Ln | 0.61mi | 3/2.0 (-1) | 2,475 (+15%) | 5mo | $350,000 | $141 | 36 |
| 714 Rampart St St | 0.73mi | 3/2.0 (-1) | 1,869 (-13%) | 3mo | $172,500 | $92 | 34 |
Match score weights: distance 35% · size 25% · config 20% · recency 20%. Top-matched comps best support the ARV.
Projected returns pro-forma
-3.0% appreciation · 8.0% rent growth · sell at horizon
- IRR
- 2.0%
- Equity multiple
- 1.08×
- Total profit
- $6,579
- Equity at exit
- $43,538
- IRR
- 15.7%
- Equity multiple
- 2.55×
- Total profit
- $126,526
- Equity at exit
- $25,247
Cash invested: $81,760 (down + closing). Projections, not guarantees.
Landlord ↔ Tenant lean methodology
- Overall (STATE)
- 90 Strongly Landlord-Friendly
- State Louisiana
- 90 Strongly Landlord-Friendly · R+12
- County
- — inherits STATE
- City
- — inherits STATE
ZIP-level market 70605
- Rents YoY
- 15.1%
- Active inventory
- 464
- Price-to-rent
- 8.1×
Monthly cashflow live
- Estimated rent
- $2,997 medium interval (Pro) →
- Mortgage (P&I)
- −$1,531
- Tax from tax record
- −$116 /mo · $1,389/yr
- Insurance
- −$122
- HOA
- −$0
- Vacancy / Maint / Mgmt
- −$629
- Net cashflow
- $599
Break-even live
Sensitivity live
| Price | -10% $764 | -5% $682 | +0% $599 | +5% $517 | +10% $434 |
|---|---|---|---|---|---|
| Rent | -10% $362 | -5% $481 | +0% $599 | +5% $718 | +10% $836 |
| Rate | -1.0pp $746 | -0.5pp $673 | base $599 | +0.5pp $524 | +1.0pp $447 |
UW: 25.0% down · 7.5% · 30yr · 1.5% tax · 5.0% vac · 8.0% maint · 8.0% mgmt
Financing live
Cash to close
- Down payment
- $73,000
- Closing costs
- $8,760
- Reserves months
- —
- Total cash needed
- —
Loan-product check · same deal, 3 products live
Conventional
25% down · 7.5% · 30yr
- Down + closing
- —
- Monthly P&I
- —
- Monthly cashflow
- —
- DSCR
- —
- Eligible?
- —
Personal DTI + credit; lowest rate.
DSCR
20% down · 8.5% · 30yr
- Down + closing
- —
- Monthly P&I
- —
- Monthly cashflow
- —
- DSCR
- —
- Eligible?
- —
No personal income docs; deal must DSCR.
Hard money
10% down · 12.0% · 12mo
- Down + closing
- —
- Monthly P&I
- —
- Monthly cashflow
- —
- DSCR
- —
- Eligible?
- —
Short-term bridge; refi at stabilization.
Rent comps 2 comps
| Address | Beds | Baths | Sqft | Rent | $/sqft | DOM | Units | Dist |
|---|---|---|---|---|---|---|---|---|
| 716 Dianne Ln Lake Charles, LA | 3.0 | 2.0 | 2200 | $5,000 | $2.27 | 45d | 1 | 0.52mi |
| 4128 Center St Lake Charles, LA | 4.0 | 2.0 | 2227 | $1,500 | $0.67 | 45d | 1 | 1.40mi |
Listing history 6 events
-
2026-04-04status Pending
-
2026-04-02$292,000 Active
-
2024-04-03soldstatus $135,000
-
2022-04-26soldstatus 134-char remark
Show marketing remark (134 chars)
This property offers a 4-bedroom 2.5 bath floor plan situated on 0.23 acres of land. Gutted to the studs. Schedule your showing today!
-
2022-03-14$107,000 134-char remark
Show marketing remark (134 chars)
This property offers a 4-bedroom 2.5 bath floor plan situated on 0.23 acres of land. Gutted to the studs. Schedule your showing today!
-
2022-03-08soldstatus $45,000
ⓘ Source: listings_history table (triggers on properties + properties_extension) + one-shot
backfill from property_details.listing_events for pre-trigger history.
Tax reassessment forecast LA · Resets to sale price
- Current annual tax
- $1,389 · $116/mo
- Projected year-2 tax
- $1,606 · $134/mo
- Expected delta
- +$217/yr (+$18/mo · 15.6%)
ⓘ Screening estimate from a state-policy table — verify with the county assessor before closing.
Climate risk First Street
- Flood 3/10 Moderate FEMA zone X (unshaded) · 10% chance over 30 yrs
- Wildfire 1/10 Low
- Heat 9/10 Extreme 7 d/yr ≥109°F today · 22 d/yr by 30 yrs out
- Wind 9/10 Extreme 99% chance of damaging wind over 30 yrs
- Air quality 2/10 Low 1 unhealthy d/yr today · 1 by 30 yrs out
Nearby sold comps map
Loading sold comps map…
Walkable amenities ~0.75 mi
Loading nearby amenities…
Taxation est. · year 1
- Rental income
- $35,968
- − Mortgage interest
- −$16,357
- − Property taxes
- −$1,389
- − Insurance
- −$1,460
- − Repairs & maintenance
- −$2,877
- − Management
- −$2,877
- − Depreciation
- −$8,495
- Taxable income
- $2,513
- Est. tax owed @ 24.0%
- −$603
- After-tax cash flow
- $6,587/yr
For passive investors: Depreciation is non-cash, so a rental often shows a tax loss while cash-flowing — sheltering income. Rental losses are passive: they offset passive income freely, and up to $25,000/yr can offset ordinary (W-2) income if you actively participate and your MAGI is under $100k (phasing out to $0 by $150k); unused losses carry forward. On sale, claimed depreciation is recaptured at up to 25%, and gains may owe capital-gains tax (a 1031 exchange can defer both). Figures are a year-1 estimate at your 24.0% rate — not tax advice; consult a CPA.
Schools (NCES district)
- District
- Calcasieu Parish
- NCES district ID
- 2200330
- Math proficiency
- 30% ▼ -39.00%
- Reading proficiency
- 44% ▼ -33.00%
- Median HH income
- $44,700
- Composite
- 31.45/100
- National rank
- #5979
- State rank
- #29 of 98 in LA
Livability — Lake Charles
- Score
- 68/100
- State rank
- #95
- US rank
- #9820
Category grades
Schools grade is shown separately in the Schools card above.
Census & demographics
- Census place
- Lake Charles, LA
- County
- Calcasieu Parish · 170,889 people
- City population
- 133,538
- Metro
- Lake Charles, LA
- Population (ZIP)
- 40,482
- Household income
- $86,015
- Rent vs Own
- Severe rent burden
- 1328.0
Population outlook (Calcasieu County) Hauer SSP2
- Today (2025)
- 212,179 people
- By 2030
- 218,199 · +2.8%
- By 2040
- 228,486 · +7.7%
- By 2050
- 236,208 · +11.3%
- By 2075
- 251,696 · +18.6%
- By 2100
- 247,848 · +16.8%
Race, ethnicity, and origin ACS 2023
- Neighborhood character
- Predominantly White (79%)
- Race & ethnicity
- White 79% Black 10% Hispanic / Latino 6% Two or more races 6% Asian 3%
- Hispanic origin (detail)
- Mexican 2%
- Common ancestry
- Lithuanian 12% Italian 3% Slovak 2%
- Foreign-born
- 6% · Canada, Jamaica
- Languages at home
- 92% English-only · Spanish 4% Other Indo-European 2% Other Asian/Pacific 1%
Political lean MEDSL · Calcasieu
- 2024 margin
- Solid R (+39.6) · D 29.5% · R 69.0% · Other 1.5%
- 2008→2024 swing
- -15.0pp toward R · 2008: -24.6pp · 2024: -39.6pp
- All cycles
- 2024: R+39.6 2020: R+35.2 2016: R+33.3 2012: R+28.7 2008: R+24.6
Not yet ingested
- Civics
- —
Market trends
- HPI YoY
- ▼ -102.68%
- Current HPI
- 105.1903
- Rent YoY
- ▲ 15.10%
- Metro
- Lake Charles, LA
- State GDP YoY
- ▲ 3.29%
- F500 in state
- 10
Industry mix (Fortune 500 HQ in LA)
| Industry | F500 HQs | Revenue |
|---|---|---|
| Telecommunications | 2 | $23B |
|
||
| Utilities | 1 | $12B |
|
||
| Wholesale / Distribution | 1 | $5B |
|
||
| Advertising | 1 | $2B |
|
||
Price history
+548.9% since first listed6 events — show timeline
- 2026-04-04 Pending — SWLAR
- 2026-04-02 Listed $292,000 SWLAR
- 2024-04-03 Sold (Public Records) $135,000 Public Records
- 2022-04-26 Sold (MLS) — SWLAR
- 2022-03-14 Listed $107,000 SWLAR
- 2022-03-08 Sold (Public Records) $45,000 Public Records
Property tax history
+0.3%/yrLatest (2025): $1,389 · +2.4% YoY. Source: county tax records.
Cash-flow waterfall
monthlySold comps — $/sqft
last 12 mo · ≤1 miLoading sold comps…