1140 Mineral Springs Dr · Vinton, VA
Flood risk 1/10 · Minimal
- FEMA flood zone
- X (unshaded)
- Chance of flooding over 30 yrs
- 0.0%
- Est. flood insurance / yr
- $507 – $1,088
Fire risk 3/10 · Minor
- Est. fire insurance / yr
- $666 – $1,236
Heat risk 4/10 · Minor
- Hot days now (above 100°F)
- 7 days/yr
- Hot days in 30 yrs
- 18 days/yr
Wind risk 2/10 · Minimal
- Chance of severe wind over 30 yrs
- 1.0%
Air-quality risk 2/10 · Minimal
- Unhealthy air days now
- 1 days/yr
- Unhealthy air days in 30 yrs
- 2 days/yr
Risk factors via First Street. Map © Google.
Why this score? — see what drove the F grade
The composite is a weighted blend of 9 inputs, each scored 0–100. Each bar is that input's sub-score; the figure is the points it added to the 100-point composite (weight × sub-score).
- ARV discount +11.2/15.0
- Cash flow +7.1/30.0
- Schools +5.5/10.0
- Livability +4.0/5.0
- Rent growth +2.5/5.0
- Condition / age +2.5/5.0
- DSCR +1.3/10.0
- 1% rule +0.6/10.0
- Appreciation +0.0/10.0
$265,000
🖨 Deal sheet (PDF) 📄 Offer letter ✓ Due diligence
Listing remarks MLS
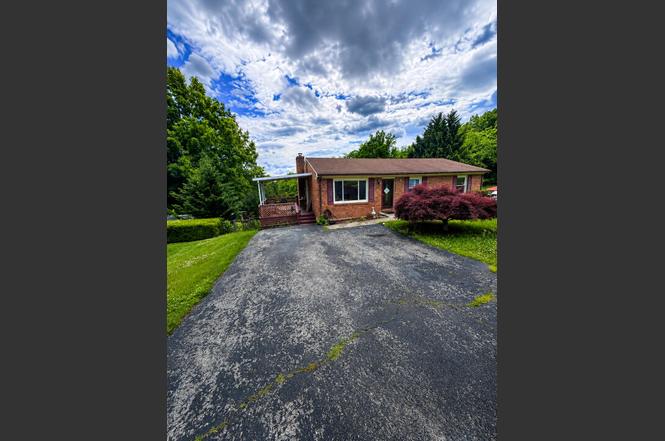
Nice Brick Ranch with Vinton address and Bedford County Taxes! Home features newer 30 year roof, new HVAC 2008, replacement windows, nice yard including fenced back yard with Work-shop/storage building. Nice landscaping. Side Deck and rear patio. Three bedrooms, full and half baths on entry level, dining room and nice kitchen. Downstairs you will find the full walk-out basement with den and masonry fireplace w/ gas logs. Large unfinished basement area for storage, work space with half bath. Home is Ready for your touches.
Key facts
- Expansive lot
- Brick ranch
- Serene setting
Tags
Property features AI
Exterior
- Parking: Four open parking spaces
- Utilities: Has heating; Has cooling
- Home design: Residential property
- Construction: Built in 1975
- Exterior features: Rear porch; Side porch; Approximately 0.47-acre lot
Interior
- Bedrooms: Three bedrooms, all on the main level
- Flooring: Carpet; Vinyl
- Bathrooms: One full bathroom; One half bathroom; One main-level bathroom
- Heating & cooling: Heat pump (electric) for heating and cooling
- Interior features: Five total rooms; Fiberglass and wood doors; Insulated, tilt-in windows
Neighborhood map
What this means for you Summary
Snapshot
- This is a 3-bed/0.5-bath single-family listed at $265k.
Deal economics
- At list price, monthly cash flow is $-375 ($-5k/yr) — negative.
- To cash-flow at today's rent, offer at most $199k (25.0% below list).
- To meet the 1% rule (rent ≥ 1% of price), the offer needs to be $150k (43.5% below list).
- Recommended offer: $150k (43.5% below list) — sets the bar for 1% rule.
Location & tenants
- Location reads 80/100 on livability (#61 in VA, #1,742 nationally) — a professional / high-income tenant draw. Strengths: cost of living A+, housing A+, health & safety A+; Watch: employment C-, amenities F, commute F.
- Bedford County Public School District (rural): math 55% / reading 73% proficiency, ranked #41 of 131 in VA (top 31%) — acceptable for families but not a draw, mixed tenant base, ~2y average lease.
- Zoned schools: Stewartsville Elementary (math 57% / reading 72%, grade B, #416 of 1,108 statewide, top 41%, 330 students, 87% FRL); Staunton River Middle (math 45% / reading 65%, grade B-, #189 of 342 statewide, top 56%, 627 students, 86% FRL); Staunton River High (math 39% / reading 66%, grade C-, #293 of 319 statewide, top 92%, 889 students, 69% FRL) — zoned schools average 81% FRL vs 30% district-wide (50 pts higher); higher-poverty schools than district average — tighter screening recommended.
- Market conditions: 158 active listings in the ZIP; 294 units permitted in Bedford County in 2024 (0 in 5+ unit buildings).
Forward outlook
- Local home prices are declining (-3.0%/yr); year-one equity from $2k of loan paydown is wiped out by about $8k of value loss. Plan a longer hold.
- Bedford County population projected at +8% by 2050 — modest demand growth; plan on rents tracking national, not racing it.
Negotiation context
- Only 11 days on market — expect competitive offers; lowballing is unlikely to land.
- 2 sale attempts since 6y ago with the ask held roughly flat each time — persistent listings suggest the price (not the market) is what's stuck; bring a comps-based counter.
- Current owner paid $150k; list at $265k implies a 77% gain — meaningful room to come down on a strong offer.
Questions for the listing agent
- What do current leases actually rent for vs. the listed asking? Can we see a recent rent roll and the last 12 months of T-12 income?
- Built in 1975 — when were the roof, HVAC, electrical panel, plumbing, and water heater last replaced?
- Is there a deadline driving the sale (1031 exchange, divorce, estate, relocation)? That informs how much negotiation room exists.
- Schools are A-rated — typically a magnet for longer-tenancy family renters. What's the average tenant stay here, and is there a school-zone premium baked into asking?
- The area grade is low — what's the realistic commute time and amenity access for the typical tenant pool here? Any planned neighborhood developments (good or bad) we should know about?
- What's the average days-on-market for RENTAL listings here right now (not sales)? A rising rental-DOM trend means longer vacancies and softer asking-rent achievability than the comps imply.
- What's the recent tenant-quality profile in this submarket — average credit score on applications, eviction rate, late-payment / NSF rate, and stable-employment percentage? A property-management company in the area should have these aggregated.
- How much new for-sale + rental construction is in the pipeline within 1–3 miles? Heavy new supply typically softens prices + rents 12–24 months out; constrained supply supports both.
Investment metrics
- 1% rule
- 0.56% ✗
- Cap rate
- 4.59%
- Cash-on-cash
- -6.07%
- DSCR
- 0.73
- GRM
- 14.8
CMA / ARV
- ARV (on-the-fly)
- $288,684
- Comps found
- 1
Show comp detail 1 sale within ~0.75 mi
| Address | Dist | Beds/Ba | Sqft | Sold | Price | $/sf | Match |
|---|---|---|---|---|---|---|---|
| 2615 Queens Way | 0.70mi | 3/2.0 | 1,338 (+13%) | 3mo | $325,000 | $243 | 38 |
Match score weights: distance 35% · size 25% · config 20% · recency 20%. Top-matched comps best support the ARV.
Projected returns pro-forma
-3.0% appreciation · 3.0% rent growth · sell at horizon
- IRR
- -26.8%
- Equity multiple
- 0.10×
- Total profit
- $-66,995
- Equity at exit
- $39,512
- IRR
- -24.6%
- Equity multiple
- -0.21×
- Total profit
- $-89,715
- Equity at exit
- $22,912
Cash invested: $74,200 (down + closing). Projections, not guarantees.
Landlord ↔ Tenant lean methodology
- Overall (STATE)
- 55 Moderately Landlord-Leaning
- State Virginia
- 55 Moderately Landlord-Leaning · D+2
- County
- — inherits STATE
- City
- — inherits STATE
ZIP-level market 24179
- Active inventory
- 158
- Price-to-rent
- 14.8×
Monthly cashflow live
- Estimated rent
- $1,496 medium interval (Pro) →
- Mortgage (P&I)
- −$1,390
- Tax from tax record
- −$57 /mo · $689/yr
- Insurance
- −$110
- HOA
- −$0
- Vacancy / Maint / Mgmt
- −$314
- Net cashflow
- $-375
Break-even live
Sensitivity live
| Price | -10% $-225 | -5% $-300 | +0% $-375 | +5% $-450 | +10% $-525 |
|---|---|---|---|---|---|
| Rent | -10% $-494 | -5% $-434 | +0% $-375 | +5% $-316 | +10% $-257 |
| Rate | -1.0pp $-242 | -0.5pp $-308 | base $-375 | +0.5pp $-444 | +1.0pp $-514 |
UW: 25.0% down · 7.5% · 30yr · 1.5% tax · 5.0% vac · 8.0% maint · 8.0% mgmt
Financing live
Cash to close
- Down payment
- $66,250
- Closing costs
- $7,950
- Reserves months
- —
- Total cash needed
- —
Loan-product check · same deal, 3 products live
Conventional
25% down · 7.5% · 30yr
- Down + closing
- —
- Monthly P&I
- —
- Monthly cashflow
- —
- DSCR
- —
- Eligible?
- —
Personal DTI + credit; lowest rate.
DSCR
20% down · 8.5% · 30yr
- Down + closing
- —
- Monthly P&I
- —
- Monthly cashflow
- —
- DSCR
- —
- Eligible?
- —
No personal income docs; deal must DSCR.
Hard money
10% down · 12.0% · 12mo
- Down + closing
- —
- Monthly P&I
- —
- Monthly cashflow
- —
- DSCR
- —
- Eligible?
- —
Short-term bridge; refi at stabilization.
Listing history 9 events
-
2026-06-22days on market $265,000 Active 11 DOM
-
2026-06-19days on market $265,000 Active 9 DOM
-
2026-06-18days on market $265,000 Active 8 DOM
-
2026-06-17days on market $265,000 Active 7 DOM
-
2026-06-16days on market $265,000 Active 6 DOM
-
2026-06-15days on market $265,000 Active 5 DOM
-
2026-06-14days on market $265,000 Active 3 DOM
-
2026-06-13remarks 536-char remark
-
2026-06-13$265,000 Active 2 DOM
ⓘ Source: listings_history table (triggers on properties + properties_extension) + one-shot
backfill from property_details.listing_events for pre-trigger history.
Tax reassessment forecast VA · Resets to sale price
- Current annual tax
- $689 · $57/mo
- Projected year-2 tax
- $2,173 · $181/mo
- Expected delta
- +$1,484/yr (+$124/mo · 215.3%)
ⓘ Screening estimate from a state-policy table — verify with the county assessor before closing.
Climate risk First Street
- Flood 1/10 Low FEMA zone X (unshaded) · 0% chance over 30 yrs
- Wildfire 3/10 Moderate
- Heat 4/10 Moderate 7 d/yr ≥100°F today · 18 d/yr by 30 yrs out
- Wind 2/10 Low 100% chance of damaging wind over 30 yrs
- Air quality 2/10 Low 1 unhealthy d/yr today · 2 by 30 yrs out
Nearby sold comps map
Loading sold comps map…
Walkable amenities ~0.75 mi
Loading nearby amenities…
Taxation est. · year 1
- Rental income
- $17,957
- − Mortgage interest
- −$14,844
- − Property taxes
- −$689
- − Insurance
- −$1,325
- − Repairs & maintenance
- −$1,437
- − Management
- −$1,437
- − Depreciation
- −$7,709
- Taxable loss
- −$9,484
- Est. tax savings @ 24.0%
- +$2,276
- After-tax cash flow
- $-2,228/yr
For passive investors: Depreciation is non-cash, so a rental often shows a tax loss while cash-flowing — sheltering income. Rental losses are passive: they offset passive income freely, and up to $25,000/yr can offset ordinary (W-2) income if you actively participate and your MAGI is under $100k (phasing out to $0 by $150k); unused losses carry forward. On sale, claimed depreciation is recaptured at up to 25%, and gains may owe capital-gains tax (a 1031 exchange can defer both). Figures are a year-1 estimate at your 24.0% rate — not tax advice; consult a CPA.
Schools (NCES district)
- District
- Bedford County Public School District
- NCES district ID
- 5100360
- Math proficiency
- 55% ▼ -29.00%
- Reading proficiency
- 73% ▼ -7.00%
- Median HH income
- $56,288
- Composite
- 54.92/100
- National rank
- #1310
- State rank
- #41 of 131 in VA
Livability — Vinton
- Score
- 80/100
- State rank
- #61
- US rank
- #1742
Category grades
Schools grade is shown separately in the Schools card above.
Census & demographics
- Population (ZIP)
- 18,834
Population outlook (Bedford County) Hauer SSP2
- Today (2025)
- 83,194 people
- By 2030
- 85,499 · +2.8%
- By 2040
- 88,834 · +6.8%
- By 2050
- 90,060 · +8.3%
- By 2075
- 94,131 · +13.1%
- By 2100
- 89,832 · +8.0%
Race, ethnicity, and origin ACS 2023
- Neighborhood character
- Predominantly White (90%)
- Race & ethnicity
- White 90% Two or more races 4% Black 3% Hispanic / Latino 3%
- Common ancestry
- Slovak 2% Italian 2% Lithuanian 1%
- Foreign-born
- 2% · Canada
- Languages at home
- 97% English-only · Spanish 2%
Political lean MEDSL · Bedford
- 2024 margin
- Solid R (+50.4) · D 24.4% · R 74.8%
- 2008→2024 swing
- -13.0pp toward R · 2008: -37.4pp · 2024: -50.4pp
- All cycles
- 2024: R+50.4 2020: R+48.1 2016: R+49.4 2012: R+45.0 2008: R+37.4
Not yet ingested
- Civics
- —
Market trends
- HPI YoY
- ▼ -117.89%
- Current HPI
- 186.9964
- Rent YoY
- —
- Metro
- —
- State GDP YoY
- ▲ 2.40%
- F500 in state
- 50
Industry mix (Fortune 500 HQ in VA)
| Industry | F500 HQs | Revenue |
|---|---|---|
| Aerospace / Defense | 4 | $236B |
|
||
| Technology / Defense | 3 | $32B |
|
||
| Financial Services | 2 | $176B |
|
||
| Utilities | 2 | $27B |
|
||
| Insurance | 2 | $25B |
|
||
| Technology | 2 | $15B |
|
||
Price history
+82.8% since first listed3 events — show timeline
- 2026-06-10 Listed $265,000 MLSRV
- 2020-06-15 Sold (MLS) $150,000 MLSRV
- 2020-04-28 Listed $144,950 MLSRV
Property tax history
-0.2%/yrLatest (2025): $689 · +0.0% YoY. Source: county tax records.
Cash-flow waterfall
monthlySold comps — $/sqft
last 12 mo · ≤1 miLoading sold comps…