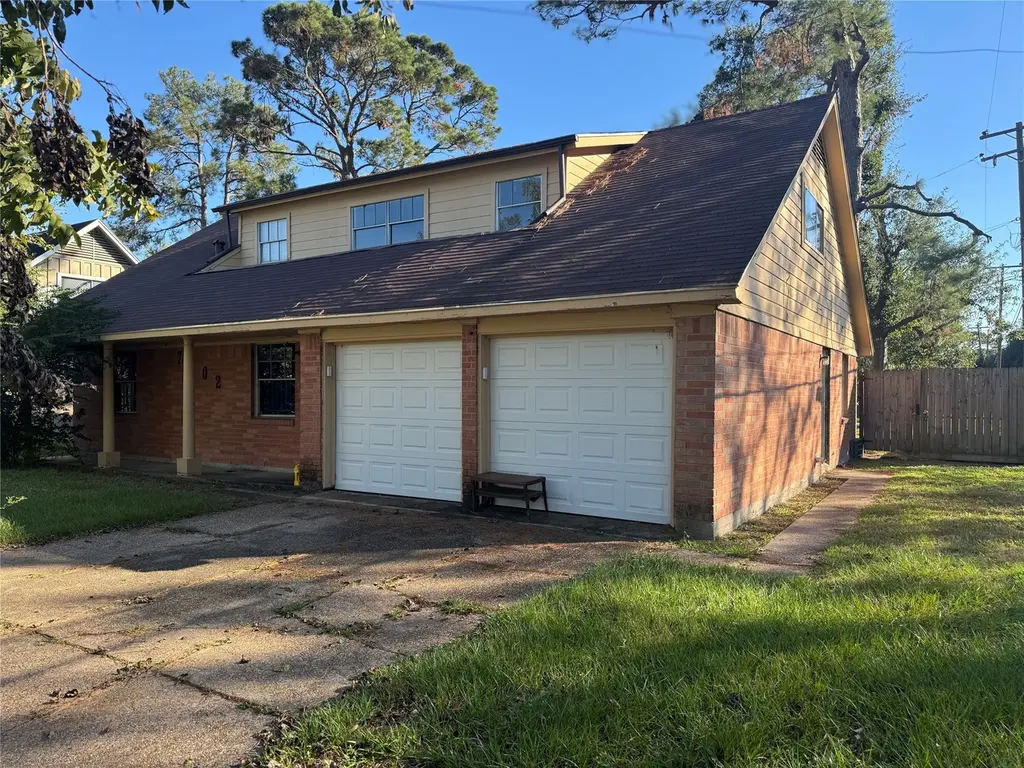
7202 Orlando St · Houston, TX
Flood risk 1/10 · Minimal
- FEMA flood zone
- X (unshaded)
- Chance of flooding over 30 yrs
- 0.0%
- Est. flood insurance / yr
- $507 – $1,088
Fire risk 2/10 · Minimal
- Est. fire insurance / yr
- $1,222 – $2,270
Heat risk 9/10 · Severe
- Hot days now (above 110°F)
- 7 days/yr
- Hot days in 30 yrs
- 25 days/yr
Wind risk 9/10 · Severe
- Chance of severe wind over 30 yrs
- 99.0%
Air-quality risk 3/10 · Minor
- Unhealthy air days now
- 3 days/yr
- Unhealthy air days in 30 yrs
- 3 days/yr
Risk factors via First Street. Map © Google.
Why this score? — see what drove the B- grade
The composite is a weighted blend of 9 inputs, each scored 0–100. Each bar is that input's sub-score; the figure is the points it added to the 100-point composite (weight × sub-score).
- Cash flow +21.7/30.0
- ARV discount +14.1/15.0
- Appreciation +9.3/10.0
- DSCR +6.9/10.0
- 1% rule +6.4/10.0
- Livability +3.7/5.0
- Schools +2.7/10.0
- Rent growth +2.6/5.0
- Condition / age +2.5/5.0
$170,000
🖨 Deal sheet (PDF) 📄 Offer letter ✓ Due diligence
Listing remarks MLS
Great stater home or investment property. Home sits on a large corner lot, all bedrooms up with the possibility of a fourth bedroom on first floor. Kitchen open to dining room, two car garage and more. Room size and sqft are approximate buyer and buyers agent to verify. Being sold AS IS.
Key facts
- Large corner lot
- 7,810 sq ft lot
- 2 garage spots
Tags
Neighborhood map
What this means for you Summary
Snapshot
- This is a 4-bed/2.0-bath single-family listed at $170k.
Deal economics
- At list price, monthly cash flow is $261 ($3k/yr) — positive.
- The deal already cash-flows at list — no discount required.
- Meets the 1% rule at list price ($2k rent vs $170k).
- Recommended offer: $150k (12.0% below list) — sets the bar for market timing.
- Cap rate 8.1% vs local median 3.2% in Houston — top-decile yield for the area; either an underpriced asset or a hidden risk that comps aren't pricing in. Stress-test before assuming the spread holds.
Location & tenants
- Location reads 74/100 on livability (#184 in TX, #4,771 nationally) — a middle-class / working-renter tenant base. Strengths: amenities A+, cost of living A+, housing A+; Watch: crime F.
- Houston ISD (urban): math 27% / reading 35% proficiency, ranked #593 of 826 in TX (top 72%) — families likely to look elsewhere, expect single-tenant / working-renter base with shorter leases; 71% free/reduced lunch — lower-income household profile, screen leases tightly.
- Zoned schools: Shadydale El (math 11% / reading 20%, grade F, #3,990 of 4,322 statewide, top 93%, 631 students, 95% FRL); Forest Brook Middle (math 12% / reading 14%, grade F, #1,609 of 1,662 statewide, top 97%, 613 students, 98% FRL); North Forest H S (math 13% / reading 18%, grade F, #1,505 of 1,632 statewide, top 92%, 974 students, 97% FRL) — zoned schools average 97% FRL vs 71% district-wide (26 pts higher); higher-poverty schools than district average — tighter screening recommended.
- Zoned-school proficiency averages 15% at this address vs 31% district-wide (-16 pts) — the specific schools serving this property underperform the Houston ISD average; the district grade overstates school quality for this exact location.
- Market conditions: Rents flat; 376 active listings in the ZIP; 26 comparable units currently listed for rent nearby; rentals at typical pace (median 23d on market — plan ~3-4 weeks tenant-placement turnaround); 29,883 units permitted in Harris County in 2024 (8,621 in 5+ unit buildings).
Forward outlook
- In year one you build about $16k of equity ($1k loan paydown + $15k appreciation (8.7% local appreciation)).
- Harris County population projected at +47% by 2050 — long-run rental-demand tailwind backs the buy-and-hold thesis.
- At projected returns (8.7% appreciation + 0.4% rent growth), your $48k cash investment doubles in ~3 years — after that, you're playing with house money.
- By year 3, paydown + projected appreciation supports a ~$40k cash-out refi (75% LTV) — recoverable capital for the next deal without selling this one.
Negotiation context
- It's been on market 208 days — a 12% lower offer ($150k) is reasonable based on typical stale-listing flexibility.
- 3 sale attempts since 17y ago with the ask held roughly flat each time — persistent listings suggest the price (not the market) is what's stuck; bring a comps-based counter.
Risks & watch-outs
- Climate carrying-cost: severe wind risk, 99% chance of damaging wind over 30y; extreme-heat days projected 7→25/yr by 2055 (HVAC capex compounding) — expect insurance premiums to compound above CPI over the hold.
Questions for the listing agent
- It's been on market 208 days. Have you received any prior offers? Is the seller open to a 12% concession, seller financing, or rate buy-down credit?
- Built in 1965 — when were the roof, HVAC, electrical panel, plumbing, and water heater last replaced?
- Why hasn't it sold? Are there any deal-killer items the seller is aware of (foundation, flood, title, zoning, code violations)?
- Is there a deadline driving the sale (1031 exchange, divorce, estate, relocation)? That informs how much negotiation room exists.
- Schools are D-rated, which usually means shorter tenancies and higher turnover. Who's the typical renter profile here, and what's been the actual vacancy rate?
- Crime grade is F in this area — have there been break-ins, vandalism, or insurance claims at this property in the last 3 years? What carrier currently insures it and at what premium?
- What's the average days-on-market for RENTAL listings here right now (not sales)? A rising rental-DOM trend means longer vacancies and softer asking-rent achievability than the comps imply.
- What's the recent tenant-quality profile in this submarket — average credit score on applications, eviction rate, late-payment / NSF rate, and stable-employment percentage? A property-management company in the area should have these aggregated.
- How much new for-sale + rental construction is in the pipeline within 1–3 miles? Heavy new supply typically softens prices + rents 12–24 months out; constrained supply supports both.
Investment metrics
- 1% rule
- 1.14% ✓
- Cap rate
- 8.14%
- Cash-on-cash
- 6.59%
- DSCR
- 1.29
- GRM
- 7.3
CMA / ARV
- ARV (median comp)
- $198,978
- List price
- $170,000
- Delta
- -14.56%
- Verdict
- UNDERPRICED
- Comps
- 20 within 1.0 mi
Show comp detail 12 sales within ~0.75 mi
| Address | Dist | Beds/Ba | Sqft | Sold | Price | $/sf | Match |
|---|---|---|---|---|---|---|---|
| 7302 Marilyn Ln | 0.09mi | 4/2.0 | 1,811 (-8%) | 0mo | $220,000 | $121 | 81 |
| 7226 Gore Dr | 0.22mi | 4/1.5 | 2,100 (+6%) | 2mo | $205,000 | $98 | 76 |
| 7706 Langley Rd | 0.62mi | 4/2.0 | 2,006 (+1%) | 2mo | $150,000 | $75 | 67 |
| 10502 Hollyglen Dr | 0.22mi | 4/2.0 | 1,719 (-13%) | 4mo | $182,900 | $106 | 64 |
| 7411 Woodson Valley Ct | 0.51mi | 3/2.5 (-1) | 1,992 (+1%) | 14mo | $235,000 | $118 | 56 |
| 7310 Wiley Rd | 0.44mi | 4/2.5 | 2,120 (+7%) | 15mo | $236,900 | $112 | 53 |
| 10731 Prillerman Trails Dr | 0.46mi | 3/2.5 (-1) | 1,766 (-11%) | 3mo | $240,000 | $136 | 51 |
| 10317 Blades St | 0.29mi | 3/2.0 (-1) | 1,728 (-13%) | 14mo | $189,990 | $110 | 49 |
| 5820 Tautenhahn Rd | 0.56mi | 4/2.5 | 1,800 (-9%) | 12mo | $335,000 | $186 | 47 |
| 7430 Pickett Orchard Dr | 0.45mi | 3/2.5 (-1) | 1,846 (-7%) | 17mo | $239,900 | $130 | 46 |
| 5618 Briarwick Ln | 0.56mi | 3/2.0 (-1) | 1,725 (-13%) | 5mo | $180,000 | $104 | 43 |
| 7721 Navasota St | 0.65mi | 3/2.0 (-1) | 1,684 (-15%) | 9mo | $165,000 | $98 | 32 |
Match score weights: distance 35% · size 25% · config 20% · recency 20%. Top-matched comps best support the ARV.
Projected returns pro-forma
8.65% appreciation · 0.44% rent growth · sell at horizon
- IRR
- 25.2%
- Equity multiple
- 2.87×
- Total profit
- $89,011
- Equity at exit
- $136,727
- IRR
- 21.8%
- Equity multiple
- 5.99×
- Total profit
- $237,540
- Equity at exit
- $278,961
Cash invested: $47,600 (down + closing). Projections, not guarantees.
Landlord ↔ Tenant lean methodology
- Overall (STATE)
- 87 Strongly Landlord-Friendly
- State Texas
- 87 Strongly Landlord-Friendly · R+5
- County
- — inherits STATE
- City
- — inherits STATE
ZIP-level market 77016
- Home prices YoY
- 2.8%
- Rents YoY
- 0.4%
- Active inventory
- 376
- Price-to-rent
- 7.3×
Monthly cashflow live
- Estimated rent
- $1,941 high interval (Pro) →
- Mortgage (P&I)
- −$891
- Tax from tax record
- −$310 /mo · $3,718/yr
- Insurance
- −$71
- HOA
- −$0
- Vacancy / Maint / Mgmt
- −$408
- Net cashflow
- $261
Break-even live
Sensitivity live
| Price | -10% $358 | -5% $310 | +0% $261 | +5% $213 | +10% $165 |
|---|---|---|---|---|---|
| Rent | -10% $108 | -5% $185 | +0% $261 | +5% $338 | +10% $415 |
| Rate | -1.0pp $347 | -0.5pp $305 | base $261 | +0.5pp $217 | +1.0pp $173 |
UW: 25.0% down · 7.5% · 30yr · 1.5% tax · 5.0% vac · 8.0% maint · 8.0% mgmt
Financing live
Cash to close
- Down payment
- $42,500
- Closing costs
- $5,100
- Reserves months
- —
- Total cash needed
- —
Loan-product check · same deal, 3 products live
Conventional
25% down · 7.5% · 30yr
- Down + closing
- —
- Monthly P&I
- —
- Monthly cashflow
- —
- DSCR
- —
- Eligible?
- —
Personal DTI + credit; lowest rate.
DSCR
20% down · 8.5% · 30yr
- Down + closing
- —
- Monthly P&I
- —
- Monthly cashflow
- —
- DSCR
- —
- Eligible?
- —
No personal income docs; deal must DSCR.
Hard money
10% down · 12.0% · 12mo
- Down + closing
- —
- Monthly P&I
- —
- Monthly cashflow
- —
- DSCR
- —
- Eligible?
- —
Short-term bridge; refi at stabilization.
Rent comps 26 comps
| Address | Beds | Baths | Sqft | Rent | $/sqft | DOM | Units | Dist |
|---|---|---|---|---|---|---|---|---|
| 7314 Saunders Rd Houston, TX | 4.0 | 2.0 | 1339 | $1,723 | $1.29 | 16d | 1 | 0.10mi |
| 7325 Boggess Rd Houston, TX | 3.0 | 2.0 | 1568 | $1,850 | $1.18 | 18d | 1 | 0.33mi |
| 7325 Boggess Rd Houston, TX | 3.0 | 2.0 | 1568 | $1,850 | $1.18 | 45d | 1 | 0.33mi |
| 10221 Bretton Dr Houston, TX | 3.0 | 1.0 | 1650 | $1,650 | $1.00 | 0d | 1 | 0.46mi |
| 10221 Bretton Dr Houston, TX | 3.0 | 1.0 | 1350 | $1,700 | $1.26 | 26d | 1 | 0.46mi |
| 10750 Nyla Spring St Houston, TX | 3.0 | 2.0 | 1500 | $1,975 | $1.32 | 20d | 1 | 0.59mi |
| 7726 Spinet St Houston, TX | 4.0 | 2.0 | 1456 | $2,375 | $1.63 | 9d | 1 | 0.65mi |
| 7426 Bigwood St Houston, TX | 4.0 | 2.0 | 1997 | $1,850 | $0.93 | 16d | 1 | 0.70mi |
| 10329 Wicklowe St Houston, TX | 3.0 | 2.0 | 1266 | $1,400 | $1.11 | 22d | 1 | 0.70mi |
| 10314 Woodwick St Unit 1283919P Houston, TX | 3.0 | 2.5 | 1496 | $3,865 | $2.58 | 0d | 1 | 0.72mi |
| 10474 Red Orchid Dr Houston, TX | 3.0 | 2.5 | 1553 | $1,875 | $1.21 | 26d | 1 | 0.87mi |
| 10708 Lavender Cotton Ln Houston, TX | 3.0 | 2.0 | 1406 | $2,150 | $1.53 | 45d | 1 | 1.02mi |
| 8003 Alpine Bearberry Dr Houston, TX | 3.0–4.0 | 2.0–2.5 | 1696 | $2,520 | $1.49 | 9d | 1 | 1.08mi |
| 6823 Hanley Ln Houston, TX | 3.0 | 2.0 | 1303 | $1,610 | $1.24 | 7d | 1 | 1.09mi |
| 9410 Firnat St Unit A Houston, TX | 3.0 | 2.5 | 1500 | $1,900 | $1.27 | 1d | 1 | 1.18mi |
| 9410 Firnat St Unit B Houston, TX | 3.0 | 2.5 | 1500 | $1,900 | $1.27 | 45d | 1 | 1.18mi |
| 9326 Firnat St Unit B Houston, TX | 3.0 | 2.5 | 1902 | $1,900 | $1.00 | 45d | 1 | 1.23mi |
| 9328 Firnat St Unit B Houston, TX | 3.0 | 2.5 | 1902 | $1,900 | $1.00 | 45d | 1 | 1.23mi |
| 9324 Firnat St Unit B Houston, TX | 3.0 | 2.5 | 1600 | $1,900 | $1.19 | 24d | 1 | 1.23mi |
| 9320 Firnat St Unit A Houston, TX | 3.0 | 2.5 | 1900 | $1,850 | $0.97 | 9d | 1 | 1.23mi |
| 9314 Sundown Dr Unit A Houston, TX | 3.0 | 2.5 | 1608 | $1,675 | $1.04 | 1d | 1 | 1.26mi |
| 11235 Lemond Dr Houston, TX | 3.0 | 1.0 | 1368 | $1,450 | $1.06 | 24d | 1 | 1.28mi |
| 8102 Rhobell St Unit A Houston, TX | 4.0 | 3.5 | 1567 | $1,750 | $1.12 | 45d | 1 | 1.36mi |
| 7223 Valmont Dr Houston, TX | 4.0 | 2.0 | 1546 | $1,595 | $1.03 | 45d | 1 | 1.40mi |
| 8214 Parker Rd Unit B Houston, TX | 3.0 | 2.0 | 1608 | $1,560 | $0.97 | 9d | 1 | 1.46mi |
| 9422 Sandra St Unit B Houston, TX | 3.0 | 2.5 | 1461 | $1,875 | $1.28 | 45d | 1 | 1.47mi |
Listing history 20 events
-
2026-06-21days on market $170,000 Active 208 DOM
-
2026-06-18days on market $170,000 Active 205 DOM
-
2026-06-17days on market $170,000 Active 204 DOM
-
2026-06-16days on market $170,000 Active 203 DOM
-
2026-06-15days on market $170,000 Active 202 DOM
-
2026-06-13days on market $170,000 Active 200 DOM
-
2026-06-10days on market $170,000 Active 196 DOM
-
2026-06-08days on market $170,000 Active 195 DOM
-
2026-06-07days on market $170,000 Active 194 DOM
-
2026-06-04days on market $170,000 Active 191 DOM
-
2026-06-01days on market $170,000 Active 188 DOM
-
2026-05-31days on market $170,000 Active 187 DOM
-
2025-11-25$170,000 Active 288-char remark
Show marketing remark (288 chars)
Great stater home or investment property. Home sits on a large corner lot, all bedrooms up with the possibility of a fourth bedroom on first floor. Kitchen open to dining room, two car garage and more. Room size and sqft are approximate buyer and buyers agent to verify. Being sold AS IS.
-
2025-05-31historical
-
2025-04-27price $175,000
-
2024-12-11$189,000 Active
-
2009-08-18soldstatus
-
2009-07-20historical
-
2009-03-18$36,000
-
1995-04-12soldstatus
ⓘ Source: listings_history table (triggers on properties + properties_extension) + one-shot
backfill from property_details.listing_events for pre-trigger history.
Tax reassessment forecast TX · Resets to sale price
- Current annual tax
- $3,718 · $310/mo
- Projected year-2 tax
- $3,718 · $310/mo
- Expected delta
- $0/yr ($0/mo · 0.0%)
ⓘ Screening estimate from a state-policy table — verify with the county assessor before closing.
Climate risk First Street
- Flood 1/10 Low FEMA zone X (unshaded) · 0% chance over 30 yrs
- Wildfire 2/10 Low
- Heat 9/10 Extreme 7 d/yr ≥110°F today · 25 d/yr by 30 yrs out
- Wind 9/10 Extreme 99% chance of damaging wind over 30 yrs
- Air quality 3/10 Moderate 3 unhealthy d/yr today · 3 by 30 yrs out
Nearby sold comps map
Loading sold comps map…
Walkable amenities ~0.75 mi
Loading nearby amenities…
Taxation est. · year 1
- Rental income
- $23,294
- − Mortgage interest
- −$9,523
- − Property taxes
- −$3,718
- − Insurance
- −$850
- − Repairs & maintenance
- −$1,864
- − Management
- −$1,864
- − Depreciation
- −$4,945
- Taxable income
- $531
- Est. tax owed @ 24.0%
- −$128
- After-tax cash flow
- $3,009/yr
For passive investors: Depreciation is non-cash, so a rental often shows a tax loss while cash-flowing — sheltering income. Rental losses are passive: they offset passive income freely, and up to $25,000/yr can offset ordinary (W-2) income if you actively participate and your MAGI is under $100k (phasing out to $0 by $150k); unused losses carry forward. On sale, claimed depreciation is recaptured at up to 25%, and gains may owe capital-gains tax (a 1031 exchange can defer both). Figures are a year-1 estimate at your 24.0% rate — not tax advice; consult a CPA.
Schools (NCES district)
- District
- Houston ISD
- NCES district ID
- 4823640
- Math proficiency
- 27% ▼ -18.00%
- Reading proficiency
- 35% ▼ -6.00%
- Median HH income
- $46,054
- Composite
- 26.63/100
- National rank
- #7173
- State rank
- #593 of 826 in TX
Livability — Houston
- Score
- 74/100
- State rank
- #184
- US rank
- #4771
Category grades
Schools grade is shown separately in the Schools card above.
Census & demographics
- Census place
- Houston, TX
- County
- Harris County · 4,702,590 people
- City population
- 3,226,434
- Metro
- Houston-The Woodlands-Sugar Land, TX
- Population (ZIP)
- 29,841
- Household income
- $47,677
- Rent vs Own
- Severe rent burden
- 1297.0
Population outlook (Harris County) Hauer SSP2
- Today (2025)
- 5,571,493 people
- By 2030
- 6,089,821 · +9.3%
- By 2040
- 7,142,806 · +28.2%
- By 2050
- 8,185,864 · +46.9%
- By 2075
- 10,574,329 · +89.8%
- By 2100
- 12,109,958 · +117.4%
Race, ethnicity, and origin ACS 2023
- Neighborhood character
- Majority Black (56%)
- Race & ethnicity
- Black 56% Hispanic / Latino 42% Two or more races 28%
- Hispanic origin (detail)
- Mexican 34%
- Foreign-born
- 18% · Canada
- Languages at home
- 61% English-only · Spanish 37%
Political lean MEDSL · Harris
- 2024 margin
- Lean D (+5.5) · D 52.0% · R 46.4% · Other 1.6%
- 2008→2024 swing
- +3.9pp toward D · 2008: 1.6pp · 2024: 5.5pp
- All cycles
- 2024: D+5.5 2020: D+13.3 2016: D+12.4 2012: D+0.1 2008: D+1.6
Not yet ingested
- Civics
- —
Market trends
- HPI YoY
- ▲ 8.65%
- Current HPI
- 315.6765
- Rent YoY
- ▲ 0.44%
- Metro
- Houston-The Woodlands-Sugar Land, TX
- State GDP YoY
- ▲ 3.95%
- F500 in state
- 110
Industry mix (Fortune 500 HQ in TX)
| Industry | F500 HQs | Revenue |
|---|---|---|
| Energy | 16 | $1,198B |
|
||
| Technology | 5 | $198B |
|
||
| Engineering / Construction | 4 | $72B |
|
||
| Energy Services | 3 | $60B |
|
||
| Utilities | 3 | $41B |
|
||
| Healthcare | 2 | $330B |
|
||
Price history
+372.2% since first listed8 events — show timeline
- 2025-11-25 Listed $170,000 HARMLS
- 2025-05-31 Listing Removed — HARMLS
- 2025-04-27 Price Changed $175,000 HARMLS
- 2024-12-11 Listed $189,000 HARMLS
- 2009-08-18 Sold (MLS) — HARMLS
- 2009-07-20 Listing Removed — HARMLS
- 2009-03-18 Listed $36,000 HARMLS
- 1995-04-12 Sold (Public Records) — Public Records
Property tax history
+3.6%/yrLatest (2025): $3,718 · -1.1% YoY. Source: county tax records.
Cash-flow waterfall
monthlySold comps — $/sqft
last 12 mo · ≤1 miLoading sold comps…