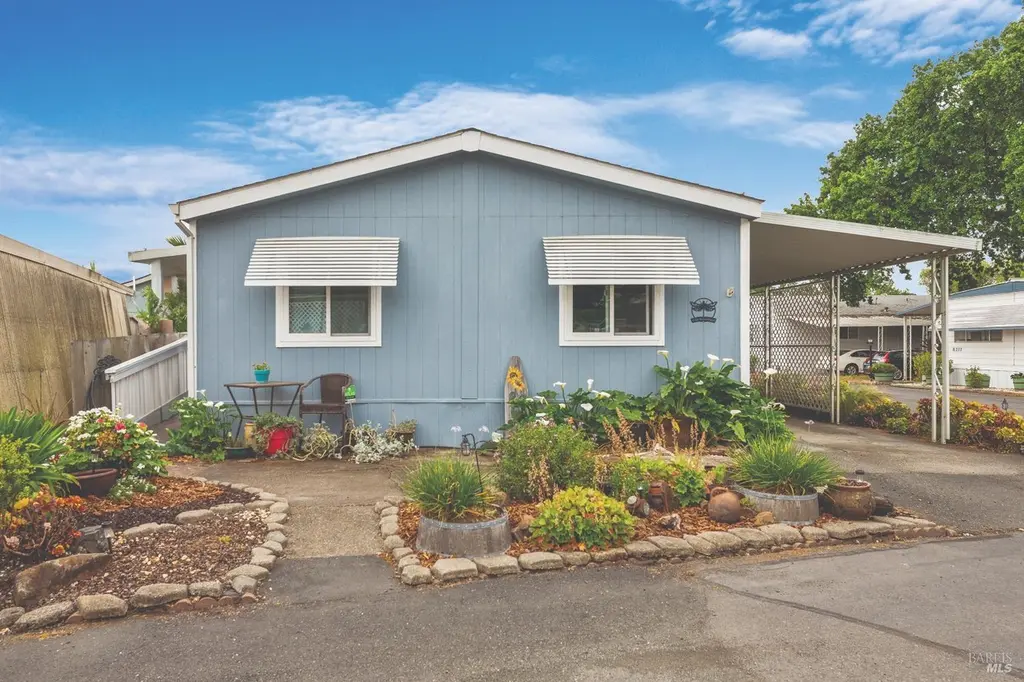
1138 Broadleaf Ln · Windsor, CA
Flood risk 1/10 · Minimal
- FEMA flood zone
- X (unshaded)
- Chance of flooding over 30 yrs
- 0.0%
- Est. flood insurance / yr
- $507 – $1,088
Fire risk 5/10 · Moderate
- Est. fire insurance / yr
- $659 – $1,223
Heat risk 4/10 · Minor
- Hot days now (above 92°F)
- 7 days/yr
- Hot days in 30 yrs
- 16 days/yr
Wind risk 1/10 · Minimal
- Chance of severe wind over 30 yrs
- —
Air-quality risk 9/10 · Severe
- Unhealthy air days now
- 18 days/yr
- Unhealthy air days in 30 yrs
- 20 days/yr
Risk factors via First Street. Map © Google.
Why this score? — see what drove the B grade
The composite is a weighted blend of 9 inputs, each scored 0–100. Each bar is that input's sub-score; the figure is the points it added to the 100-point composite (weight × sub-score).
- Cash flow +30.0/30.0
- 1% rule +10.0/10.0
- DSCR +10.0/10.0
- ARV discount +9.7/15.0
- Livability +3.6/5.0
- Rent growth +2.5/5.0
- Schools +2.5/10.0
- Condition / age +2.5/5.0
- Appreciation +0.0/10.0
$179,000
🖨 Deal sheet 📄 Offer letter ✓ Due diligence
Listing remarks MLS
Adorable 3-bedroom, 2-bath single-story manufactured home offering 1,056 sq ft of comfortable living in the desirable Windsor Mobile Country Club. Built in 1992, this home features an open floor plan that creates a bright and welcoming living space. The primary bedroom includes a walk-in closet, an updated bathroom, and direct access to the backyardperfect for easy indoor-outdoor living. Corner lot, sunny and perfect for the owner with a green thumb, beautiful succulents and garden boxes ready for someone to start their summer garden. Residents enjoy wonderful community amenities including a clubhouse with space for social events, a pool, and on-site laundry facilities. Centrally located, the park offers quick access to shopping, public transit, and the freeway, making everyday errands and commuting a breeze.
Key facts
- Open floor plan
- Walk-in closet
- Community amenities
Tags
Neighborhood map
What this means for you Summary
Snapshot
- This is a 3-bed/2.0-bath manufactured listed at $179k.
Deal economics
- At list price, monthly cash flow is $2k ($18k/yr) — positive.
- The deal already cash-flows at list — no discount required.
- Meets the 1% rule at list price ($3k rent vs $179k).
- Recommended offer: $158k (12.0% below list) — sets the bar for market timing.
- Cap rate 16.5% vs local median 3.0% in Windsor — top-decile yield for the area; either an underpriced asset or a hidden risk that comps aren't pricing in. Stress-test before assuming the spread holds.
Location & tenants
- Location reads 71/100 on livability (#210 in CA) — a middle-class / working-renter tenant base. Strengths: employment A+, housing A+, health & safety A+; Watch: schools C-, amenities F, commute F.
- Windsor Unified (suburban): math 25% / reading 25% proficiency, ranked #362 of 517 in CA (top 70%) — low school quality limits family demand, transient renter base, plan for 1-2y turnover.
- Market conditions: 107 active listings in the ZIP; 9 comparable units currently listed for rent nearby; rentals at typical pace (median 22d on market — plan ~3-4 weeks tenant-placement turnaround); 44% of comp listings sitting > 30 days — soft ceiling on asking rent; high-income renter base; 1,039 units permitted in Sonoma County in 2024 (185 in 5+ unit buildings).
Forward outlook
- Local home prices are declining (-3.0%/yr); year-one equity from $1k of loan paydown is wiped out by about $5k of value loss. Plan a longer hold.
- Sonoma County population projected at +8% by 2050 — modest demand growth; plan on rents tracking national, not racing it.
- At projected returns (-3.0% appreciation + 3.0% rent growth), your $50k cash investment doubles in ~4 years — after that, you're playing with house money.
Negotiation context
- It's been on market 124 days — a 12% lower offer ($158k) is reasonable based on typical stale-listing flexibility.
Risks & watch-outs
- Climate carrying-cost: moderate wildfire risk — expect insurance premiums to compound above CPI over the hold.
Questions for the listing agent
- It's been on market 124 days. Have you received any prior offers? Is the seller open to a 12% concession, seller financing, or rate buy-down credit?
- Why hasn't it sold? Are there any deal-killer items the seller is aware of (foundation, flood, title, zoning, code violations)?
- Is there a deadline driving the sale (1031 exchange, divorce, estate, relocation)? That informs how much negotiation room exists.
- What's the average days-on-market for RENTAL listings here right now (not sales)? A rising rental-DOM trend means longer vacancies and softer asking-rent achievability than the comps imply.
- What's the recent tenant-quality profile in this submarket — average credit score on applications, eviction rate, late-payment / NSF rate, and stable-employment percentage? A property-management company in the area should have these aggregated.
- How much new for-sale + rental construction is in the pipeline within 1–3 miles? Heavy new supply typically softens prices + rents 12–24 months out; constrained supply supports both.
Investment metrics
- 1% rule
- 1.81% ✓
- Cap rate
- 16.49%
- Cash-on-cash
- 36.43%
- DSCR
- 2.62
- GRM
- 4.6
CMA / ARV
- ARV (median comp)
- $188,120
- List price
- $179,000
- Delta
- -4.85%
- Verdict
- FAIR
- Comps
- 8 within 1.0 mi
Show comp detail 11 sales within ~0.75 mi
| Address | Dist | Beds/Ba | Sqft | Sold | Price | $/sf | Match |
|---|---|---|---|---|---|---|---|
| 1036 Maple Dr | 0.19mi | 2/1.5 (-1) | 1,056 (0%) | 3mo | $150,000 | $142 | 82 |
| 8155 Willow St | 0.09mi | 2/2.0 (-1) | 1,120 (+6%) | 5mo | $145,000 | $129 | 77 |
| 8133 C St | 0.16mi | 2/2.0 (-1) | 1,040 (-2%) | 12mo | $195,000 | $188 | 75 |
| 8167 Willow St | 0.06mi | 2/2.0 (-1) | 1,100 (+4%) | 13mo | $155,000 | $141 | 74 |
| 8109 B St | 0.17mi | 2/2.0 (-1) | 1,152 (+9%) | 3mo | $199,000 | $173 | 70 |
| 8132 Willow St | 0.13mi | 2/2.0 (-1) | 1,040 (-2%) | 22mo | $135,000 | $130 | 68 |
| 8184 E St | 0.17mi | 2/2.0 (-1) | 1,056 (0%) | 24mo | $78,000 | $74 | 67 |
| 8114 B St | 0.17mi | 2/2.0 (-1) | 1,000 (-5%) | 16mo | $261,500 | $262 | 65 |
| 8095 A St | 0.18mi | 3/2.0 | 1,133 (+7%) | 24mo | $195,000 | $172 | 59 |
| 708 Sequoia Dr | 0.10mi | 2/2.0 (-1) | 1,152 (+9%) | 20mo | $155,000 | $135 | 58 |
| 1002 Maple Dr | 0.24mi | 2/2.0 (-1) | 1,200 (+14%) | 23mo | $175,000 | $146 | 41 |
Match score weights: distance 35% · size 25% · config 20% · recency 20%. Top-matched comps best support the ARV.
Projected returns pro-forma
-3.0% appreciation · 3.0% rent growth · sell at horizon
- IRR
- 32.2%
- Equity multiple
- 2.35×
- Total profit
- $67,824
- Equity at exit
- $26,689
- IRR
- 39.2%
- Equity multiple
- 4.66×
- Total profit
- $183,551
- Equity at exit
- $15,477
Cash invested: $50,120 (down + closing). Projections, not guarantees.
Landlord ↔ Tenant lean methodology
- Overall (STATE)
- 18 Strongly Tenant-Friendly
- State California
- 18 Strongly Tenant-Friendly · D+13
- County
- — inherits STATE
- City
- — inherits STATE
ZIP-level market 95492
- Active inventory
- 107
- Price-to-rent
- 4.6×
Monthly cashflow live
- Estimated rent
- $3,248 high interval (Pro) →
- Mortgage (P&I)
- −$939
- Tax from tax record
- −$31 /mo · $370/yr
- Insurance
- −$75
- HOA
- −$0
- Vacancy / Maint / Mgmt
- −$682
- Net cashflow
- $1,521
Break-even live
UW: 25.0% down · 7.5% · 30yr · 1.5% tax · 5.0% vac · 8.0% maint · 8.0% mgmt
Financing live
Cash to close
- Down payment
- $44,750
- Closing costs
- $5,370
- Reserves months
- —
- Total cash needed
- —
Loan-product check · same deal, 3 products live
Conventional
25% down · 7.5% · 30yr
- Down + closing
- —
- Monthly P&I
- —
- Monthly cashflow
- —
- DSCR
- —
- Eligible?
- —
Personal DTI + credit; lowest rate.
DSCR
20% down · 8.5% · 30yr
- Down + closing
- —
- Monthly P&I
- —
- Monthly cashflow
- —
- DSCR
- —
- Eligible?
- —
No personal income docs; deal must DSCR.
Hard money
10% down · 12.0% · 12mo
- Down + closing
- —
- Monthly P&I
- —
- Monthly cashflow
- —
- DSCR
- —
- Eligible?
- —
Short-term bridge; refi at stabilization.
Rent comps 9 comps
| Address | Beds | Baths | Sqft | Rent | $/sqft | DOM | Units | Dist |
|---|---|---|---|---|---|---|---|---|
| 208 Courtyards E Windsor, CA | 2.0 | 2.0 | 980 | $2,300 | $2.35 | 14d | 1 | 0.14mi |
| 172 Courtyards E Windsor, CA | 2.0 | 2.0 | 980 | $2,650 | $2.70 | 14d | 1 | 0.19mi |
| 10 3rd St Unit 10 Windsor, CA | 2.0 | 1.5 | 1000 | $2,395 | $2.40 | 44d | 1 | 0.34mi |
| 7924 Ferrari Way Windsor, CA | 3.0 | 2.0 | 1476 | $3,400 | $2.30 | 44d | 1 | 0.64mi |
| 776 McClelland Dr Windsor, CA | 2.0 | 2.5 | 1344 | $2,900 | $2.16 | 44d | 1 | 0.67mi |
| 1145 Shiloh Rd Windsor, CA | 3.0 | 1.0–2.0 | 776 | $4,395 | $5.66 | 8d | 14 | 1.07mi |
| 9631 Old Redwood Hwy Unit 9631 Windsor, CA | 2.0 | 1.0 | 1047 | $2,375 | $2.27 | 21d | 1 | 1.10mi |
| 1011 Ventana Dr Windsor, CA | 3.0 | 2.0 | 1100 | $3,400 | $3.09 | 44d | 1 | 1.18mi |
| 339 Pollard Way Windsor, CA | 3.0 | 2.0 | 1158 | $4,500 | $3.89 | 13d | 1 | 1.47mi |
Listing history 18 events
-
2026-06-18days on market $179,000 Active 124 DOM
-
2026-06-17days on market $179,000 Active 123 DOM
-
2026-06-16days on market $179,000 Active 122 DOM
-
2026-06-15days on market $179,000 Active 121 DOM
-
2026-06-14days on market $179,000 Active 119 DOM
-
2026-06-13days on market $179,000 Active 118 DOM
-
2026-06-10days on market $179,000 Active 116 DOM
-
2026-06-09days on market $179,000 Active 115 DOM
-
2026-06-08days on market $179,000 Active 114 DOM
-
2026-06-07pricedays on market $179,000 Active 113 DOM
-
2026-06-05days on market $185,000 Active 110 DOM
-
2026-06-03days on market $185,000 Active 109 DOM
-
2026-06-02days on market $185,000 Active 108 DOM
-
2026-06-01days on market $185,000 Active 107 DOM
-
2026-05-31days on market $185,000 Active 106 DOM
-
2026-05-30days on market $185,000 Active 105 DOM
-
2026-04-13price $185,000 823-char remark
Show marketing remark (823 chars)
Adorable 3-bedroom, 2-bath single-story manufactured home offering 1,056 sq ft of comfortable living in the desirable Windsor Mobile Country Club. Built in 1992, this home features an open floor plan that creates a bright and welcoming living space. The primary bedroom includes a walk-in closet, an updated bathroom, and direct access to the backyardperfect for easy indoor-outdoor living. Corner lot, sunny and perfect for the owner with a green thumb, beautiful succulents and garden boxes ready for someone to start their summer garden. Residents enjoy wonderful community amenities including a clubhouse with space for social events, a pool, and on-site laundry facilities. Centrally located, the park offers quick access to shopping, public transit, and the freeway, making everyday errands and commuting a breeze.
-
2026-02-14$195,000 Active 823-char remark
Show marketing remark (823 chars)
Adorable 3-bedroom, 2-bath single-story manufactured home offering 1,056 sq ft of comfortable living in the desirable Windsor Mobile Country Club. Built in 1992, this home features an open floor plan that creates a bright and welcoming living space. The primary bedroom includes a walk-in closet, an updated bathroom, and direct access to the backyardperfect for easy indoor-outdoor living. Corner lot, sunny and perfect for the owner with a green thumb, beautiful succulents and garden boxes ready for someone to start their summer garden. Residents enjoy wonderful community amenities including a clubhouse with space for social events, a pool, and on-site laundry facilities. Centrally located, the park offers quick access to shopping, public transit, and the freeway, making everyday errands and commuting a breeze.
ⓘ Source: listings_history table (triggers on properties + properties_extension) + one-shot
backfill from property_details.listing_events for pre-trigger history.
Tax reassessment forecast CA · Resets to sale price
- Current annual tax
- $370 · $31/mo
- Projected year-2 tax
- $1,360 · $113/mo
- Expected delta
- +$990/yr (+$82/mo · 267.2%)
ⓘ Screening estimate from a state-policy table — verify with the county assessor before closing.
Climate risk First Street
- Flood 1/10 Low FEMA zone X (unshaded) · 0% chance over 30 yrs
- Wildfire 5/10 Major
- Heat 4/10 Moderate 7 d/yr ≥92°F today · 16 d/yr by 30 yrs out
- Wind 1/10 Low
- Air quality 9/10 Extreme 18 unhealthy d/yr today · 20 by 30 yrs out
Nearby sold comps map
Loading sold comps map…
Walkable amenities ~0.75 mi
Loading nearby amenities…
Taxation est. · year 1
- Rental income
- $38,970
- − Mortgage interest
- −$10,027
- − Property taxes
- −$370
- − Insurance
- −$895
- − Repairs & maintenance
- −$3,118
- − Management
- −$3,118
- − Depreciation
- −$5,207
- Taxable income
- $16,236
- Est. tax owed @ 24.0%
- −$3,897
- After-tax cash flow
- $14,360/yr
For passive investors: Depreciation is non-cash, so a rental often shows a tax loss while cash-flowing — sheltering income. Rental losses are passive: they offset passive income freely, and up to $25,000/yr can offset ordinary (W-2) income if you actively participate and your MAGI is under $100k (phasing out to $0 by $150k); unused losses carry forward. On sale, claimed depreciation is recaptured at up to 25%, and gains may owe capital-gains tax (a 1031 exchange can defer both). Figures are a year-1 estimate at your 24.0% rate — not tax advice; consult a CPA.
Schools (NCES district)
- District
- Windsor Unified
- NCES district ID
- 0600034
- Math proficiency
- 25% ▼ -10.00%
- Reading proficiency
- 25% ▼ -22.00%
- Median HH income
- $81,297
- Composite
- 25.06/100
- National rank
- #7541
- State rank
- #362 of 517 in CA
Livability — Windsor
- Score
- 71/100
- State rank
- #210
- US rank
- #6671
Category grades
Schools grade is shown separately in the Schools card above.
Census & demographics
- Census place
- Windsor, CA
- County
- Sonoma County · 449,805 people
- City population
- 27,429
- Metro
- Santa Rosa-Petaluma, CA
- Population (ZIP)
- 27,429
- Household income
- $134,211
- Rent vs Own
- Severe rent burden
- 628.0
Population outlook (Sonoma County) Hauer SSP2
- Today (2025)
- 539,935 people
- By 2030
- 554,870 · +2.8%
- By 2040
- 573,262 · +6.2%
- By 2050
- 580,715 · +7.6%
- By 2075
- 579,229 · +7.3%
- By 2100
- 547,835 · +1.5%
Race, ethnicity, and origin ACS 2023
- Neighborhood character
- Majority White (59%)
- Race & ethnicity
- White 59% Hispanic / Latino 33% Two or more races 13% Native American 4% Asian 2% Black 1%
- Hispanic origin (detail)
- Mexican 28%
- Common ancestry
- Italian 4% Slovak 3% Lithuanian 2%
- Foreign-born
- 14% · Canada
- Languages at home
- 72% English-only · Spanish 25% French/Haitian/Cajun 1% Vietnamese 1%
Political lean MEDSL · Sonoma
- 2024 margin
- Solid D (+46.2) · D 71.4% · R 25.2% · Other 3.3%
- 2008→2024 swing
- -3.4pp toward R · 2008: 49.6pp · 2024: 46.2pp
- All cycles
- 2024: D+46.2 2020: D+51.5 2016: D+47.9 2012: D+44.9 2008: D+49.6
Not yet ingested
- Civics
- —
Market trends
- HPI YoY
- ▼ -348.03%
- Current HPI
- 249.6052
- Rent YoY
- —
- Metro
- Santa Rosa-Petaluma, CA
- State GDP YoY
- ▲ 3.21%
- F500 in state
- 116
Industry mix (Fortune 500 HQ in CA)
| Industry | F500 HQs | Revenue |
|---|---|---|
| Technology | 27 | $1,492B |
|
||
| Financial Services | 3 | $174B |
|
||
| Retail | 3 | $44B |
|
||
| Insurance | 3 | $26B |
|
||
| Media / Entertainment | 2 | $115B |
|
||
| Pharmaceuticals / Biotech | 2 | $62B |
|
||
Price history
-5.1% since first listed2 events — show timeline
- 2026-04-13 Price Changed $185,000 BAREIS
- 2026-02-14 Listed $195,000 BAREIS
Property tax history
+2.5%/yrLatest (2025): $370 · +0.3% YoY. Source: county tax records.
Cash-flow waterfall
monthlySold comps — $/sqft
last 12 mo · ≤1 miLoading sold comps…