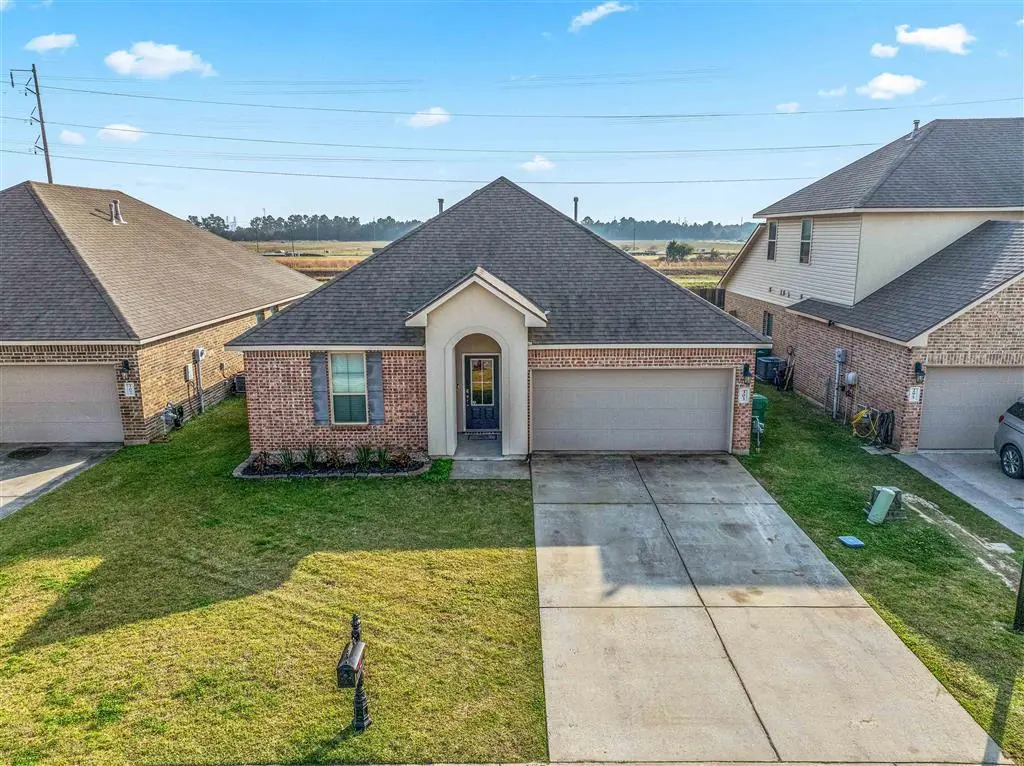
303 Oak Hampton Dr · Sulphur, LA
Flood risk 6/10 · Moderate
- FEMA flood zone
- X (unshaded)
- Chance of flooding over 30 yrs
- 0.7%
- Est. flood insurance / yr
- $507 – $1,088
Fire risk 3/10 · Minor
- Est. fire insurance / yr
- $1,269 – $2,357
Heat risk 9/10 · Severe
- Hot days now (above 109°F)
- 7 days/yr
- Hot days in 30 yrs
- 23 days/yr
Wind risk 9/10 · Severe
- Chance of severe wind over 30 yrs
- 99.0%
Air-quality risk 2/10 · Minimal
- Unhealthy air days now
- 1 days/yr
- Unhealthy air days in 30 yrs
- 1 days/yr
Risk factors via First Street. Map © Google.
Why this score? — see what drove the B+ grade
The composite is a weighted blend of 9 inputs, each scored 0–100. Each bar is that input's sub-score; the figure is the points it added to the 100-point composite (weight × sub-score).
- Cash flow +30.0/30.0
- ARV discount +14.6/15.0
- 1% rule +10.0/10.0
- DSCR +10.0/10.0
- Condition / age +4.0/5.0
- Livability +3.6/5.0
- Schools +3.1/10.0
- Rent growth +2.5/5.0
- Appreciation +0.0/10.0
$213,500
🖨 Deal sheet (PDF) 📄 Offer letter ✓ Due diligence
Listing remarks MLS
Located in the desirable Mimosa Park Subdivision, this well-maintained home built in 2019 offers modern comfort and thoughtful design. The open-concept kitchen and living area create an inviting space for everyday living and entertaining, complete with granite countertops throughout. Waterproof vinyl flooring adds both style and durability, while the cedar privacy fence provides a private backyard retreat. Meticulously upkept and move-in ready, this home is conveniently located near I-10 for easy access to commuting, shopping, and dining.
Key facts
- Move-in ready
- Open-concept kitchen
- Cedar privacy fence
Tags
Neighborhood map
What this means for you Summary
Snapshot
- This is a 3-bed/2.0-bath single-family listed at $214k. Condition is rated good.
Deal economics
- At list price, monthly cash flow is $1k ($17k/yr) — positive.
- The deal already cash-flows at list — no discount required.
- Meets the 1% rule at list price ($4k rent vs $214k).
- Recommended offer: $210k (1.5% below list) — sets the bar for market timing.
- Cap rate 14.0% vs local median 8.8% in Sulphur — top-decile yield for the area; either an underpriced asset or a hidden risk that comps aren't pricing in. Stress-test before assuming the spread holds.
Location & tenants
- Location reads 71/100 on livability (#48 in LA) — a middle-class / working-renter tenant base. Strengths: cost of living A+, housing A+, schools A; Watch: crime D-, amenities F, commute F.
- Calcasieu Parish (other): math 30% / reading 44% proficiency, ranked #29 of 98 in LA (top 30%) — families likely to look elsewhere, expect single-tenant / working-renter base with shorter leases.
- Market conditions: 236 active listings in the ZIP; 3 comparable units currently listed for rent nearby; rentals lingering (median 44d on market — plan ~5-8 weeks vacancy on turnover, expect pricing pressure); 67% of comp listings sitting > 30 days — soft ceiling on asking rent; 1,298 units permitted in Calcasieu Parish in 2024 (526 in 5+ unit buildings).
Forward outlook
- Local home prices are declining (-3.0%/yr); year-one equity from $1k of loan paydown is wiped out by about $6k of value loss. Plan a longer hold.
- Calcasieu County population projected at +11% by 2050 — modest demand growth; plan on rents tracking national, not racing it.
- At projected returns (-3.0% appreciation + 3.0% rent growth), your $60k cash investment doubles in ~5 years — after that, you're playing with house money.
Negotiation context
- It's been on market 20 days — a 2% lower offer ($210k) is reasonable based on typical stale-listing flexibility.
- 2 sale attempts since 5y ago; this cycle's ask has dropped $13k (6%) from the opening price — seller is motivated, your offer sets the floor, not the list.
Risks & watch-outs
- Climate carrying-cost: major flood risk; severe wind risk, 99% chance of damaging wind over 30y; extreme-heat days projected 7→23/yr by 2055 (HVAC capex compounding) — expect insurance premiums to compound above CPI over the hold.
Questions for the listing agent
- What does the HOA fee cover, when was the last increase, and are there any pending special assessments or reserve-fund shortfalls?
- Is there a deadline driving the sale (1031 exchange, divorce, estate, relocation)? That informs how much negotiation room exists.
- Schools are A-rated — typically a magnet for longer-tenancy family renters. What's the average tenant stay here, and is there a school-zone premium baked into asking?
- Crime grade is D in this area — have there been break-ins, vandalism, or insurance claims at this property in the last 3 years? What carrier currently insures it and at what premium?
- What's the average days-on-market for RENTAL listings here right now (not sales)? A rising rental-DOM trend means longer vacancies and softer asking-rent achievability than the comps imply.
- What's the recent tenant-quality profile in this submarket — average credit score on applications, eviction rate, late-payment / NSF rate, and stable-employment percentage? A property-management company in the area should have these aggregated.
- How much new for-sale + rental construction is in the pipeline within 1–3 miles? Heavy new supply typically softens prices + rents 12–24 months out; constrained supply supports both.
Investment metrics
- 1% rule
- 1.65% ✓
- Cap rate
- 14.05%
- Cash-on-cash
- 27.70%
- DSCR
- 2.23
- GRM
- 5.0
CMA / ARV
- ARV (median comp)
- $253,243
- List price
- $213,500
- Delta
- -14.71%
- Verdict
- UNDERPRICED
- Comps
- 7 within 1.0 mi
Show comp detail 12 sales within ~0.75 mi
| Address | Dist | Beds/Ba | Sqft | Sold | Price | $/sf | Match |
|---|---|---|---|---|---|---|---|
| 277 Paisley Pkwy | 0.28mi | 3/2.0 | 1,616 (+7%) | 2mo | $214,000 | $132 | 74 |
| 305 Paisley Pkwy | 0.26mi | 3/2.0 | 1,618 (+7%) | 4mo | $217,000 | $134 | 72 |
| 235 Aston Ln | 0.31mi | 3/2.0 | 1,563 (+4%) | 10mo | $214,000 | $137 | 71 |
| 148 Orchard Ln | 0.50mi | 3/2.0 | 1,514 (+0%) | 7mo | $207,000 | $137 | 70 |
| 224 Pipers Ln | 0.35mi | 3/2.0 | 1,641 (+9%) | 12mo | $233,900 | $143 | 59 |
| 337 Madison Xing | 0.64mi | 3/2.0 | 1,452 (-4%) | 8mo | $208,000 | $143 | 58 |
| 324 Long Hill Dr | 0.62mi | 3/2.0 | 1,545 (+2%) | 13mo | $208,000 | $135 | 56 |
| 141 Abella Way | 0.54mi | 3/2.0 | 1,570 (+4%) | 14mo | $220,000 | $140 | 56 |
| 109 Briar Ct | 0.71mi | 3/2.0 | 1,642 (+9%) | 7mo | $212,500 | $129 | 46 |
| 133 Keaton Ct | 0.54mi | 3/2.0 | 1,689 (+12%) | 14mo | $218,500 | $129 | 43 |
| 248 Long Hill Dr Dr | 0.64mi | 3/2.0 | 1,698 (+13%) | 7mo | $205,000 | $121 | 43 |
| 344 Madison Crossing Dr | 0.67mi | 3/2.0 | 1,710 (+13%) | 12mo | $219,500 | $128 | 36 |
Match score weights: distance 35% · size 25% · config 20% · recency 20%. Top-matched comps best support the ARV.
Projected returns pro-forma
-3.0% appreciation · 3.0% rent growth · sell at horizon
- IRR
- 21.8%
- Equity multiple
- 1.89×
- Total profit
- $53,306
- Equity at exit
- $31,834
- IRR
- 29.9%
- Equity multiple
- 3.67×
- Total profit
- $159,634
- Equity at exit
- $18,460
Cash invested: $59,780 (down + closing). Projections, not guarantees.
Landlord ↔ Tenant lean methodology
- Overall (STATE)
- 90 Strongly Landlord-Friendly
- State Louisiana
- 90 Strongly Landlord-Friendly · R+12
- County
- — inherits STATE
- City
- — inherits STATE
ZIP-level market 70665
- Active inventory
- 236
- Price-to-rent
- 5.0×
Monthly cashflow live
- Estimated rent
- $3,525 medium interval (Pro) →
- Mortgage (P&I)
- −$1,120
- Tax from tax record
- −$161 /mo · $1,933/yr
- Insurance
- −$89
- HOA
- −$35
- Vacancy / Maint / Mgmt
- −$740
- Net cashflow
- $1,380
Break-even live
Sensitivity live
| Price | -10% $1,501 | -5% $1,440 | +0% $1,380 | +5% $1,320 | +10% $1,259 |
|---|---|---|---|---|---|
| Rent | -10% $1,102 | -5% $1,241 | +0% $1,380 | +5% $1,519 | +10% $1,658 |
| Rate | -1.0pp $1,488 | -0.5pp $1,434 | base $1,380 | +0.5pp $1,325 | +1.0pp $1,268 |
UW: 25.0% down · 7.5% · 30yr · 1.5% tax · 5.0% vac · 8.0% maint · 8.0% mgmt
Financing live
Cash to close
- Down payment
- $53,375
- Closing costs
- $6,405
- Reserves months
- —
- Total cash needed
- —
Loan-product check · same deal, 3 products live
Conventional
25% down · 7.5% · 30yr
- Down + closing
- —
- Monthly P&I
- —
- Monthly cashflow
- —
- DSCR
- —
- Eligible?
- —
Personal DTI + credit; lowest rate.
DSCR
20% down · 8.5% · 30yr
- Down + closing
- —
- Monthly P&I
- —
- Monthly cashflow
- —
- DSCR
- —
- Eligible?
- —
No personal income docs; deal must DSCR.
Hard money
10% down · 12.0% · 12mo
- Down + closing
- —
- Monthly P&I
- —
- Monthly cashflow
- —
- DSCR
- —
- Eligible?
- —
Short-term bridge; refi at stabilization.
Rent comps 3 comps
| Address | Beds | Baths | Sqft | Rent | $/sqft | DOM | Units | Dist |
|---|---|---|---|---|---|---|---|---|
| 293 Sawyer Dr Sulphur, LA | 4.0 | 2.0 | 2079 | $4,400 | $2.12 | 44d | 1 | 0.19mi |
| 1000 E Carlyss Blvd Sulphur, LA | 1.0–3.0 | 1.0–2.0 | 966 | $2,296 | $2.38 | 14d | 10 | 0.35mi |
| 1141 Mosswood Dr Sulphur, LA | 2.0–3.0 | 2.0–3.5 | 1332 | $2,195 | $1.65 | 44d | 1 | 1.16mi |
HOA detail
- Monthly dues
- $35 · $420/yr
- Likely covers
- water
Listing history 16 events
-
2026-06-13statusdays on market $213,500 Pending 20 DOM
-
2026-06-10days on market $213,500 Active 19 DOM
-
2026-06-09days on market $213,500 Active 18 DOM
-
2026-06-08days on market $213,500 Active 17 DOM
-
2026-06-07days on market $213,500 Active 16 DOM
-
2026-06-05days on market $213,500 Active 13 DOM
-
2026-06-02days on market $213,500 Active 11 DOM
-
2026-06-01days on market $213,500 Active 10 DOM
-
2026-05-31days on market $213,500 Active 9 DOM
-
2026-05-30days on market $213,500 Active 8 DOM
-
2026-03-03price $216,000 544-char remark
Show marketing remark (544 chars)
Located in the desirable Mimosa Park Subdivision, this well-maintained home built in 2019 offers modern comfort and thoughtful design. The open-concept kitchen and living area create an inviting space for everyday living and entertaining, complete with granite countertops throughout. Waterproof vinyl flooring adds both style and durability, while the cedar privacy fence provides a private backyard retreat. Meticulously upkept and move-in ready, this home is conveniently located near I-10 for easy access to commuting, shopping, and dining.
-
2026-01-23price $219,000 544-char remark
Show marketing remark (544 chars)
Located in the desirable Mimosa Park Subdivision, this well-maintained home built in 2019 offers modern comfort and thoughtful design. The open-concept kitchen and living area create an inviting space for everyday living and entertaining, complete with granite countertops throughout. Waterproof vinyl flooring adds both style and durability, while the cedar privacy fence provides a private backyard retreat. Meticulously upkept and move-in ready, this home is conveniently located near I-10 for easy access to commuting, shopping, and dining.
-
2026-01-08$226,500 Active 544-char remark
Show marketing remark (544 chars)
Located in the desirable Mimosa Park Subdivision, this well-maintained home built in 2019 offers modern comfort and thoughtful design. The open-concept kitchen and living area create an inviting space for everyday living and entertaining, complete with granite countertops throughout. Waterproof vinyl flooring adds both style and durability, while the cedar privacy fence provides a private backyard retreat. Meticulously upkept and move-in ready, this home is conveniently located near I-10 for easy access to commuting, shopping, and dining.
-
2022-01-05soldstatus $209,000
-
2022-01-04soldstatus 326-char remark
Show marketing remark (326 chars)
This beautiful 3 bed/2 bath is only 2 years old! Located in Mimosa Park Subdivision. This home features an open concept kitchen/living area great for entertaining! Granite countertops throughout. Waterproof vinyl flooring. Cedar privacy fence only 1 year old. Conveniently located near I-10. Call to set up your showing today!
-
2021-10-20$209,000 326-char remark
Show marketing remark (326 chars)
This beautiful 3 bed/2 bath is only 2 years old! Located in Mimosa Park Subdivision. This home features an open concept kitchen/living area great for entertaining! Granite countertops throughout. Waterproof vinyl flooring. Cedar privacy fence only 1 year old. Conveniently located near I-10. Call to set up your showing today!
ⓘ Source: listings_history table (triggers on properties + properties_extension) + one-shot
backfill from property_details.listing_events for pre-trigger history.
Tax reassessment forecast LA · Resets to sale price
- Current annual tax
- $1,933 · $161/mo
- Projected year-2 tax
- $1,933 · $161/mo
- Expected delta
- $0/yr ($0/mo · 0.0%)
ⓘ Screening estimate from a state-policy table — verify with the county assessor before closing.
Climate risk First Street
- Flood 6/10 Major FEMA zone X (unshaded) · 70% chance over 30 yrs
- Wildfire 3/10 Moderate
- Heat 9/10 Extreme 7 d/yr ≥109°F today · 23 d/yr by 30 yrs out
- Wind 9/10 Extreme 99% chance of damaging wind over 30 yrs
- Air quality 2/10 Low 1 unhealthy d/yr today · 1 by 30 yrs out
Nearby sold comps map
Loading sold comps map…
Walkable amenities ~0.75 mi
Loading nearby amenities…
Taxation est. · year 1
- Rental income
- $42,298
- − Mortgage interest
- −$11,959
- − Property taxes
- −$1,933
- − Insurance
- −$1,068
- − Repairs & maintenance
- −$3,384
- − Management
- −$3,384
- − HOA
- −$420
- − Depreciation
- −$6,211
- Taxable income
- $13,940
- Est. tax owed @ 24.0%
- −$3,346
- After-tax cash flow
- $13,214/yr
For passive investors: Depreciation is non-cash, so a rental often shows a tax loss while cash-flowing — sheltering income. Rental losses are passive: they offset passive income freely, and up to $25,000/yr can offset ordinary (W-2) income if you actively participate and your MAGI is under $100k (phasing out to $0 by $150k); unused losses carry forward. On sale, claimed depreciation is recaptured at up to 25%, and gains may owe capital-gains tax (a 1031 exchange can defer both). Figures are a year-1 estimate at your 24.0% rate — not tax advice; consult a CPA.
Condition & rehab AI · 13 photos
This well-maintained 2019 home in Mimosa Park Subdivision is move-in ready with modern updates and a good condition score.
Value-add opportunities
- Resale paint exterior — enhances curb appeal
- Resale replace window trim — improves aesthetics
- Both update flooring — modernizes and increases value
- Resale update kitchen appliances — enhances appeal
Renovation cost estimate screening
Value-add ROI direction
- Resale paint exterior — enhances curb appeal ↑
- Resale replace window trim — improves aesthetics ↑
- Both update flooring — modernizes and increases value ↑
- Resale update kitchen appliances — enhances appeal ↑
ⓘ Cost ranges are severity-bucket heuristics (US national rule-of-thumb). Get contractor quotes + a written scope before underwriting a rehab budget.
Schools (NCES district)
- District
- Calcasieu Parish
- NCES district ID
- 2200330
- Math proficiency
- 30% ▼ -39.00%
- Reading proficiency
- 44% ▼ -33.00%
- Median HH income
- $44,700
- Composite
- 31.45/100
- National rank
- #5979
- State rank
- #29 of 98 in LA
Livability — Sulphur
- Score
- 71/100
- State rank
- #48
- US rank
- #7164
Category grades
Schools grade is shown separately in the Schools card above.
Census & demographics
- Census place
- Sulphur, LA
- City population
- 27,799
- Population (ZIP)
- 12,891
Population outlook (Calcasieu County) Hauer SSP2
- Today (2025)
- 212,179 people
- By 2030
- 218,199 · +2.8%
- By 2040
- 228,486 · +7.7%
- By 2050
- 236,208 · +11.3%
- By 2075
- 251,696 · +18.6%
- By 2100
- 247,848 · +16.8%
Race, ethnicity, and origin ACS 2023
- Neighborhood character
- Predominantly White (87%)
- Race & ethnicity
- White 87% Hispanic / Latino 6% Two or more races 4% Black 3%
- Hispanic origin (detail)
- Mexican 4%
- Common ancestry
- Lithuanian 8% Italian 3% Slovak 2%
- Foreign-born
- 3% · Canada
- Languages at home
- 92% English-only · Spanish 6% French/Haitian/Cajun 1% Other Indo-European 1%
Political lean MEDSL · Calcasieu
- 2024 margin
- Solid R (+39.6) · D 29.5% · R 69.0% · Other 1.5%
- 2008→2024 swing
- -15.0pp toward R · 2008: -24.6pp · 2024: -39.6pp
- All cycles
- 2024: R+39.6 2020: R+35.2 2016: R+33.3 2012: R+28.7 2008: R+24.6
Not yet ingested
- Civics
- —
Market trends
- HPI YoY
- ▼ -91.65%
- Current HPI
- 99.2379
- Rent YoY
- —
- Metro
- —
- State GDP YoY
- ▲ 3.29%
- F500 in state
- 10
Industry mix (Fortune 500 HQ in LA)
| Industry | F500 HQs | Revenue |
|---|---|---|
| Telecommunications | 2 | $23B |
|
||
| Utilities | 1 | $12B |
|
||
| Wholesale / Distribution | 1 | $5B |
|
||
| Advertising | 1 | $2B |
|
||
Price history
+3.3% since first listed6 events — show timeline
- 2026-03-03 Price Changed $216,000 SWLAR
- 2026-01-23 Price Changed $219,000 SWLAR
- 2026-01-08 Listed $226,500 SWLAR
- 2022-01-05 Sold (Public Records) $209,000 Public Records
- 2022-01-04 Sold (MLS) — SWLAR
- 2021-10-20 Listed $209,000 SWLAR
Property tax history
+2.0%/yrLatest (2025): $1,933 · +0.8% YoY. Source: county tax records.
Cash-flow waterfall
monthlySold comps — $/sqft
last 12 mo · ≤1 miLoading sold comps…