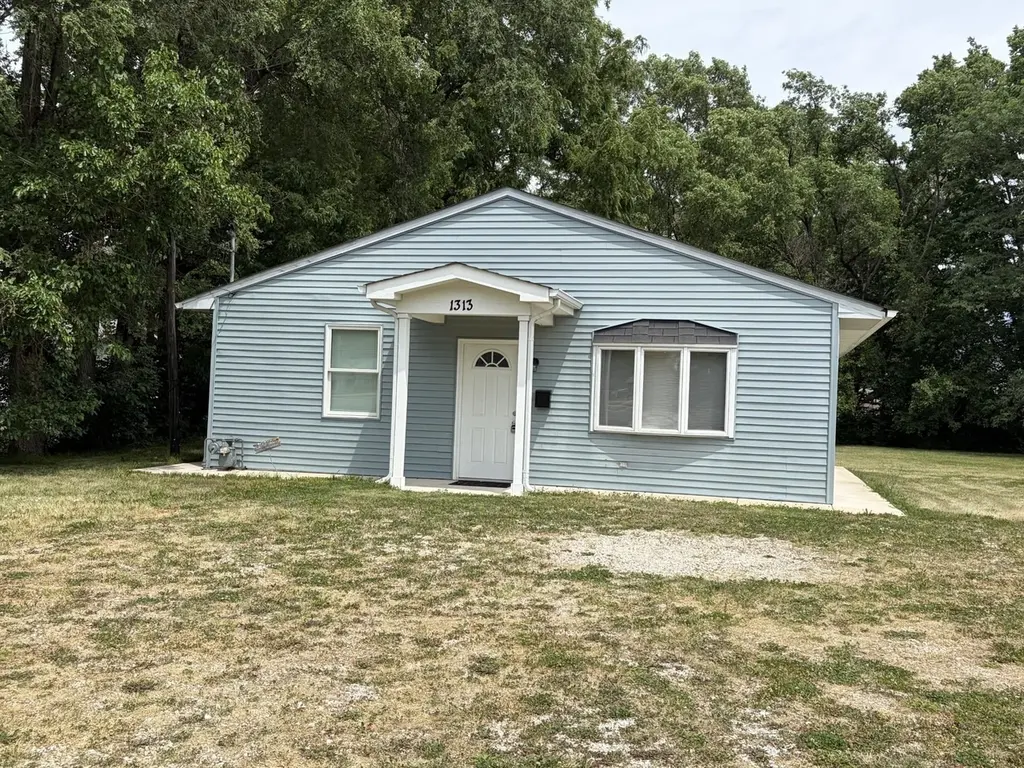
1313 N Bloomington St · Streator, IL
Flood risk 7/10 · Major
- FEMA flood zone
- X (unshaded)
- Chance of flooding over 30 yrs
- 0.77%
- Est. flood insurance / yr
- $473 – $860
Fire risk 1/10 · Minimal
- Est. fire insurance / yr
- $804 – $1,492
Heat risk 3/10 · Minor
- Hot days now (above 104°F)
- 7 days/yr
- Hot days in 30 yrs
- 17 days/yr
Wind risk 2/10 · Minimal
- Chance of severe wind over 30 yrs
- 1.0%
Air-quality risk 2/10 · Minimal
- Unhealthy air days now
- 1 days/yr
- Unhealthy air days in 30 yrs
- 1 days/yr
Risk factors via First Street. Map © Google.
Why this score? — see what drove the F grade
The composite is a weighted blend of 9 inputs, each scored 0–100. Each bar is that input's sub-score; the figure is the points it added to the 100-point composite (weight × sub-score).
- Cash flow +12.8/30.0
- Condition / age +4.0/5.0
- DSCR +3.8/10.0
- 1% rule +3.4/10.0
- Livability +3.2/5.0
- Rent growth +2.5/5.0
- Schools +1.3/10.0
- ARV discount +0.0/15.0
- Appreciation +0.0/10.0
$144,900
🖨 Deal sheet 📄 Offer letter ✓ Due diligence
Listing remarks MLS
Brilliant! This updated two bedroom sits on a large double lot in a convenient central location. Currently used as a short term rental, this home has an open concept kitchen and living room. The two bedrooms are nice sized with generous closet space. Ideal for both investor or homeowner looking for a low maintenance property!
Key facts
- Open concept kitchen
- Double lot
- 0.46 acre lot
Tags
Property features AI
Finance
- Other: Parcel numbers on record
- HOA & community: No master association fee required
Exterior
- Parking: 2 parking spaces; Gravel off-street parking; Driveway with circular drive; Owned parking
- Utilities: Public water; Public sewer; Electric with circuit breakers
- Home design: Detached single-family home; One story; Fee simple ownership
- Construction: Approximately 21–25 years old; Vinyl siding; Asphalt roof; Concrete perimeter foundation
- Exterior features: Irregular lot; School bus service
Interior
- Kitchen: Updated kitchen with solid surface counters and breakfast bar; Range; Microwave; Refrigerator; Range hood
- Bedrooms: 2 bedrooms (both on the main level); Master bedroom on the main level
- Flooring: Laminate in living room and kitchen; Carpet in bedrooms
- Bathrooms: 1 full bathroom (no tub)
- Heating & cooling: Forced air heating (natural gas); Central air conditioning
- Interior features: Open floor plan; 1st-floor bedroom; Insulated windows; 4 total rooms
- Laundry & utility: Main-level laundry with gas dryer hookup; Laundry closet
Neighborhood map
What this means for you Summary
Snapshot
- This is a 2-bed/1.0-bath single-family listed at $145k. Condition is rated good.
Deal economics
- At list price, monthly cash flow is $-68 ($-815/yr) — negative.
- To cash-flow at today's rent, offer at most $133k (8.3% below list).
- To meet the 1% rule (rent ≥ 1% of price), the offer needs to be $121k (16.4% below list).
- Recommended offer: $121k (16.4% below list) — sets the bar for 1% rule.
- Cap rate 6.2% vs local median 7.8% in Streator — below-typical yield; the buyer is paying a premium for something (appreciation thesis, condition, location) that the cap rate doesn't capture.
Location & tenants
- Location reads 63/100 on livability (#752 in IL) — a middle-class / working-renter tenant base. Strengths: cost of living A+, health & safety A+, housing B+; Watch: schools F, amenities F, commute F.
- Streator Twp Hsd 40 (town): math 11% / reading 19% proficiency, ranked #513 of 620 in IL (top 83%) — low school quality limits family demand, transient renter base, plan for 1-2y turnover.
- Market conditions: 87 active listings in the ZIP; 1 comparable units currently listed for rent nearby; 82 units permitted in LaSalle County in 2024 (0 in 5+ unit buildings).
Forward outlook
- Local home prices are declining (-3.0%/yr); year-one equity from $1k of loan paydown is wiped out by about $4k of value loss. Plan a longer hold.
- LaSalle County population projected at -16% by 2050 — secular population decline; favor cash flow + early exit over multi-decade hold.
Negotiation context
- Only 14 days on market — expect competitive offers; lowballing is unlikely to land.
- 6 sale attempts since 9y ago with the ask held roughly flat each time — persistent listings suggest the price (not the market) is what's stuck; bring a comps-based counter.
- Current owner paid $28k; list at $145k implies a 418% gain — meaningful room to come down on a strong offer.
Risks & watch-outs
- Watch-outs: flood insurance adds $56/mo.
- Climate carrying-cost: major flood risk — expect insurance premiums to compound above CPI over the hold.
Questions for the listing agent
- What do current leases actually rent for vs. the listed asking? Can we see a recent rent roll and the last 12 months of T-12 income?
- What's the actual annual flood-insurance premium (NFIP or private), and is the property in a SFHA with mandatory coverage?
- Is there a deadline driving the sale (1031 exchange, divorce, estate, relocation)? That informs how much negotiation room exists.
- Schools are F-rated, which usually means shorter tenancies and higher turnover. Who's the typical renter profile here, and what's been the actual vacancy rate?
- The area grade is low — what's the realistic commute time and amenity access for the typical tenant pool here? Any planned neighborhood developments (good or bad) we should know about?
- What's the average days-on-market for RENTAL listings here right now (not sales)? A rising rental-DOM trend means longer vacancies and softer asking-rent achievability than the comps imply.
- What's the recent tenant-quality profile in this submarket — average credit score on applications, eviction rate, late-payment / NSF rate, and stable-employment percentage? A property-management company in the area should have these aggregated.
- How much new for-sale + rental construction is in the pipeline within 1–3 miles? Heavy new supply typically softens prices + rents 12–24 months out; constrained supply supports both.
Investment metrics
- 1% rule
- 0.84% ✗
- Cap rate
- 6.19%
- Cash-on-cash
- -0.37%
- DSCR
- 0.98
- GRM
- 10.0
CMA / ARV
- ARV (on-the-fly)
- $99,000
- Comps found
- 12
Show comp detail 12 sales within ~0.75 mi
| Address | Dist | Beds/Ba | Sqft | Sold | Price | $/sf | Match |
|---|---|---|---|---|---|---|---|
| 210 E 1st St | 0.13mi | 2/1.0 | 804 (-11%) | 0mo | $82,000 | $102 | 76 |
| 118 W 3rd St | 0.29mi | 2/1.0 | 972 (+8%) | 4mo | $137,500 | $141 | 70 |
| 118 W 3rd St | 0.29mi | 2/1.0 | 972 (+8%) | 4mo | $137,500 | $141 | 70 |
| 1204 N Park St | 0.13mi | 2/1.0 | 800 (-11%) | 10mo | $88,000 | $110 | 68 |
| 107 W Larue St | 0.47mi | 2/1.0 | 950 (+6%) | 4mo | $115,000 | $121 | 66 |
| 1603 N Sterling St | 0.37mi | 3/1.0 (+1) | 960 (+7%) | 3mo | $67,000 | $70 | 64 |
| 910 N Bloomington St | 0.33mi | 3/1.5 (+1) | 1,020 (+13%) | 3mo | $144,001 | $141 | 53 |
| 912 N Vermillion St | 0.34mi | 3/1.0 (+1) | 1,024 (+14%) | 7mo | $80,000 | $78 | 50 |
| 611 N Sterling St | 0.62mi | 3/1.0 (+1) | 987 (+10%) | 6mo | $40,000 | $41 | 45 |
| 1607 Shaft St | 0.56mi | 3/1.0 (+1) | 988 (+10%) | 10mo | $39,000 | $39 | 44 |
| 504 N Jefferson St | 0.67mi | 2/1.0 | 811 (-10%) | 10mo | $189,511 | $234 | 44 |
| 613 N Shabbona St | 0.73mi | 1/1.0 (-1) | 990 (+10%) | 7mo | $58,000 | $59 | 39 |
Match score weights: distance 35% · size 25% · config 20% · recency 20%. Top-matched comps best support the ARV.
Projected returns pro-forma
-3.0% appreciation · 3.0% rent growth · sell at horizon
- IRR
- -19.6%
- Equity multiple
- 0.32×
- Total profit
- $-27,771
- Equity at exit
- $21,605
- IRR
- -12.3%
- Equity multiple
- 0.27×
- Total profit
- $-29,616
- Equity at exit
- $12,528
Cash invested: $40,572 (down + closing). Projections, not guarantees.
Landlord ↔ Tenant lean methodology
- Overall (STATE)
- 43 Moderately Tenant-Leaning
- State Illinois
- 43 Moderately Tenant-Leaning · D+7
- County
- — inherits STATE
- City
- — inherits STATE
ZIP-level market 61364
- Home prices YoY
- -31.1%
- Active inventory
- 87
- Price-to-rent
- 10.0×
Monthly cashflow live
- Estimated rent
- $1,212 medium interval (Pro) →
- Mortgage (P&I)
- −$760
- Tax from tax record
- −$149 /mo · $1,792/yr
- Insurance
- −$60
- Flood insurance flood zone
- −$56 /mo · $666/yr
- HOA
- −$0
- Vacancy / Maint / Mgmt
- −$254
- Net cashflow
- $-68
Break-even live
UW: 25.0% down · 7.5% · 30yr · 1.5% tax · 5.0% vac · 8.0% maint · 8.0% mgmt
Financing live
Cash to close
- Down payment
- $36,225
- Closing costs
- $4,347
- Reserves months
- —
- Total cash needed
- —
Loan-product check · same deal, 3 products live
Conventional
25% down · 7.5% · 30yr
- Down + closing
- —
- Monthly P&I
- —
- Monthly cashflow
- —
- DSCR
- —
- Eligible?
- —
Personal DTI + credit; lowest rate.
DSCR
20% down · 8.5% · 30yr
- Down + closing
- —
- Monthly P&I
- —
- Monthly cashflow
- —
- DSCR
- —
- Eligible?
- —
No personal income docs; deal must DSCR.
Hard money
10% down · 12.0% · 12mo
- Down + closing
- —
- Monthly P&I
- —
- Monthly cashflow
- —
- DSCR
- —
- Eligible?
- —
Short-term bridge; refi at stabilization.
Rent comps 1 comps
| Address | Beds | Baths | Sqft | Rent | $/sqft | DOM | Units | Dist |
|---|---|---|---|---|---|---|---|---|
| 402 S Illinois St Streator, IL | 2.0 | 1.0 | 1116 | $1,550 | $1.39 | 22d | 1 | 1.37mi |
Listing history 11 events
-
2026-06-19days on market $144,900 Active 14 DOM
-
2026-06-18days on market $144,900 Active 13 DOM
-
2026-06-17days on market $144,900 Active 12 DOM
-
2026-06-16days on market $144,900 Active 11 DOM
-
2026-06-15days on market $144,900 Active 10 DOM
-
2026-06-14days on market $144,900 Active 8 DOM
-
2026-06-12days on market $144,900 Active 7 DOM
-
2026-06-09days on market $144,900 Active 4 DOM
-
2026-06-08days on market $144,900 Active 3 DOM
-
2026-06-07remarks 327-char remark
-
2026-06-07$144,900 Active 2 DOM
ⓘ Source: listings_history table (triggers on properties + properties_extension) + one-shot
backfill from property_details.listing_events for pre-trigger history.
Tax reassessment forecast IL · Partial reset (capped growth)
- Current annual tax
- $1,792 · $149/mo
- Projected year-2 tax
- $2,540 · $212/mo
- Expected delta
- +$749/yr (+$62/mo · 41.8%)
ⓘ Screening estimate from a state-policy table — verify with the county assessor before closing.
Climate risk First Street
- Flood 7/10 Severe FEMA zone X (unshaded) · 77% chance over 30 yrs
- Wildfire 1/10 Low
- Heat 3/10 Moderate 7 d/yr ≥104°F today · 17 d/yr by 30 yrs out
- Wind 2/10 Low 100% chance of damaging wind over 30 yrs
- Air quality 2/10 Low 1 unhealthy d/yr today · 1 by 30 yrs out
Nearby sold comps map
Loading sold comps map…
Walkable amenities ~0.75 mi
Loading nearby amenities…
Taxation est. · year 1
- Rental income
- $14,540
- − Mortgage interest
- −$8,117
- − Property taxes
- −$1,792
- − Insurance
- −$1,391
- − Repairs & maintenance
- −$1,163
- − Management
- −$1,163
- − Depreciation
- −$4,215
- Taxable loss
- −$3,301
- Est. tax savings @ 24.0%
- +$792
- After-tax cash flow
- $-22/yr
For passive investors: Depreciation is non-cash, so a rental often shows a tax loss while cash-flowing — sheltering income. Rental losses are passive: they offset passive income freely, and up to $25,000/yr can offset ordinary (W-2) income if you actively participate and your MAGI is under $100k (phasing out to $0 by $150k); unused losses carry forward. On sale, claimed depreciation is recaptured at up to 25%, and gains may owe capital-gains tax (a 1031 exchange can defer both). Figures are a year-1 estimate at your 24.0% rate — not tax advice; consult a CPA.
Condition & rehab AI · 12 photos
This updated two-bedroom home is in good condition with modern finishes and a low-maintenance exterior. It's ideal for both investors and homeowners looking for a move-in-ready property.
Value-add opportunities
- Both Paint exterior siding — Enhances curb appeal and value
- Both Replace gutters — Improves drainage and prevents water damage
Renovation cost estimate screening
Value-add ROI direction
- Both Paint exterior siding — Enhances curb appeal and value ↑
- Both Replace gutters — Improves drainage and prevents water damage ↑
ⓘ Cost ranges are severity-bucket heuristics (US national rule-of-thumb). Get contractor quotes + a written scope before underwriting a rehab budget.
Schools (NCES district)
- District
- Streator Twp Hsd 40
- NCES district ID
- 1738100
- Math proficiency
- 11% ▼ -4.00%
- Reading proficiency
- 19% ▼ -1.00%
- Median HH income
- $43,002
- Composite
- 13.07/100
- National rank
- #9561
- State rank
- #513 of 620 in IL
Livability — Streator
- Score
- 63/100
- State rank
- #752
- US rank
- #15266
Category grades
Schools grade is shown separately in the Schools card above.
Census & demographics
- Census place
- Streator, IL
- County
- La Salle County · 41,676 people
- City population
- 17,963
- Metro
- Ottawa, IL
- Population (ZIP)
- 17,963
- Household income
- $59,060
- Rent vs Own
- Severe rent burden
- 450.0
Population outlook (LaSalle County) Hauer SSP2
- Today (2025)
- 107,080 people
- By 2030
- 104,196 · -2.7%
- By 2040
- 97,413 · -9.0%
- By 2050
- 90,294 · -15.7%
- By 2075
- 76,252 · -28.8%
- By 2100
- 61,339 · -42.7%
Race, ethnicity, and origin ACS 2023
- Neighborhood character
- Predominantly White (83%)
- Race & ethnicity
- White 83% Hispanic / Latino 11% Two or more races 4% Black 3%
- Hispanic origin (detail)
- Mexican 10%
- Common ancestry
- Romanian 3% Lithuanian 2% Slovak 2%
- Foreign-born
- 3% · Canada
- Languages at home
- 93% English-only · Spanish 6%
Political lean MEDSL · LaSalle
- 2024 margin
- R (+18.5) · D 40.1% · R 58.6% · Other 1.3%
- 2008→2024 swing
- -29.6pp toward R · 2008: 11.1pp · 2024: -18.5pp
- All cycles
- 2024: R+18.5 2020: R+14.3 2016: R+14.4 2012: R+0.4 2008: D+11.1
Not yet ingested
- Civics
- —
Market trends
- HPI YoY
- ▼ -105.28%
- Current HPI
- 233.5533
- Rent YoY
- —
- Metro
- Ottawa, IL
- State GDP YoY
- ▲ 1.59%
- F500 in state
- 60
Industry mix (Fortune 500 HQ in IL)
| Industry | F500 HQs | Revenue |
|---|---|---|
| Insurance | 4 | $201B |
|
||
| Consumer Goods | 4 | $87B |
|
||
| Industrial Machinery | 3 | $64B |
|
||
| Healthcare | 2 | $55B |
|
||
| Retail / Pharmacy | 1 | $148B |
|
||
| Agriculture / Food | 1 | $86B |
|
||
Price history
+320.0% since first listed11 events — show timeline
- 2026-06-04 Listed $144,900 NWIAR
- 2026-06-04 Listed $144,900 MRED as Distributed by MLS Grid
- 2024-11-08 Listing Removed — MRED as Distributed by MLS Grid
- 2024-05-09 Listed — MRED as Distributed by MLS Grid
- 2022-11-01 Listing Removed — MRED as Distributed by MLS Grid
- 2022-09-06 Listed — MRED as Distributed by MLS Grid
- 2022-08-17 Listing Removed — MRED as Distributed by MLS Grid
- 2022-05-25 Listed — MRED as Distributed by MLS Grid
- 2021-10-06 Sold (Public Records) $28,000 Public Records
- 2017-10-06 Sold (MLS) $26,500 MRED as Distributed by MLS Grid
- 2017-07-11 Listed $34,500 MRED as Distributed by MLS Grid
Property tax history
+6.5%/yrLatest (2024): $1,792 · +8.1% YoY. Source: county tax records.
Cash-flow waterfall
monthlySold comps — $/sqft
last 12 mo · ≤1 miLoading sold comps…