1889 Harmony Rd · Villa Rica, GA
Flood risk 1/10 · Minimal
- FEMA flood zone
- X (unshaded)
- Chance of flooding over 30 yrs
- 0.0%
- Est. flood insurance / yr
- $507 – $1,088
Fire risk 3/10 · Minor
- Est. fire insurance / yr
- $963 – $1,789
Heat risk 4/10 · Minor
- Hot days now (above 103°F)
- 7 days/yr
- Hot days in 30 yrs
- 19 days/yr
Wind risk 6/10 · Moderate
- Chance of severe wind over 30 yrs
- 27.0%
Air-quality risk 3/10 · Minor
- Unhealthy air days now
- 3 days/yr
- Unhealthy air days in 30 yrs
- 4 days/yr
Risk factors via First Street. Map © Google.
Why this score? — see what drove the D- grade
The composite is a weighted blend of 9 inputs, each scored 0–100. Each bar is that input's sub-score; the figure is the points it added to the 100-point composite (weight × sub-score).
- Appreciation +10.0/10.0
- ARV discount +7.5/15.0
- Cash flow +5.8/30.0
- Schools +3.6/10.0
- Livability +3.2/5.0
- Rent growth +2.5/5.0
- Condition / age +2.5/5.0
- DSCR +0.2/10.0
- 1% rule +0.0/10.0
$413,300
🖨 Deal sheet (PDF) 📄 Offer letter ✓ Due diligence
Listing remarks
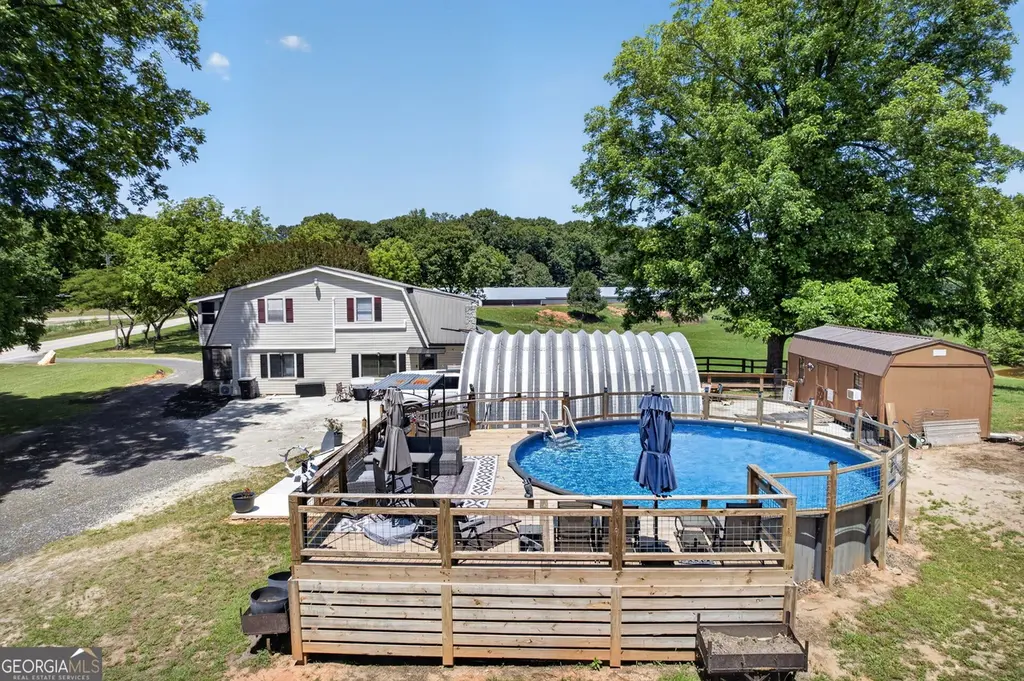
Step into this charming 1935 farmhouse on 12 acres of 100 year old, mostly flat land! This 4-bedroom, 3-bath home with an office offers nearly 3,000 square feet. Enjoy stainless steel appliances, a metal roof, and a propane water heater. Relax by the 27-foot above-ground pool with new decking and lights. There's a dome-shaped metal carport, a 12x24 shed with electric, and both county water plus two wells on private septic. A perfect blend of history, space, and potential awaits! SOLD AS IS
Key facts
- 12.05 acre lot
- Pool
- Built 1935
Property features AI
Exterior
- Parking: Covered parking
- Utilities: Public and well water available; Septic tank sewer; Electricity available; Cable available; Phone service available; Water available
- Home design: Two levels
- Construction: Frame construction with wood siding; Metal roof; Slab foundation; Built as existing/resale property
- Exterior features: Private entrance; Private yard; Storage; Covered rear porch; Covered deck; Back yard fencing; Above-ground pool; Deeded access to dock; Gazebo, pergola, outbuilding and shed(s)
Interior
- Kitchen: Country-style kitchen; Dishwasher; Electric range; Microwave; Refrigerator; Kitchen opens to family room
- Bedrooms: One main-level bedroom; Three upper-level bedrooms; Oversized master bedroom
- Flooring: Carpet; Laminate
- Bathrooms: Three full bathrooms; One main-level bathroom; Two full upper-level bathrooms; Master bathroom with tub/shower combination
- Heating & cooling: Ductless heating; Ductless cooling; Gas water heater
- Interior features: One factory-built fireplace; Open view from kitchen to family room; Office; No shared/common walls; Resale condition
- Laundry & utility: Main-level laundry room
Neighborhood map
What this means for you Summary
Snapshot
- This is a 4-bed/2.0-bath land listed at $413k.
Deal economics
- At list price, monthly cash flow is $-833 ($-10k/yr) — negative.
- To cash-flow at today's rent, offer at most $266k (35.6% below list).
- To meet the 1% rule (rent ≥ 1% of price), the offer needs to be $201k (51.4% below list).
- Recommended offer: $201k (51.4% below list) — sets the bar for 1% rule.
Location & tenants
- Location reads 65/100 on livability (#224 in GA) — a middle-class / working-renter tenant base. Strengths: cost of living A+, housing A+, employment B; Watch: amenities F, commute F, health & safety F.
- Paulding County (suburban): math 39% / reading 42% proficiency, ranked #33 of 174 in GA (top 19%) — families likely to look elsewhere, expect single-tenant / working-renter base with shorter leases.
- Zoned schools: Union Elementary School (math 49% / reading 40%, grade F, #336 of 1,228 statewide, top 29%, 465 students, 42% FRL); Carl Scoggins Sr. Middle School (math 29% / reading 40%, grade F, #196 of 470 statewide, top 42%, 760 students, 47% FRL); South Paulding High School (math 20% / reading 32%, grade F, #175 of 424 statewide, top 42%, 1,911 students, 36% FRL).
- Market conditions: 191 active listings in the ZIP; solid renter incomes; 1,458 units permitted in Paulding County in 2024 (0 in 5+ unit buildings).
- This rent runs 32% of the median local income ($77k/yr) — at the standard rent-burdened threshold; future hikes will face affordability resistance.
Forward outlook
- In year one you build about $44k of equity ($3k loan paydown + $41k appreciation (10.0% local appreciation)).
- Paulding County population projected at +24% by 2050 — long-run rental-demand tailwind backs the buy-and-hold thesis.
- By year 2, paydown + projected appreciation supports a ~$71k cash-out refi (75% LTV) — recoverable capital for the next deal without selling this one.
Negotiation context
- It's been on market 17 days — a 2% lower offer ($407k) is reasonable based on typical stale-listing flexibility.
- 2 sale attempts with the ask held roughly flat each time — persistent listings suggest the price (not the market) is what's stuck; bring a comps-based counter.
Risks & watch-outs
- Watch-outs: built in 1935 — expect roof / HVAC / electrical / plumbing capex.
- Climate carrying-cost: major wind risk, 27% chance of damaging wind over 30y — expect insurance premiums to compound above CPI over the hold.
Questions for the listing agent
- What do current leases actually rent for vs. the listed asking? Can we see a recent rent roll and the last 12 months of T-12 income?
- Built in 1935 — when were the roof, HVAC, electrical panel, plumbing, and water heater last replaced?
- Is there a deadline driving the sale (1031 exchange, divorce, estate, relocation)? That informs how much negotiation room exists.
- The area grade is low — what's the realistic commute time and amenity access for the typical tenant pool here? Any planned neighborhood developments (good or bad) we should know about?
- What's the average days-on-market for RENTAL listings here right now (not sales)? A rising rental-DOM trend means longer vacancies and softer asking-rent achievability than the comps imply.
- What's the recent tenant-quality profile in this submarket — average credit score on applications, eviction rate, late-payment / NSF rate, and stable-employment percentage? A property-management company in the area should have these aggregated.
- How much new for-sale + rental construction is in the pipeline within 1–3 miles? Heavy new supply typically softens prices + rents 12–24 months out; constrained supply supports both.
Investment metrics
- 1% rule
- 0.49% ✗
- Cap rate
- 3.87%
- Cash-on-cash
- -8.64%
- DSCR
- 0.62
- GRM
- 17.1
CMA / ARV
No comps found within radius.
Projected returns pro-forma
10.0% appreciation · 3.0% rent growth · sell at horizon
- IRR
- 18.2%
- Equity multiple
- 2.48×
- Total profit
- $171,790
- Equity at exit
- $372,333
- IRR
- 17.0%
- Equity multiple
- 5.73×
- Total profit
- $547,154
- Equity at exit
- $802,951
Cash invested: $115,724 (down + closing). Projections, not guarantees.
Landlord ↔ Tenant lean methodology
- Overall (STATE)
- 90 Strongly Landlord-Friendly
- State Georgia
- 90 Strongly Landlord-Friendly · R+3
- County
- — inherits STATE
- City
- — inherits STATE
ZIP-level market 30179
- Home prices YoY
- 6.7%
- Active inventory
- 191
- Price-to-rent
- 17.1×
Monthly cashflow live
- Estimated rent
- $2,011 medium interval (Pro) →
- Mortgage (P&I)
- −$2,167
- Tax from tax record
- −$82 /mo · $983/yr
- Insurance
- −$172
- HOA
- −$0
- Vacancy / Maint / Mgmt
- −$422
- Net cashflow
- $-833
Break-even live
Sensitivity live
| Price | -10% $-599 | -5% $-716 | +0% $-833 | +5% $-950 | +10% $-1,067 |
|---|---|---|---|---|---|
| Rent | -10% $-992 | -5% $-913 | +0% $-833 | +5% $-754 | +10% $-674 |
| Rate | -1.0pp $-625 | -0.5pp $-728 | base $-833 | +0.5pp $-940 | +1.0pp $-1,049 |
UW: 25.0% down · 7.5% · 30yr · 1.5% tax · 5.0% vac · 8.0% maint · 8.0% mgmt
Financing live
Cash to close
- Down payment
- $103,325
- Closing costs
- $12,399
- Reserves months
- —
- Total cash needed
- —
Loan-product check · same deal, 3 products live
Conventional
25% down · 7.5% · 30yr
- Down + closing
- —
- Monthly P&I
- —
- Monthly cashflow
- —
- DSCR
- —
- Eligible?
- —
Personal DTI + credit; lowest rate.
DSCR
20% down · 8.5% · 30yr
- Down + closing
- —
- Monthly P&I
- —
- Monthly cashflow
- —
- DSCR
- —
- Eligible?
- —
No personal income docs; deal must DSCR.
Hard money
10% down · 12.0% · 12mo
- Down + closing
- —
- Monthly P&I
- —
- Monthly cashflow
- —
- DSCR
- —
- Eligible?
- —
Short-term bridge; refi at stabilization.
Listing history 9 events
-
2026-06-03days on market $413,300 Active 17 DOM
-
2026-06-02days on market $413,300 Active 16 DOM
-
2026-06-01days on market $413,300 Active 15 DOM
-
2026-05-31days on market $413,300 Active 14 DOM
-
2026-05-21price $405,000
-
2026-05-21price $405,000 483-char remark
-
2026-05-17$413,300 Active
-
2026-05-16historical $413,300
-
2026-05-16$413,300 New 483-char remark
ⓘ Source: listings_history table (triggers on properties + properties_extension) + one-shot
backfill from property_details.listing_events for pre-trigger history.
Tax reassessment forecast GA · Resets to sale price
- Current annual tax
- $983 · $82/mo
- Projected year-2 tax
- $3,802 · $317/mo
- Expected delta
- +$2,819/yr (+$235/mo · 286.8%)
ⓘ Screening estimate from a state-policy table — verify with the county assessor before closing.
Climate risk First Street
- Flood 1/10 Low FEMA zone X (unshaded) · 0% chance over 30 yrs
- Wildfire 3/10 Moderate
- Heat 4/10 Moderate 7 d/yr ≥103°F today · 19 d/yr by 30 yrs out
- Wind 6/10 Major 27% chance of damaging wind over 30 yrs
- Air quality 3/10 Moderate 3 unhealthy d/yr today · 4 by 30 yrs out
Nearby sold comps map
Loading sold comps map…
Walkable amenities ~0.75 mi
Loading nearby amenities…
Taxation est. · year 1
- Rental income
- $24,126
- − Mortgage interest
- −$23,151
- − Property taxes
- −$983
- − Insurance
- −$2,066
- − Repairs & maintenance
- −$1,930
- − Management
- −$1,930
- − Depreciation
- −$12,023
- Taxable loss
- −$17,958
- Est. tax savings @ 24.0%
- +$4,310
- After-tax cash flow
- $-5,689/yr
For passive investors: Depreciation is non-cash, so a rental often shows a tax loss while cash-flowing — sheltering income. Rental losses are passive: they offset passive income freely, and up to $25,000/yr can offset ordinary (W-2) income if you actively participate and your MAGI is under $100k (phasing out to $0 by $150k); unused losses carry forward. On sale, claimed depreciation is recaptured at up to 25%, and gains may owe capital-gains tax (a 1031 exchange can defer both). Figures are a year-1 estimate at your 24.0% rate — not tax advice; consult a CPA.
Schools (NCES district)
- District
- Paulding County
- NCES district ID
- 1304020
- Math proficiency
- 39% ▼ -6.00%
- Reading proficiency
- 42% ▼ -7.00%
- Median HH income
- $61,447
- Composite
- 36.0/100
- National rank
- #4784
- State rank
- #33 of 174 in GA
Livability — Villa Rica
- Score
- 65/100
- State rank
- #224
- US rank
- #13182
Category grades
Schools grade is shown separately in the Schools card above.
Census & demographics
- County
- Carroll County · 124,888 people
- City population
- 43,013
- Metro
- Atlanta-Sandy Springs-Alpharetta, GA
- Population (ZIP)
- 19,882
- Household income
- $76,571
- Rent vs Own
- Severe rent burden
- 396.0
Population outlook (Paulding County) Hauer SSP2
- Today (2025)
- 175,714 people
- By 2030
- 186,082 · +5.9%
- By 2040
- 204,414 · +16.3%
- By 2050
- 217,040 · +23.5%
- By 2075
- 236,980 · +34.9%
- By 2100
- 238,314 · +35.6%
Race, ethnicity, and origin ACS 2023
- Neighborhood character
- Predominantly White (77%)
- Race & ethnicity
- White 77% Black 15% Hispanic / Latino 5% Two or more races 4%
- Common ancestry
- Italian 1% Lithuanian 1% Serbian 1%
- Foreign-born
- 4% · Canada
- Languages at home
- 95% English-only · Spanish 4%
Political lean MEDSL · Paulding
- 2024 margin
- Strong R (+24.1) · D 37.6% · R 61.7%
- 2008→2024 swing
- +14.4pp toward D · 2008: -38.5pp · 2024: -24.1pp
- All cycles
- 2024: R+24.1 2020: R+29.1 2016: R+41.2 2012: R+43.6 2008: R+38.5
Not yet ingested
- Civics
- —
Market trends
- HPI YoY
- ▲ 27.16%
- Current HPI
- 435.3863
- Rent YoY
- —
- Metro
- Atlanta-Sandy Springs-Alpharetta, GA
- State GDP YoY
- ▲ 2.66%
- F500 in state
- 28
Industry mix (Fortune 500 HQ in GA)
| Industry | F500 HQs | Revenue |
|---|---|---|
| Paper / Packaging | 2 | $29B |
|
||
| Retail | 1 | $160B |
|
||
| Transportation / Logistics | 1 | $91B |
|
||
| Airlines | 1 | $62B |
|
||
| Consumer Goods | 1 | $47B |
|
||
| Utilities | 1 | $25B |
|
||
Price history
+0.0% since first listed11 events — show timeline
- 2026-06-04 Listing Removed — GAMLS
- 2026-06-03 Listing Removed — FMLS
- 2026-05-28 Price Changed $413,300 FMLS
- 2026-05-28 Price Changed $413,300 GAMLS
- 2026-05-22 Price Changed $397,000 FMLS
- 2026-05-22 Price Changed $397,000 GAMLS
- 2026-05-21 Price Changed $405,000 FMLS
- 2026-05-21 Price Changed $405,000 GAMLS
- 2026-05-17 Listed $413,300 FMLS
- 2026-05-16 Coming Soon — FMLS
- 2026-05-16 Listed $413,300 GAMLS
Property tax history
+2.7%/yrLatest (2025): $983 · -3.4% YoY. Source: county tax records.
Cash-flow waterfall
monthlySold comps — $/sqft
last 12 mo · ≤1 miLoading sold comps…