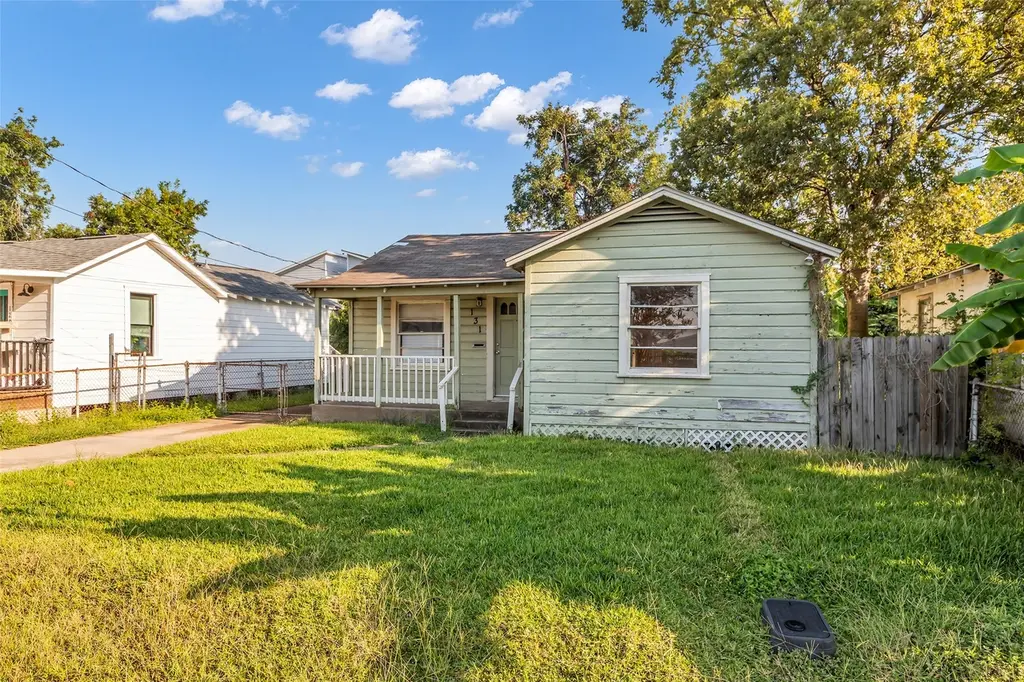
131 E 31st 1/2 St · Houston, TX
Flood risk 5/10 · Moderate
- FEMA flood zone
- X (unshaded)
- Chance of flooding over 30 yrs
- 0.52%
- Est. flood insurance / yr
- $507 – $1,088
Fire risk 1/10 · Minimal
- Est. fire insurance / yr
- $1,222 – $2,270
Heat risk 9/10 · Severe
- Hot days now (above 109°F)
- 7 days/yr
- Hot days in 30 yrs
- 22 days/yr
Wind risk 9/10 · Severe
- Chance of severe wind over 30 yrs
- 99.0%
Air-quality risk 3/10 · Minor
- Unhealthy air days now
- 2 days/yr
- Unhealthy air days in 30 yrs
- 3 days/yr
Risk factors via First Street. Map © Google.
Why this score? — see what drove the D grade
The composite is a weighted blend of 9 inputs, each scored 0–100. Each bar is that input's sub-score; the figure is the points it added to the 100-point composite (weight × sub-score).
- ARV discount +12.4/15.0
- Cash flow +11.1/30.0
- Livability +3.7/5.0
- DSCR +3.2/10.0
- 1% rule +3.1/10.0
- Rent growth +2.8/5.0
- Schools +2.7/10.0
- Condition / age +2.5/5.0
- Appreciation +0.0/10.0
$250,000
🖨 Deal sheet (PDF) 📄 Offer letter ✓ Due diligence
Listing remarks MLS
Opportunity knocks! Sweet bungalow in Independence Heights' Starkwether Historic District on a coveted 5,000 sq ft double lot! Surrounded by renovated cottages, new construction, top local eateries + shopping and a welcoming community, this is an excellent location for commuters and city explorers alike. This light-filled home was updated in 2015 with HVAC and the main water line was replaced in 2024. Enjoy an efficient layout with space for a full-size stackable washer/dryer in the spacious and bright kitchen which has room for a big farm table. The back yard offers endless possibilities—you could enjoy veggie and pollinator gardens or simply relax and entertain. Excellent neighbors! Move-in ready and full of potential—don’t miss this sweet slice of history in a true Houston Historic District. Call us to see this home today.
Key facts
- Original hardwoods
- Spacious backyard
- Double lot
Tags
Neighborhood map
What this means for you Summary
Snapshot
- This is a 2-bed/1.0-bath single-family listed at $250k.
Deal economics
- At list price, monthly cash flow is $-98 ($-1k/yr) — negative.
- To cash-flow at today's rent, offer at most $233k (6.9% below list).
- To meet the 1% rule (rent ≥ 1% of price), the offer needs to be $202k (19.2% below list).
- Recommended offer: $202k (19.2% below list) — sets the bar for 1% rule.
- Cap rate 5.8% vs local median 3.2% in Houston — top-decile yield for the area; either an underpriced asset or a hidden risk that comps aren't pricing in. Stress-test before assuming the spread holds.
Location & tenants
- Location reads 74/100 on livability (#184 in TX, #4,771 nationally) — a middle-class / working-renter tenant base. Strengths: amenities A+, cost of living A+, housing A+; Watch: crime F.
- Houston ISD (urban): math 27% / reading 35% proficiency, ranked #593 of 826 in TX (top 72%) — families likely to look elsewhere, expect single-tenant / working-renter base with shorter leases; 71% free/reduced lunch — lower-income household profile, screen leases tightly.
- Zoned schools: Burrus El (math 22% / reading 27%, grade F, #3,052 of 4,322 statewide, top 74%, 246 students, 98% FRL); Hamilton Middle (math 30% / reading 44%, grade F, #756 of 1,662 statewide, top 47%, 823 students, 86% FRL); Washington B T H S (math 27% / reading 25%, grade F, #1,234 of 1,632 statewide, top 76%, 878 students, 96% FRL) — zoned schools average 93% FRL vs 71% district-wide (22 pts higher); higher-poverty schools than district average — tighter screening recommended.
- Market conditions: Rents rising (+1.1%/yr); 508 active listings in the ZIP; 40 comparable units currently listed for rent nearby; rentals leasing fast (median 14d on market — plan ~1-2 weeks tenant-placement turnaround); high-income renter base; 29,883 units permitted in Harris County in 2024 (8,621 in 5+ unit buildings).
Forward outlook
- Local home prices are declining (-3.0%/yr); year-one equity from $2k of loan paydown is wiped out by about $8k of value loss. Plan a longer hold.
- Harris County population projected at +47% by 2050 — long-run rental-demand tailwind backs the buy-and-hold thesis.
Negotiation context
- It's been on market 277 days — a 12% lower offer ($220k) is reasonable based on typical stale-listing flexibility.
- 2 sale attempts since 12y ago; this cycle's ask has dropped $149k (37%) from the opening price — seller is motivated, your offer sets the floor, not the list.
Risks & watch-outs
- Watch-outs: built in 1950 — expect roof / HVAC / electrical / plumbing capex.
- Climate carrying-cost: moderate flood risk; severe wind risk, 99% chance of damaging wind over 30y; extreme-heat days projected 7→22/yr by 2055 (HVAC capex compounding) — expect insurance premiums to compound above CPI over the hold.
Questions for the listing agent
- What do current leases actually rent for vs. the listed asking? Can we see a recent rent roll and the last 12 months of T-12 income?
- It's been on market 277 days. Have you received any prior offers? Is the seller open to a 19% concession, seller financing, or rate buy-down credit?
- Built in 1950 — when were the roof, HVAC, electrical panel, plumbing, and water heater last replaced?
- Why hasn't it sold? Are there any deal-killer items the seller is aware of (foundation, flood, title, zoning, code violations)?
- Is there a deadline driving the sale (1031 exchange, divorce, estate, relocation)? That informs how much negotiation room exists.
- Schools are D-rated, which usually means shorter tenancies and higher turnover. Who's the typical renter profile here, and what's been the actual vacancy rate?
- Crime grade is F in this area — have there been break-ins, vandalism, or insurance claims at this property in the last 3 years? What carrier currently insures it and at what premium?
- The area grade is low — what's the realistic commute time and amenity access for the typical tenant pool here? Any planned neighborhood developments (good or bad) we should know about?
- What's the average days-on-market for RENTAL listings here right now (not sales)? A rising rental-DOM trend means longer vacancies and softer asking-rent achievability than the comps imply.
- What's the recent tenant-quality profile in this submarket — average credit score on applications, eviction rate, late-payment / NSF rate, and stable-employment percentage? A property-management company in the area should have these aggregated.
- How much new for-sale + rental construction is in the pipeline within 1–3 miles? Heavy new supply typically softens prices + rents 12–24 months out; constrained supply supports both.
Investment metrics
- 1% rule
- 0.81% ✗
- Cap rate
- 5.82%
- Cash-on-cash
- -1.69%
- DSCR
- 0.92
- GRM
- 10.3
CMA / ARV
- ARV (median comp)
- $280,822
- List price
- $250,000
- Delta
- -10.98%
- Verdict
- UNDERPRICED
- Comps
- 20 within 1.0 mi
Show comp detail 10 sales within ~0.75 mi
| Address | Dist | Beds/Ba | Sqft | Sold | Price | $/sf | Match |
|---|---|---|---|---|---|---|---|
| 202 E 31st 1/2 St | 0.04mi | 2/1.0 | 962 (+13%) | 9mo | $399,000 | $415 | 69 |
| 118 E 24th St | 0.54mi | 2/1.0 | 888 (+4%) | 2mo | $495,000 | $557 | 66 |
| 210 E 37th St | 0.29mi | 2/1.0 | 940 (+10%) | 19mo | $210,000 | $223 | 53 |
| 208 Marathon St | 0.49mi | 2/1.0 | 780 (-8%) | 14mo | $169,900 | $218 | 52 |
| 209 Hyta St | 0.71mi | 3/1.0 (+1) | 886 (+4%) | 7mo | $239,500 | $270 | 49 |
| 622 E 27th St | 0.49mi | 2/2.0 | 960 (+13%) | 5mo | $385,000 | $401 | 47 |
| 804 E 39th St | 0.70mi | 2/1.0 | 960 (+13%) | 0mo | $179,900 | $187 | 46 |
| 210 Blueberry St | 0.68mi | 2/1.0 | 780 (-8%) | 14mo | $160,000 | $205 | 43 |
| 716 E 40th St | 0.67mi | 3/1.0 (+1) | 940 (+10%) | 7mo | $205,000 | $218 | 41 |
| 8406 N Main St | 0.67mi | 3/1.0 (+1) | 936 (+10%) | 19mo | $265,000 | $283 | 31 |
Match score weights: distance 35% · size 25% · config 20% · recency 20%. Top-matched comps best support the ARV.
Projected returns pro-forma
-3.0% appreciation · 1.08% rent growth · sell at horizon
- IRR
- -21.2%
- Equity multiple
- 0.28×
- Total profit
- $-50,594
- Equity at exit
- $37,276
- IRR
- -19.8%
- Equity multiple
- 0.04×
- Total profit
- $-67,205
- Equity at exit
- $21,615
Cash invested: $70,000 (down + closing). Projections, not guarantees.
Landlord ↔ Tenant lean methodology
- Overall (STATE)
- 87 Strongly Landlord-Friendly
- State Texas
- 87 Strongly Landlord-Friendly · R+5
- County
- — inherits STATE
- City
- — inherits STATE
ZIP-level market 77018
- Rents YoY
- 1.1%
- Active inventory
- 508
- Price-to-rent
- 10.3×
Monthly cashflow live
- Estimated rent
- $2,021 high interval (Pro) →
- Mortgage (P&I)
- −$1,311
- Tax from tax record
- −$280 /mo · $3,357/yr
- Insurance
- −$104
- HOA
- −$0
- Vacancy / Maint / Mgmt
- −$424
- Net cashflow
- $-98
Break-even live
Sensitivity live
| Price | -10% $43 | -5% $-28 | +0% $-98 | +5% $-169 | +10% $-240 |
|---|---|---|---|---|---|
| Rent | -10% $-258 | -5% $-178 | +0% $-98 | +5% $-19 | +10% $61 |
| Rate | -1.0pp $28 | -0.5pp $-35 | base $-98 | +0.5pp $-163 | +1.0pp $-229 |
UW: 25.0% down · 7.5% · 30yr · 1.5% tax · 5.0% vac · 8.0% maint · 8.0% mgmt
Financing live
Cash to close
- Down payment
- $62,500
- Closing costs
- $7,500
- Reserves months
- —
- Total cash needed
- —
Loan-product check · same deal, 3 products live
Conventional
25% down · 7.5% · 30yr
- Down + closing
- —
- Monthly P&I
- —
- Monthly cashflow
- —
- DSCR
- —
- Eligible?
- —
Personal DTI + credit; lowest rate.
DSCR
20% down · 8.5% · 30yr
- Down + closing
- —
- Monthly P&I
- —
- Monthly cashflow
- —
- DSCR
- —
- Eligible?
- —
No personal income docs; deal must DSCR.
Hard money
10% down · 12.0% · 12mo
- Down + closing
- —
- Monthly P&I
- —
- Monthly cashflow
- —
- DSCR
- —
- Eligible?
- —
Short-term bridge; refi at stabilization.
Rent comps 40 comps
| Address | Beds | Baths | Sqft | Rent | $/sqft | DOM | Units | Dist |
|---|---|---|---|---|---|---|---|---|
| 322 E 33rd St Houston, TX | 2.0 | 1.0 | 1100 | $1,500 | $1.36 | 45d | 1 | 0.21mi |
| 401 W 25th St Houston, TX | 1.0–2.0 | 1.0–2.0 | 974 | $3,481 | $3.57 | 3d | 19 | 0.53mi |
| 2200 Yale St Unit 1315 Houston, TX | 1.0 | 1.0 | 748 | $1,331 | $1.78 | 45d | 1 | 0.58mi |
| 2200 Yale St Unit 4127 Houston, TX | 1.0 | 1.0 | 828 | $1,355 | $1.64 | 45d | 1 | 0.58mi |
| 2135 Yale St Houston, TX | 1.0 | 1.0 | 627 | $1,500 | $2.39 | 45d | 1 | 0.64mi |
| 2125 Yale St Houston, TX | 1.0 | 1.0 | 627 | $1,575 | $2.51 | 45d | 1 | 0.67mi |
| 2125 Yale St Unit 435 Houston, TX | 1.0 | 1.0 | 761 | $2,043 | $2.68 | 45d | 1 | 0.67mi |
| 2125 Yale St Houston, TX | 2.0 | 2.0 | 1087 | $2,500 | $2.30 | 22d | 1 | 0.67mi |
| 2125 Yale St Unit 1187 Houston, TX | 1.0 | 1.0 | 761 | $2,024 | $2.66 | 0d | 1 | 0.68mi |
| 2125 Yale St Unit 2187 Houston, TX | 2.0 | 2.0 | 1087 | $2,489 | $2.29 | 0d | 1 | 0.68mi |
| 2125 Yale St Unit 2140 Houston, TX | 1.0 | 1.0 | 627 | $1,710 | $2.73 | 16d | 1 | 0.68mi |
| 2125 Yale St Apt 425 Houston, TX | 2.0 | 2.0 | 1087 | $2,505 | $2.30 | 9d | 1 | 0.68mi |
| 2125 Yale St Apt 321 Houston, TX | 1.0 | 1.0 | 761 | $2,035 | $2.67 | 9d | 1 | 0.68mi |
| 2125 Yale St Unit 2187 Houston, TX | 2.0 | 2.0 | 1087 | $2,540 | $2.34 | 6d | 1 | 0.68mi |
| 2125 Yale St Unit 2148 Houston, TX | 2.0 | 2.0 | 1087 | $2,529 | $2.33 | 13d | 1 | 0.68mi |
| 2125 Yale St Unit 2140 Houston, TX | 1.0 | 1.0 | 761 | $2,074 | $2.73 | 12d | 1 | 0.68mi |
| 501 W 24th St Houston, TX | 1.0 | 1.0 | 630 | $1,275 | $2.02 | 26d | 1 | 0.68mi |
| 525 W 24th St Houston, TX | 1.0–2.0 | 1.0–2.0 | 926 | $2,740 | $2.96 | 0d | 24 | 0.70mi |
| 436 W 23rd St Apt 2 Houston, TX | 1.0 | 1.0 | 650 | $1,150 | $1.77 | 45d | 1 | 0.72mi |
| 3405 N Shepherd Dr Houston, TX | 1.0–3.0 | 1.0–2.0 | 910 | $1,573 | $1.73 | 0d | 15 | 0.82mi |
| 698 W 24th St Houston, TX | 2.0 | 2.0 | 1123 | $2,488 | $2.22 | 26d | 1 | 0.88mi |
| 515 W 20th St Houston, TX | 1.0–2.0 | 1.0–2.0 | 942 | $2,444 | $2.59 | 1d | 22 | 0.90mi |
| 736 W 26th St Houston, TX | 1.0 | 1.0 | 737 | $1,788 | $2.43 | 45d | 1 | 0.92mi |
| 521 W 20th St Houston, TX | 1.0 | 1.0 | 662 | $1,709 | $2.58 | 45d | 1 | 0.92mi |
| 268 W Crosstimbers St Houston, TX | 2.0 | 2.0 | 965 | $1,850 | $1.92 | 20d | 1 | 0.95mi |
| 1399 W Cavalcade St Houston, TX | 1.0 | 1.0 | 676 | $1,723 | $2.55 | 13d | 1 | 0.97mi |
| 214 W 17th St Unit 03 Houston, TX | 2.0 | 1.0 | 667 | $1,395 | $2.09 | 45d | 1 | 0.99mi |
| 551 W 19th St Houston, TX | 2.0 | 2.0 | 1098 | $2,800 | $2.55 | 45d | 1 | 1.01mi |
| 616 W 20th St Houston, TX | 1.0 | 1.0 | 691 | $1,554 | $2.25 | 3d | 9 | 1.01mi |
| 555 W 19th St Houston, TX | 1.0–2.0 | 1.0–2.0 | 907 | $3,027 | $3.34 | 0d | 19 | 1.01mi |
| 2101 N Shepherd Dr Houston, TX | 1.0 | 1.0 | 666 | $1,414 | $2.12 | 45d | 15 | 1.01mi |
| 641 W Crosstimbers St Houston, TX | 1.0–2.0 | 1.0–2.0 | 866 | $2,237 | $2.58 | 1d | 38 | 1.02mi |
| 880 W 34th St Unit 903 Houston, TX | 2.0 | 2.0 | 1027 | $2,255 | $2.20 | 13d | 1 | 1.06mi |
| 880 W 34th St Unit 922 Houston, TX | 1.0 | 1.0 | 639 | $1,810 | $2.83 | 12d | 1 | 1.06mi |
| 880 W 34th St Unit 2165 Houston, TX | 2.0 | 2.0 | 1027 | $2,296 | $2.24 | 0d | 1 | 1.06mi |
| 880 W 34th St Unit 2148 Houston, TX | 2.0 | 2.0 | 1027 | $2,255 | $2.20 | 0d | 1 | 1.06mi |
| 880 W 34th St Unit 165 Houston, TX | 1.0 | 1.0 | 639 | $1,780 | $2.79 | 0d | 1 | 1.06mi |
| 880 W 34th St Unit 895 Houston, TX | 1.0 | 1.0 | 784 | $1,695 | $2.16 | 15d | 1 | 1.06mi |
| 880 W 34th St Unit 174 Houston, TX | 1.0 | 1.0 | 639 | $1,821 | $2.85 | 13d | 1 | 1.06mi |
| 880 W 34th St Unit 2174 Houston, TX | 2.0 | 2.0 | 1027 | $2,306 | $2.25 | 12d | 1 | 1.06mi |
Listing history 22 events
-
2026-06-21days on market $250,000 Active 277 DOM
-
2026-06-18days on market $250,000 Active 274 DOM
-
2026-06-17days on market $250,000 Active 273 DOM
-
2026-06-16days on market $250,000 Active 272 DOM
-
2026-06-15days on market $250,000 Active 271 DOM
-
2026-06-13days on market $250,000 Active 269 DOM
-
2026-06-10days on market $250,000 Active 265 DOM
-
2026-06-08remarks 699-char remark
-
2026-06-08days on market $250,000 Active 264 DOM
-
2026-06-07days on market $250,000 Active 263 DOM
-
2026-06-04days on market $250,000 Active 260 DOM
-
2026-06-01days on market $250,000 Active 257 DOM
-
2026-05-31days on market $250,000 Active 256 DOM
-
2026-02-26price $250,000 855-char remark
Show marketing remark (855 chars)
Opportunity knocks! Sweet bungalow in Independence Heights' Starkwether Historic District on a coveted 5,000 sq ft double lot! Surrounded by renovated cottages, new construction, top local eateries + shopping and a welcoming community, this is an excellent location for commuters and city explorers alike. This light-filled home was updated in 2015 with HVAC and the main water line was replaced in 2024. Enjoy an efficient layout with space for a full-size stackable washer/dryer in the spacious and bright kitchen which has room for a big farm table. The back yard offers endless possibilities—you could enjoy veggie and pollinator gardens or simply relax and entertain. Excellent neighbors! Move-in ready and full of potential—don’t miss this sweet slice of history in a true Houston Historic District. Call us to see this home today.
-
2025-10-09price $299,999 855-char remark
Show marketing remark (855 chars)
Opportunity knocks! Sweet bungalow in Independence Heights' Starkwether Historic District on a coveted 5,000 sq ft double lot! Surrounded by renovated cottages, new construction, top local eateries + shopping and a welcoming community, this is an excellent location for commuters and city explorers alike. This light-filled home was updated in 2015 with HVAC and the main water line was replaced in 2024. Enjoy an efficient layout with space for a full-size stackable washer/dryer in the spacious and bright kitchen which has room for a big farm table. The back yard offers endless possibilities—you could enjoy veggie and pollinator gardens or simply relax and entertain. Excellent neighbors! Move-in ready and full of potential—don’t miss this sweet slice of history in a true Houston Historic District. Call us to see this home today.
-
2025-09-17$399,000 Active 855-char remark
Show marketing remark (855 chars)
Opportunity knocks! Sweet bungalow in Independence Heights' Starkwether Historic District on a coveted 5,000 sq ft double lot! Surrounded by renovated cottages, new construction, top local eateries + shopping and a welcoming community, this is an excellent location for commuters and city explorers alike. This light-filled home was updated in 2015 with HVAC and the main water line was replaced in 2024. Enjoy an efficient layout with space for a full-size stackable washer/dryer in the spacious and bright kitchen which has room for a big farm table. The back yard offers endless possibilities—you could enjoy veggie and pollinator gardens or simply relax and entertain. Excellent neighbors! Move-in ready and full of potential—don’t miss this sweet slice of history in a true Houston Historic District. Call us to see this home today.
-
2015-01-26soldstatus
-
2015-01-22soldstatus Sold 241-char remark
Show marketing remark (241 chars)
INVESTOR'S DELIGHT! ADORABLE 2/1 LOCATED IN URBAN HEIGHTS AREA NEAR 610 AND I45. ESTABLISHED COMMUNITY WITHIN MINUTES OF ALL MAJOR ACTIVITIES IN THE CITY, WITH NEW DEVELOPMENT ACTIVITY AND GROWTH ''AS IS WHERE IS'' SELLER TO MAKE NO REPAIRS.
-
2015-01-15status Pending 241-char remark
Show marketing remark (241 chars)
INVESTOR'S DELIGHT! ADORABLE 2/1 LOCATED IN URBAN HEIGHTS AREA NEAR 610 AND I45. ESTABLISHED COMMUNITY WITHIN MINUTES OF ALL MAJOR ACTIVITIES IN THE CITY, WITH NEW DEVELOPMENT ACTIVITY AND GROWTH ''AS IS WHERE IS'' SELLER TO MAKE NO REPAIRS.
-
2014-12-23$99,000 Active 241-char remark
Show marketing remark (241 chars)
INVESTOR'S DELIGHT! ADORABLE 2/1 LOCATED IN URBAN HEIGHTS AREA NEAR 610 AND I45. ESTABLISHED COMMUNITY WITHIN MINUTES OF ALL MAJOR ACTIVITIES IN THE CITY, WITH NEW DEVELOPMENT ACTIVITY AND GROWTH ''AS IS WHERE IS'' SELLER TO MAKE NO REPAIRS.
-
2002-11-25soldstatus
-
1995-01-20soldstatus
ⓘ Source: listings_history table (triggers on properties + properties_extension) + one-shot
backfill from property_details.listing_events for pre-trigger history.
Tax reassessment forecast TX · Resets to sale price
- Current annual tax
- $3,357 · $280/mo
- Projected year-2 tax
- $4,575 · $381/mo
- Expected delta
- +$1,218/yr (+$102/mo · 36.3%)
ⓘ Screening estimate from a state-policy table — verify with the county assessor before closing.
Climate risk First Street
- Flood 5/10 Major FEMA zone X (unshaded) · 52% chance over 30 yrs
- Wildfire 1/10 Low
- Heat 9/10 Extreme 7 d/yr ≥109°F today · 22 d/yr by 30 yrs out
- Wind 9/10 Extreme 99% chance of damaging wind over 30 yrs
- Air quality 3/10 Moderate 2 unhealthy d/yr today · 3 by 30 yrs out
Nearby sold comps map
Loading sold comps map…
Walkable amenities ~0.75 mi
Loading nearby amenities…
Taxation est. · year 1
- Rental income
- $24,252
- − Mortgage interest
- −$14,004
- − Property taxes
- −$3,357
- − Insurance
- −$1,250
- − Repairs & maintenance
- −$1,940
- − Management
- −$1,940
- − Depreciation
- −$7,273
- Taxable loss
- −$5,512
- Est. tax savings @ 24.0%
- +$1,323
- After-tax cash flow
- $143/yr
For passive investors: Depreciation is non-cash, so a rental often shows a tax loss while cash-flowing — sheltering income. Rental losses are passive: they offset passive income freely, and up to $25,000/yr can offset ordinary (W-2) income if you actively participate and your MAGI is under $100k (phasing out to $0 by $150k); unused losses carry forward. On sale, claimed depreciation is recaptured at up to 25%, and gains may owe capital-gains tax (a 1031 exchange can defer both). Figures are a year-1 estimate at your 24.0% rate — not tax advice; consult a CPA.
Schools (NCES district)
- District
- Houston ISD
- NCES district ID
- 4823640
- Math proficiency
- 27% ▼ -18.00%
- Reading proficiency
- 35% ▼ -6.00%
- Median HH income
- $46,054
- Composite
- 26.63/100
- National rank
- #7173
- State rank
- #593 of 826 in TX
Livability — Houston
- Score
- 74/100
- State rank
- #184
- US rank
- #4771
Category grades
Schools grade is shown separately in the Schools card above.
Census & demographics
- Census place
- Houston, TX
- County
- Harris County · 4,702,590 people
- City population
- 3,226,434
- Metro
- Houston-The Woodlands-Sugar Land, TX
- Population (ZIP)
- 31,031
- Household income
- $127,017
- Rent vs Own
- Severe rent burden
- 1324.0
Population outlook (Harris County) Hauer SSP2
- Today (2025)
- 5,571,493 people
- By 2030
- 6,089,821 · +9.3%
- By 2040
- 7,142,806 · +28.2%
- By 2050
- 8,185,864 · +46.9%
- By 2075
- 10,574,329 · +89.8%
- By 2100
- 12,109,958 · +117.4%
Race, ethnicity, and origin ACS 2023
- Neighborhood character
- Diverse neighborhood (Simpson 0.63)
- Race & ethnicity
- White 52% Hispanic / Latino 31% Two or more races 18% Black 8% Asian 3%
- Hispanic origin (detail)
- Mexican 23%
- Common ancestry
- Lithuanian 3% Romanian 3% Italian 2%
- Foreign-born
- 13% · Canada
- Languages at home
- 74% English-only · Spanish 22% Other Indo-European 1% French/Haitian/Cajun 1%
Political lean MEDSL · Harris
- 2024 margin
- Lean D (+5.5) · D 52.0% · R 46.4% · Other 1.6%
- 2008→2024 swing
- +3.9pp toward D · 2008: 1.6pp · 2024: 5.5pp
- All cycles
- 2024: D+5.5 2020: D+13.3 2016: D+12.4 2012: D+0.1 2008: D+1.6
Not yet ingested
- Civics
- —
Market trends
- HPI YoY
- ▼ -532.49%
- Current HPI
- 263.9321
- Rent YoY
- ▲ 1.08%
- Metro
- Houston-The Woodlands-Sugar Land, TX
- State GDP YoY
- ▲ 3.95%
- F500 in state
- 110
Industry mix (Fortune 500 HQ in TX)
| Industry | F500 HQs | Revenue |
|---|---|---|
| Energy | 16 | $1,198B |
|
||
| Technology | 5 | $198B |
|
||
| Engineering / Construction | 4 | $72B |
|
||
| Energy Services | 3 | $60B |
|
||
| Utilities | 3 | $41B |
|
||
| Healthcare | 2 | $330B |
|
||
Price history
+152.5% since first listed9 events — show timeline
- 2026-02-26 Price Changed $250,000 HARMLS
- 2025-10-09 Price Changed $299,999 HARMLS
- 2025-09-17 Listed $399,000 HARMLS
- 2015-01-26 Sold (Public Records) — Public Records
- 2015-01-22 Sold (MLS) — HARMLS
- 2015-01-15 Pending — HARMLS
- 2014-12-23 Listed $99,000 HARMLS
- 2002-11-25 Sold (Public Records) — Public Records
- 1995-01-20 Sold (Public Records) — Public Records
Property tax history
+6.6%/yrLatest (2025): $3,357 · +9.3% YoY. Source: county tax records.
Cash-flow waterfall
monthlySold comps — $/sqft
last 12 mo · ≤1 miLoading sold comps…