1301 E Avenue I #370 · Lancaster, CA
Flood risk 1/10 · Minimal
- FEMA flood zone
- X (unshaded)
- Chance of flooding over 30 yrs
- 0.0%
- Est. flood insurance / yr
- $507 – $1,088
Fire risk 5/10 · Moderate
- Est. fire insurance / yr
- $659 – $1,223
Heat risk 7/10 · Major
- Hot days now (above 101°F)
- 5 days/yr
- Hot days in 30 yrs
- 12 days/yr
Wind risk 1/10 · Minimal
- Chance of severe wind over 30 yrs
- —
Air-quality risk 8/10 · Major
- Unhealthy air days now
- 16 days/yr
- Unhealthy air days in 30 yrs
- 21 days/yr
Risk factors via First Street. Map © Google.
Why this score? — see what drove the B- grade
The composite is a weighted blend of 9 inputs, each scored 0–100. Each bar is that input's sub-score; the figure is the points it added to the 100-point composite (weight × sub-score).
- Cash flow +30.0/30.0
- 1% rule +10.0/10.0
- DSCR +10.0/10.0
- ARV discount +6.0/15.0
- Livability +3.4/5.0
- Rent growth +2.5/5.0
- Schools +2.5/10.0
- Condition / age +2.5/5.0
- Appreciation +0.0/10.0
$195,000
🖨 Deal sheet 📄 Offer letter ✓ Due diligence
Listing remarks MLS
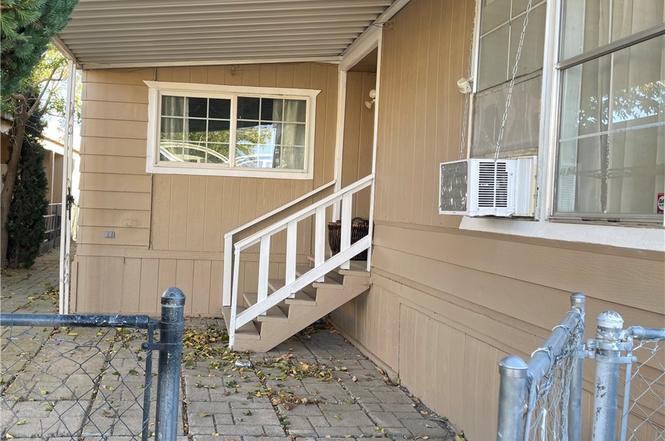
Experience the space and comfort of a triple-wide mobile home in a friendly, well-maintained community. Close the clubhouse, the park area. This property has 4 bedrooms, 2 baths, a living room area, a dining room area, a lot of cabinets in the kitchen, etc. Please don't wait too long to see it.
Key facts
- Park area
- Built 1979
- Listed 230 days
Tags
Property features AI
Finance
- Other: Park name: Friendly Village; Manager approval required for occupancy; Triple body type (multi-unit designation); Lot density approximately 0–1 unit per acre; Directions: East Ave I to 15th St E
- HOA & community: Land lease in park (approximately $572/month); Park community amenities
Exterior
- Parking: Located in Friendly Village park
- Utilities: Public (district) water; Sewer or septic (unknown)
- Home design: Single-story mobile home (12' x 60'); Mobile home remains on site
- Construction: Year built per assessor; Assessor-provided living area
- Exterior features: No pool
Interior
- Bathrooms: 2 full bathrooms
- Interior features: Single-level entry
- Laundry & utility: Laundry inside the home
Neighborhood map
What this means for you Summary
Snapshot
- This is a 4-bed/2.0-bath manufactured listed at $195k.
Deal economics
- At list price, monthly cash flow is $1k ($15k/yr) — positive.
- The deal already cash-flows at list — no discount required.
- Meets the 1% rule at list price ($3k rent vs $195k).
- Recommended offer: $172k (12.0% below list) — sets the bar for market timing.
- Cap rate 13.8% vs local median 4.3% in Lancaster — top-decile yield for the area; either an underpriced asset or a hidden risk that comps aren't pricing in. Stress-test before assuming the spread holds.
Location & tenants
- Location reads 68/100 on livability (#282 in CA) — a middle-class / working-renter tenant base. Strengths: commute A+, housing A+, amenities B+; Watch: health & safety C-, schools F, crime F.
- Lancaster Elementary (suburban): math 18% / reading 32% proficiency, ranked #1,161 of 1,400 in CA (top 83%) — low school quality limits family demand, transient renter base, plan for 1-2y turnover; 72% free/reduced lunch — lower-income household profile, screen leases tightly.
- Market conditions: Rents flat; 1169 active listings in the ZIP; 19 comparable units currently listed for rent nearby; rentals leasing fast (median 3d on market — plan ~1-2 weeks tenant-placement turnaround); 19,697 units permitted in Los Angeles County in 2024 (9,426 in 5+ unit buildings).
- At $2,992/mo this rent would consume 51% of the median local household income ($70k/yr) (locally 2494% of renters already pay >50% of income on rent) — very limited rent-growth headroom before tenants either downsize or default.
Forward outlook
- Local home prices are declining (-3.0%/yr); year-one equity from $1k of loan paydown is wiped out by about $6k of value loss. Plan a longer hold.
- Los Angeles County population projected at +9% by 2050 — modest demand growth; plan on rents tracking national, not racing it.
- At projected returns (-3.0% appreciation + 0.1% rent growth), your $55k cash investment doubles in ~6 years — after that, you're playing with house money.
Negotiation context
- It's been on market 230 days — a 12% lower offer ($172k) is reasonable based on typical stale-listing flexibility.
- 2 sale attempts; this cycle's ask has dropped $35k (15%) from the opening price — seller is motivated, your offer sets the floor, not the list.
Risks & watch-outs
- Climate carrying-cost: moderate wildfire risk; extreme-heat days projected 5→12/yr by 2055 (HVAC capex compounding) — expect insurance premiums to compound above CPI over the hold.
Questions for the listing agent
- It's been on market 230 days. Have you received any prior offers? Is the seller open to a 12% concession, seller financing, or rate buy-down credit?
- Built in 1979 — when were the roof, HVAC, electrical panel, plumbing, and water heater last replaced?
- Why hasn't it sold? Are there any deal-killer items the seller is aware of (foundation, flood, title, zoning, code violations)?
- Is there a deadline driving the sale (1031 exchange, divorce, estate, relocation)? That informs how much negotiation room exists.
- Schools are F-rated, which usually means shorter tenancies and higher turnover. Who's the typical renter profile here, and what's been the actual vacancy rate?
- Crime grade is F in this area — have there been break-ins, vandalism, or insurance claims at this property in the last 3 years? What carrier currently insures it and at what premium?
- What's the average days-on-market for RENTAL listings here right now (not sales)? A rising rental-DOM trend means longer vacancies and softer asking-rent achievability than the comps imply.
- What's the recent tenant-quality profile in this submarket — average credit score on applications, eviction rate, late-payment / NSF rate, and stable-employment percentage? A property-management company in the area should have these aggregated.
- How much new for-sale + rental construction is in the pipeline within 1–3 miles? Heavy new supply typically softens prices + rents 12–24 months out; constrained supply supports both.
Investment metrics
- 1% rule
- 1.53% ✓
- Cap rate
- 13.84%
- Cash-on-cash
- 26.96%
- DSCR
- 2.20
- GRM
- 5.4
CMA / ARV
- ARV (on-the-fly)
- $188,848
- Comps found
- 12
Show comp detail 12 sales within ~0.75 mi
| Address | Dist | Beds/Ba | Sqft | Sold | Price | $/sf | Match |
|---|---|---|---|---|---|---|---|
| 1301 E Avenue I #238 | 0.00mi | 5/2.0 (+1) | 1,600 (-2%) | 11mo | $185,000 | $116 | 83 |
| 1501 E Avenue I #138 | 0.24mi | 4/2.0 | 1,608 (-1%) | 11mo | $199,000 | $124 | 78 |
| 1301 E Avenue I Spc 246 | 0.00mi | 3/2.0 (-1) | 1,440 (-12%) | 1mo | $130,000 | $90 | 75 |
| 1501 E I Ave #125 | 0.24mi | 3/2.0 (-1) | 1,620 (-0%) | 11mo | $175,000 | $108 | 74 |
| 1301 E Avenue I #6 | 0.02mi | 4/2.0 | 1,440 (-12%) | 6mo | $190,000 | $132 | 74 |
| 1501 E Avenue I #135 | 0.24mi | 3/2.0 (-1) | 1,440 (-12%) | 7mo | $155,000 | $108 | 59 |
| 1501 E Avenue I #148 | 0.24mi | 3/3.0 (-1) | 1,848 (+14%) | 2mo | $198,400 | $107 | 56 |
| 1301 East Ave I #36 | 0.28mi | 4/2.0 | 1,440 (-12%) | 18mo | $185,000 | $128 | 53 |
| 45800 Challenger Way #304 | 0.65mi | 4/2.0 | 1,440 (-12%) | 5mo | $169,000 | $117 | 46 |
| 45800 Challenger Way #181 | 0.65mi | 3/2.0 (-1) | 1,440 (-12%) | 1mo | $159,000 | $110 | 44 |
| 45800 Challenger Way Spc 80 | 0.61mi | 3/2.0 (-1) | 1,512 (-7%) | 14mo | $165,000 | $109 | 43 |
| 45800 Challenger Way #206 | 0.61mi | 4/2.0 | 1,440 (-12%) | 15mo | $180,000 | $125 | 40 |
Match score weights: distance 35% · size 25% · config 20% · recency 20%. Top-matched comps best support the ARV.
Projected returns pro-forma
-3.0% appreciation · 0.14% rent growth · sell at horizon
- IRR
- 17.8%
- Equity multiple
- 1.70×
- Total profit
- $38,077
- Equity at exit
- $29,075
- IRR
- 24.3%
- Equity multiple
- 2.85×
- Total profit
- $100,981
- Equity at exit
- $16,860
Cash invested: $54,600 (down + closing). Projections, not guarantees.
Landlord ↔ Tenant lean methodology
- Overall (STATE)
- 18 Strongly Tenant-Friendly
- State California
- 18 Strongly Tenant-Friendly · D+13
- County
- — inherits STATE
- City
- — inherits STATE
ZIP-level market 93535
- Home prices YoY
- -24.3%
- Rents YoY
- 0.1%
- Active inventory
- 1169
- Price-to-rent
- 5.4×
Monthly cashflow live
- Estimated rent
- $2,992 high interval (Pro) →
- Mortgage (P&I)
- −$1,023
- Tax from tax record
- −$33 /mo · $397/yr
- Insurance
- −$81
- HOA
- −$0
- Vacancy / Maint / Mgmt
- −$628
- Net cashflow
- $1,227
Break-even live
UW: 25.0% down · 7.5% · 30yr · 1.5% tax · 5.0% vac · 8.0% maint · 8.0% mgmt
Financing live
Cash to close
- Down payment
- $48,750
- Closing costs
- $5,850
- Reserves months
- —
- Total cash needed
- —
Loan-product check · same deal, 3 products live
Conventional
25% down · 7.5% · 30yr
- Down + closing
- —
- Monthly P&I
- —
- Monthly cashflow
- —
- DSCR
- —
- Eligible?
- —
Personal DTI + credit; lowest rate.
DSCR
20% down · 8.5% · 30yr
- Down + closing
- —
- Monthly P&I
- —
- Monthly cashflow
- —
- DSCR
- —
- Eligible?
- —
No personal income docs; deal must DSCR.
Hard money
10% down · 12.0% · 12mo
- Down + closing
- —
- Monthly P&I
- —
- Monthly cashflow
- —
- DSCR
- —
- Eligible?
- —
Short-term bridge; refi at stabilization.
Rent comps 19 comps
| Address | Beds | Baths | Sqft | Rent | $/sqft | DOM | Units | Dist |
|---|---|---|---|---|---|---|---|---|
| 45041 Colleen Dr Lancaster, CA | 3.0 | 3.0 | 1303 | $3,100 | $2.38 | 1d | 1 | 0.50mi |
| 837 Sunrise Ct Lancaster, CA | 3.0 | 2.0 | 1259 | $3,000 | $2.38 | 21d | 1 | 0.67mi |
| 837 Sunrise Ct Lancaster, CA | 3.0 | 2.0 | 1259 | $2,895 | $2.30 | 3d | 1 | 0.67mi |
| 44732 12th St E Lancaster, CA | 3.0 | 2.0 | 1426 | $2,600 | $1.82 | 15d | 1 | 0.86mi |
| 45402 5th St E Lancaster, CA | 4.0 | 2.0 | 1237 | $2,775 | $2.24 | 1d | 1 | 0.86mi |
| 44908 Logue Ave Lancaster, CA | 3.0 | 2.0 | 1473 | $2,495 | $1.69 | 1d | 1 | 0.86mi |
| 1734 Lightcap St Lancaster, CA | 3.0 | 2.0 | 1467 | $2,700 | $1.84 | 1d | 1 | 0.87mi |
| 45428 Raysack Ave Lancaster, CA | 4.0 | 2.0 | 1244 | $2,900 | $2.33 | 1d | 1 | 0.90mi |
| 1004 E Newgrove St Lancaster, CA | 3.0 | 2.0 | 1160 | $2,800 | $2.41 | 1d | 1 | 0.97mi |
| 45465 25th St E Spc 10 Lancaster, CA | 3.0 | 2.0 | 1690 | $825 | $0.49 | 2d | 1 | 1.01mi |
| 44961 5th St E Lancaster, CA | 4.0 | 2.0 | 1248 | $2,500 | $2.00 | 1d | 1 | 1.05mi |
| 1253 Morven St Lancaster, CA | 4.0 | 2.0 | 1813 | $2,995 | $1.65 | 15d | 1 | 1.08mi |
| 45426 Stanridge Ave Lancaster, CA | 3.0 | 2.0 | 1443 | $2,975 | $2.06 | 15d | 1 | 1.15mi |
| 1647 Orchid Ln Lancaster, CA | 3.0 | 3.0 | 1084 | $1,950 | $1.80 | 21d | 1 | 1.16mi |
| 44946 3rd St E Lancaster, CA | 4.0 | 2.0 | 1256 | $2,395 | $1.91 | 15d | 1 | 1.26mi |
| 766 E Pillsbury St Lancaster, CA | 5.0 | 2.0 | 1604 | $2,500 | $1.56 | 10d | 1 | 1.28mi |
| 2634 Avoca St Lancaster, CA | 4.0 | 3.0 | 1722 | $3,200 | $1.86 | 1d | 1 | 1.39mi |
| 45027 Division St Lancaster, CA | 3.0 | 2.0 | 1221 | $2,600 | $2.13 | 1d | 1 | 1.48mi |
| 44707 Cerisa St Lancaster, CA | 4.0 | 2.0 | 1714 | $3,000 | $1.75 | 10d | 1 | 1.50mi |
Listing history 20 events
-
2026-06-18days on market $195,000 Active 230 DOM
-
2026-06-17days on market $195,000 Active 229 DOM
-
2026-06-16days on market $195,000 Active 228 DOM
-
2026-06-15days on market $195,000 Active 227 DOM
-
2026-06-13days on market $195,000 Active 225 DOM
-
2026-06-13days on market $195,000 Active 224 DOM
-
2026-06-09days on market $195,000 Active 221 DOM
-
2026-06-08days on market $195,000 Active 220 DOM
-
2026-06-07days on market $195,000 Active 219 DOM
-
2026-06-04days on market $195,000 Active 216 DOM
-
2026-06-03days on market $195,000 Active 215 DOM
-
2026-06-02days on market $195,000 Active 214 DOM
-
2026-06-01days on market $195,000 Active 213 DOM
-
2026-05-31days on market $195,000 Active 212 DOM
-
2026-05-08price $195,000
-
2026-05-05price $195,500 295-char remark
Show marketing remark (295 chars)
Experience the space and comfort of a triple-wide mobile home in a friendly, well-maintained community. Close the clubhouse, the park area. This property has 4 bedrooms, 2 baths, a living room area, a dining room area, a lot of cabinets in the kitchen, etc. Please don't wait too long to see it.
-
2025-12-18price $214,000 295-char remark
Show marketing remark (295 chars)
Experience the space and comfort of a triple-wide mobile home in a friendly, well-maintained community. Close the clubhouse, the park area. This property has 4 bedrooms, 2 baths, a living room area, a dining room area, a lot of cabinets in the kitchen, etc. Please don't wait too long to see it.
-
2025-12-18price $214,000
Show marketing remark (295 chars)
Experience the space and comfort of a triple-wide mobile home in a friendly, well-maintained community. Close the clubhouse, the park area. This property has 4 bedrooms, 2 baths, a living room area, a dining room area, a lot of cabinets in the kitchen, etc. Please don't wait too long to see it.
-
2025-10-31$230,000 Active
-
2025-10-30$230,000 Active 295-char remark
Show marketing remark (295 chars)
Experience the space and comfort of a triple-wide mobile home in a friendly, well-maintained community. Close the clubhouse, the park area. This property has 4 bedrooms, 2 baths, a living room area, a dining room area, a lot of cabinets in the kitchen, etc. Please don't wait too long to see it.
ⓘ Source: listings_history table (triggers on properties + properties_extension) + one-shot
backfill from property_details.listing_events for pre-trigger history.
Tax reassessment forecast CA · Resets to sale price
- Current annual tax
- $397 · $33/mo
- Projected year-2 tax
- $1,482 · $124/mo
- Expected delta
- +$1,085/yr (+$90/mo · 273.5%)
ⓘ Screening estimate from a state-policy table — verify with the county assessor before closing.
Climate risk First Street
- Flood 1/10 Low FEMA zone X (unshaded) · 0% chance over 30 yrs
- Wildfire 5/10 Major
- Heat 7/10 Severe 5 d/yr ≥101°F today · 12 d/yr by 30 yrs out
- Wind 1/10 Low
- Air quality 8/10 Severe 16 unhealthy d/yr today · 21 by 30 yrs out
Nearby sold comps map
Loading sold comps map…
Walkable amenities ~0.75 mi
Loading nearby amenities…
Taxation est. · year 1
- Rental income
- $35,903
- − Mortgage interest
- −$10,923
- − Property taxes
- −$397
- − Insurance
- −$975
- − Repairs & maintenance
- −$2,872
- − Management
- −$2,872
- − Depreciation
- −$5,673
- Taxable income
- $12,191
- Est. tax owed @ 24.0%
- −$2,926
- After-tax cash flow
- $11,795/yr
For passive investors: Depreciation is non-cash, so a rental often shows a tax loss while cash-flowing — sheltering income. Rental losses are passive: they offset passive income freely, and up to $25,000/yr can offset ordinary (W-2) income if you actively participate and your MAGI is under $100k (phasing out to $0 by $150k); unused losses carry forward. On sale, claimed depreciation is recaptured at up to 25%, and gains may owe capital-gains tax (a 1031 exchange can defer both). Figures are a year-1 estimate at your 24.0% rate — not tax advice; consult a CPA.
Schools (NCES district)
- District
- Lancaster Elementary
- NCES district ID
- 0620880
- Math proficiency
- 18% ▲ 1.00%
- Reading proficiency
- 32% ▬ 0.00%
- Median HH income
- $46,440
- Composite
- 24.73/100
- National rank
- #13028
- State rank
- #1161 of 1400 in CA
Livability — Lancaster
- Score
- 68/100
- State rank
- #282
- US rank
- #9504
Category grades
Schools grade is shown separately in the Schools card above.
Census & demographics
- Census place
- Lancaster, CA
- County
- Los Angeles County · 9,444,647 people
- City population
- 194,251
- Metro
- Los Angeles-Long Beach-Anaheim, CA
- Population (ZIP)
- 79,409
- Household income
- $70,360
- Rent vs Own
- Severe rent burden
- 2494.0
Population outlook (Los Angeles County) Hauer SSP2
- Today (2025)
- 10,940,515 people
- By 2030
- 11,256,481 · +2.9%
- By 2040
- 11,729,929 · +7.2%
- By 2050
- 11,948,407 · +9.2%
- By 2075
- 11,818,114 · +8.0%
- By 2100
- 10,842,928 · -0.9%
Race, ethnicity, and origin ACS 2023
- Neighborhood character
- Diverse neighborhood (Simpson 0.63)
- Race & ethnicity
- Hispanic / Latino 55% Two or more races 25% Black 21% White 17% Asian 2% Native American 1%
- Hispanic origin (detail)
- Mexican 42%
- Common ancestry
- Romanian 1% Italian 1% Lithuanian 1%
- Foreign-born
- 13% · Canada
- Languages at home
- 60% English-only · Spanish 37% Tagalog/Filipino 1% Other Indo-European 1%
Political lean MEDSL · Los Angeles
- 2024 margin
- Solid D (+32.9) · D 64.8% · R 31.9% · Other 3.3%
- 2008→2024 swing
- -7.4pp toward R · 2008: 40.4pp · 2024: 32.9pp
- All cycles
- 2024: D+32.9 2020: D+44.2 2016: D+48.0 2012: D+40.0 2008: D+40.4
Not yet ingested
- Civics
- —
Market trends
- HPI YoY
- ▼ -144.13%
- Current HPI
- 449.4494
- Rent YoY
- ▲ 0.14%
- Metro
- Los Angeles-Long Beach-Anaheim, CA
- State GDP YoY
- ▲ 3.21%
- F500 in state
- 116
Industry mix (Fortune 500 HQ in CA)
| Industry | F500 HQs | Revenue |
|---|---|---|
| Technology | 27 | $1,492B |
|
||
| Financial Services | 3 | $174B |
|
||
| Retail | 3 | $44B |
|
||
| Insurance | 3 | $26B |
|
||
| Media / Entertainment | 2 | $115B |
|
||
| Pharmaceuticals / Biotech | 2 | $62B |
|
||
Price history
-15.2% since first listed6 events — show timeline
- 2026-05-08 Price Changed $195,000 CRMLS
- 2026-05-05 Price Changed $195,500 AVMLS
- 2025-12-18 Price Changed $214,000 AVMLS
- 2025-12-18 Price Changed $214,000 CRMLS
- 2025-10-31 Listed $230,000 CRMLS
- 2025-10-30 Listed $230,000 AVMLS
Property tax history
+7.7%/yrLatest (2025): $397 · +7.7% YoY. Source: county tax records.
Cash-flow waterfall
monthlySold comps — $/sqft
last 12 mo · ≤1 miLoading sold comps…