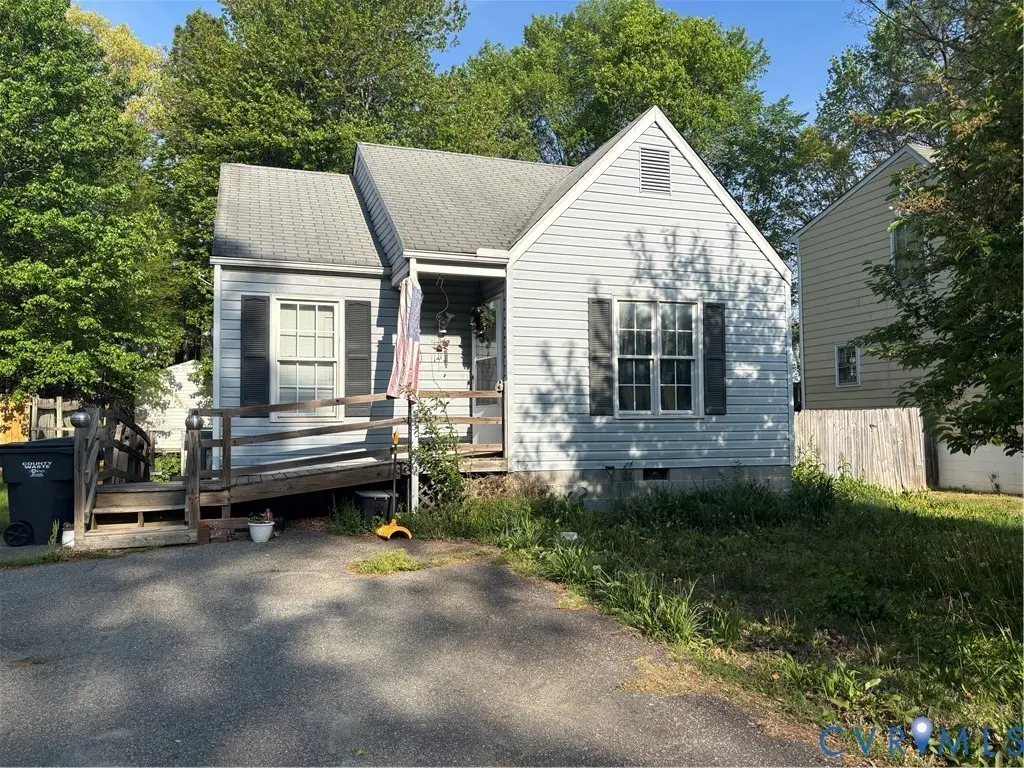
3104 Duck River Ct · Rockwood, VA
Flood risk 9/10 · Severe
- FEMA flood zone
- X (unshaded)
- Chance of flooding over 30 yrs
- 0.99%
- Est. flood insurance / yr
- $507 – $1,088
Fire risk 2/10 · Minimal
- Est. fire insurance / yr
- $666 – $1,236
Heat risk 7/10 · Major
- Hot days now (above 104°F)
- 7 days/yr
- Hot days in 30 yrs
- 16 days/yr
Wind risk 6/10 · Moderate
- Chance of severe wind over 30 yrs
- 27.0%
Air-quality risk 2/10 · Minimal
- Unhealthy air days now
- 0 days/yr
- Unhealthy air days in 30 yrs
- 1 days/yr
Risk factors via First Street. Map © Google.
Why this score? — see what drove the C+ grade
The composite is a weighted blend of 9 inputs, each scored 0–100. Each bar is that input's sub-score; the figure is the points it added to the 100-point composite (weight × sub-score).
- Cash flow +21.6/30.0
- ARV discount +13.5/15.0
- DSCR +6.9/10.0
- Schools +5.2/10.0
- 1% rule +5.0/10.0
- Livability +3.9/5.0
- Rent growth +3.1/5.0
- Condition / age +2.5/5.0
- Appreciation +0.0/10.0
$225,000
🖨 Deal sheet 📄 Offer letter ✓ Due diligence
Listing remarks
Attention Investors This property offers excellent potential but will need some care. Here is your chance to transform this property into something special, this charming 2-bedroom, 1 full bath home features a heat pump and offers great potential for the right buyer. The property is being sold strictly as-is. The seller will not make any repairs or address items identified during inspections. Buyer is responsible for obtaining and paying for the termite inspection. Washer, Dryer and Refrigerator Convey.
Key facts
- 7,187 sq ft lot
- Parking
- Built 1989
Property features AI
Finance
- HOA & community: Deck/porch community feature
Exterior
- Parking: Driveway parking; Oversized paved driveway; Shared driveway
- Utilities: Public water; Public sewer
- Home design: Single-story home; Resale property; Level lot; Located on a cul-de-sac
- Construction: Built with frame, drywall, vinyl siding and wood siding; Shingle/composition roof; Crawl space foundation; Year built: Actual
- Exterior features: Front porch; Porch; Deck; Outdoor lighting; Paved driveway; Fenced yard with chain link and mixed/partial fencing
Interior
- Kitchen: Dishwasher; Electric cooking; Icemaker
- Bedrooms: Second bedroom on the first floor; Main level primary bedroom
- Flooring: Partially carpeted; Vinyl
- Bathrooms: One full bathroom with tub and shower
- Heating & cooling: Heat pump for heating and cooling; Electric heating (heat pump)
- Interior features: Accessible approach with ramp; Accessibility features; Laminate counters; Main level primary bedroom; Steam shower
- Laundry & utility: Washer hookup; Dryer hookup
Neighborhood map
What this means for you Summary
Snapshot
- This is a 2-bed/1.0-bath single-family listed at $225k.
Deal economics
- At list price, monthly cash flow is $277 ($3k/yr) — positive.
- The deal already cash-flows at list — no discount required.
- To meet the 1% rule (rent ≥ 1% of price), the offer needs to be $224k (0.4% below list).
- Recommended offer: $222k (1.5% below list) — sets the bar for market timing.
- Cap rate 8.1% vs local median 4.2% in Rockwood — top-decile yield for the area; either an underpriced asset or a hidden risk that comps aren't pricing in. Stress-test before assuming the spread holds.
Location & tenants
- Location reads 77/100 on livability (#86 in VA, #2,803 nationally) — a middle-class / working-renter tenant base. Strengths: housing A+, health & safety A+, schools A; Watch: amenities F, commute F.
- Chesterfield County Public School District (suburban): math 52% / reading 64% proficiency, ranked #57 of 131 in VA (top 44%) — acceptable for families but not a draw, mixed tenant base, ~2y average lease.
- Market conditions: Rents rising (+2.3%/yr); 492 active listings in the ZIP; 2 comparable units currently listed for rent nearby; high-income renter base; 2,307 units permitted in Chesterfield County in 2024 (462 in 5+ unit buildings).
Forward outlook
- Local home prices are declining (-3.0%/yr); year-one equity from $2k of loan paydown is wiped out by about $7k of value loss. Plan a longer hold.
- Chesterfield County population projected at +20% by 2050 — long-run rental-demand tailwind backs the buy-and-hold thesis.
Negotiation context
- It's been on market 17 days — a 2% lower offer ($222k) is reasonable based on typical stale-listing flexibility.
- 2 sale attempts with the ask held roughly flat each time — persistent listings suggest the price (not the market) is what's stuck; bring a comps-based counter.
- Current owner paid $72k; list at $225k implies a 212% gain — meaningful room to come down on a strong offer.
Risks & watch-outs
- Watch-outs: flood insurance adds $66/mo.
- Climate carrying-cost: severe flood risk; major wind risk, 27% chance of damaging wind over 30y; extreme-heat days projected 7→16/yr by 2055 (HVAC capex compounding) — expect insurance premiums to compound above CPI over the hold.
Questions for the listing agent
- What's the actual annual flood-insurance premium (NFIP or private), and is the property in a SFHA with mandatory coverage?
- Is there a deadline driving the sale (1031 exchange, divorce, estate, relocation)? That informs how much negotiation room exists.
- Schools are A-rated — typically a magnet for longer-tenancy family renters. What's the average tenant stay here, and is there a school-zone premium baked into asking?
- What's the average days-on-market for RENTAL listings here right now (not sales)? A rising rental-DOM trend means longer vacancies and softer asking-rent achievability than the comps imply.
- What's the recent tenant-quality profile in this submarket — average credit score on applications, eviction rate, late-payment / NSF rate, and stable-employment percentage? A property-management company in the area should have these aggregated.
- How much new for-sale + rental construction is in the pipeline within 1–3 miles? Heavy new supply typically softens prices + rents 12–24 months out; constrained supply supports both.
Investment metrics
- 1% rule
- 1.00% ✗
- Cap rate
- 8.12%
- Cash-on-cash
- 6.53%
- DSCR
- 1.29
- GRM
- 8.4
CMA / ARV
- ARV (on-the-fly)
- $259,296
- Comps found
- 4
Show comp detail 4 sales within ~0.75 mi
| Address | Dist | Beds/Ba | Sqft | Sold | Price | $/sf | Match |
|---|---|---|---|---|---|---|---|
| 3013 Duck River Ct | 0.06mi | 3/2.0 (+1) | 960 (+8%) | 0mo | $275,000 | $286 | 74 |
| 3000 Duck River Ct | 0.11mi | 2/1.0 | 816 (-8%) | 23mo | $238,000 | $292 | 63 |
| 12310 Duck River Rd | 0.08mi | 3/2.0 (+1) | 1,020 (+15%) | 4mo | $267,500 | $262 | 59 |
| 3006 Shiloh Church Rd | 0.14mi | 3/2.0 (+1) | 1,008 (+14%) | 14mo | $300,000 | $298 | 50 |
Match score weights: distance 35% · size 25% · config 20% · recency 20%. Top-matched comps best support the ARV.
Projected returns pro-forma
-3.0% appreciation · 2.29% rent growth · sell at horizon
- IRR
- -8.9%
- Equity multiple
- 0.68×
- Total profit
- $-20,437
- Equity at exit
- $33,548
- IRR
- -0.4%
- Equity multiple
- 0.98×
- Total profit
- $-1,559
- Equity at exit
- $19,454
Cash invested: $63,000 (down + closing). Projections, not guarantees.
Landlord ↔ Tenant lean methodology
- Overall (STATE)
- 55 Moderately Landlord-Leaning
- State Virginia
- 55 Moderately Landlord-Leaning · D+2
- County
- — inherits STATE
- City
- — inherits STATE
ZIP-level market 23112
- Rents YoY
- 2.3%
- Active inventory
- 492
- Price-to-rent
- 8.4×
Monthly cashflow live
- Estimated rent
- $2,241 medium interval (Pro) →
- Mortgage (P&I)
- −$1,180
- Tax from tax record
- −$154 /mo · $1,849/yr
- Insurance
- −$94
- Flood insurance flood zone
- −$66 /mo · $798/yr
- HOA
- −$0
- Vacancy / Maint / Mgmt
- −$471
- Net cashflow
- $277
Break-even live
UW: 25.0% down · 7.5% · 30yr · 1.5% tax · 5.0% vac · 8.0% maint · 8.0% mgmt
Financing live
Cash to close
- Down payment
- $56,250
- Closing costs
- $6,750
- Reserves months
- —
- Total cash needed
- —
Loan-product check · same deal, 3 products live
Conventional
25% down · 7.5% · 30yr
- Down + closing
- —
- Monthly P&I
- —
- Monthly cashflow
- —
- DSCR
- —
- Eligible?
- —
Personal DTI + credit; lowest rate.
DSCR
20% down · 8.5% · 30yr
- Down + closing
- —
- Monthly P&I
- —
- Monthly cashflow
- —
- DSCR
- —
- Eligible?
- —
No personal income docs; deal must DSCR.
Hard money
10% down · 12.0% · 12mo
- Down + closing
- —
- Monthly P&I
- —
- Monthly cashflow
- —
- DSCR
- —
- Eligible?
- —
Short-term bridge; refi at stabilization.
Rent comps 2 comps
| Address | Beds | Baths | Sqft | Rent | $/sqft | DOM | Units | Dist |
|---|---|---|---|---|---|---|---|---|
| 2350 Scenic Lake Dr Midlothian, VA | 1.0–3.0 | 1.0–2.5 | 1255 | $2,610 | $2.08 | 1d | 37 | 0.30mi |
| 2801 Pavilion Pl Midlothian, VA | 1.0–3.0 | 1.0–2.0 | 924 | $2,043 | $2.21 | 1d | 25 | 1.41mi |
Listing history 9 events
-
2026-06-18days on market $225,000 Active 17 DOM
-
2026-06-17days on market $225,000 Active 16 DOM
-
2026-06-16pricedays on market $225,000 Active 15 DOM
-
2026-06-15days on market $233,000 Active 14 DOM
-
2026-06-13days on market $233,000 Active 12 DOM
-
2026-06-13remarks 508-char remark
-
2026-06-13days on market $233,000 Active 11 DOM
-
2026-06-10remarks 358-char remark
-
2026-06-10$233,000 Active 8 DOM
ⓘ Source: listings_history table (triggers on properties + properties_extension) + one-shot
backfill from property_details.listing_events for pre-trigger history.
Tax reassessment forecast VA · Resets to sale price
- Current annual tax
- $1,849 · $154/mo
- Projected year-2 tax
- $1,849 · $154/mo
- Expected delta
- $0/yr ($0/mo · 0.0%)
ⓘ Screening estimate from a state-policy table — verify with the county assessor before closing.
Climate risk First Street
- Flood 9/10 Extreme FEMA zone X (unshaded) · 99% chance over 30 yrs
- Wildfire 2/10 Low
- Heat 7/10 Severe 7 d/yr ≥104°F today · 16 d/yr by 30 yrs out
- Wind 6/10 Major 27% chance of damaging wind over 30 yrs
- Air quality 2/10 Low 0 unhealthy d/yr today · 1 by 30 yrs out
Nearby sold comps map
Loading sold comps map…
Walkable amenities ~0.75 mi
Loading nearby amenities…
Taxation est. · year 1
- Rental income
- $26,898
- − Mortgage interest
- −$12,603
- − Property taxes
- −$1,849
- − Insurance
- −$1,922
- − Repairs & maintenance
- −$2,152
- − Management
- −$2,152
- − Depreciation
- −$6,545
- Taxable loss
- −$326
- Est. tax savings @ 24.0%
- +$78
- After-tax cash flow
- $3,397/yr
For passive investors: Depreciation is non-cash, so a rental often shows a tax loss while cash-flowing — sheltering income. Rental losses are passive: they offset passive income freely, and up to $25,000/yr can offset ordinary (W-2) income if you actively participate and your MAGI is under $100k (phasing out to $0 by $150k); unused losses carry forward. On sale, claimed depreciation is recaptured at up to 25%, and gains may owe capital-gains tax (a 1031 exchange can defer both). Figures are a year-1 estimate at your 24.0% rate — not tax advice; consult a CPA.
Schools (NCES district)
- District
- Chesterfield County Public School District
- NCES district ID
- 5100840
- Math proficiency
- 52% ▼ -30.00%
- Reading proficiency
- 64% ▼ -15.00%
- Median HH income
- $72,821
- Composite
- 51.56/100
- National rank
- #1712
- State rank
- #57 of 131 in VA
Livability — Rockwood
- Score
- 77/100
- State rank
- #86
- US rank
- #2803
Category grades
Schools grade is shown separately in the Schools card above.
Census & demographics
- County
- Chesterfield County · 406,988 people
- Metro
- Richmond, VA
- Population (ZIP)
- 57,016
- Household income
- $116,465
- Rent vs Own
- Severe rent burden
- 897.0
Population outlook (Chesterfield County) Hauer SSP2
- Today (2025)
- 377,190 people
- By 2030
- 395,710 · +4.9%
- By 2040
- 427,694 · +13.4%
- By 2050
- 452,706 · +20.0%
- By 2075
- 505,533 · +34.0%
- By 2100
- 521,282 · +38.2%
Race, ethnicity, and origin ACS 2023
- Neighborhood character
- Predominantly White (70%)
- Race & ethnicity
- White 70% Black 14% Two or more races 7% Hispanic / Latino 6% Asian 4%
- Hispanic origin (detail)
- Mexican 1% Puerto Rican 2%
- Common ancestry
- Lithuanian 4% Italian 4% Romanian 2%
- Foreign-born
- 7% · Canada, China, Jamaica
- Languages at home
- 91% English-only · Spanish 4% Other Indo-European 1% Arabic 1%
Political lean MEDSL · Chesterfield
- 2024 margin
- Lean D (+9.0) · D 53.8% · R 44.8% · Other 1.4%
- 2008→2024 swing
- +16.4pp toward D · 2008: -7.5pp · 2024: 9.0pp
- All cycles
- 2024: D+9.0 2020: D+6.7 2016: R+2.2 2012: R+7.1 2008: R+7.5
Not yet ingested
- Civics
- —
Market trends
- HPI YoY
- ▼ -224.87%
- Current HPI
- 277.4841
- Rent YoY
- ▲ 2.29%
- Metro
- Richmond, VA
- State GDP YoY
- ▲ 2.40%
- F500 in state
- 50
Industry mix (Fortune 500 HQ in VA)
| Industry | F500 HQs | Revenue |
|---|---|---|
| Aerospace / Defense | 4 | $236B |
|
||
| Technology / Defense | 3 | $32B |
|
||
| Financial Services | 2 | $176B |
|
||
| Utilities | 2 | $27B |
|
||
| Insurance | 2 | $25B |
|
||
| Technology | 2 | $15B |
|
||
Price history
+323.6% since first listed6 events — show timeline
- 2026-06-09 Relisted — CVRMLS
- 2026-04-26 Pending — CVRMLS
- 2026-04-17 Listed $233,000 CVRMLS
- 2001-12-21 Sold (Public Records) $72,000 Public Records
- 1996-08-30 Sold (Public Records) $58,000 Public Records
- 1994-06-17 Sold (Public Records) $55,000 Public Records
Property tax history
+5.9%/yrLatest (2025): $1,849 · +7.4% YoY. Source: county tax records.
Cash-flow waterfall
monthlySold comps — $/sqft
last 12 mo · ≤1 miLoading sold comps…