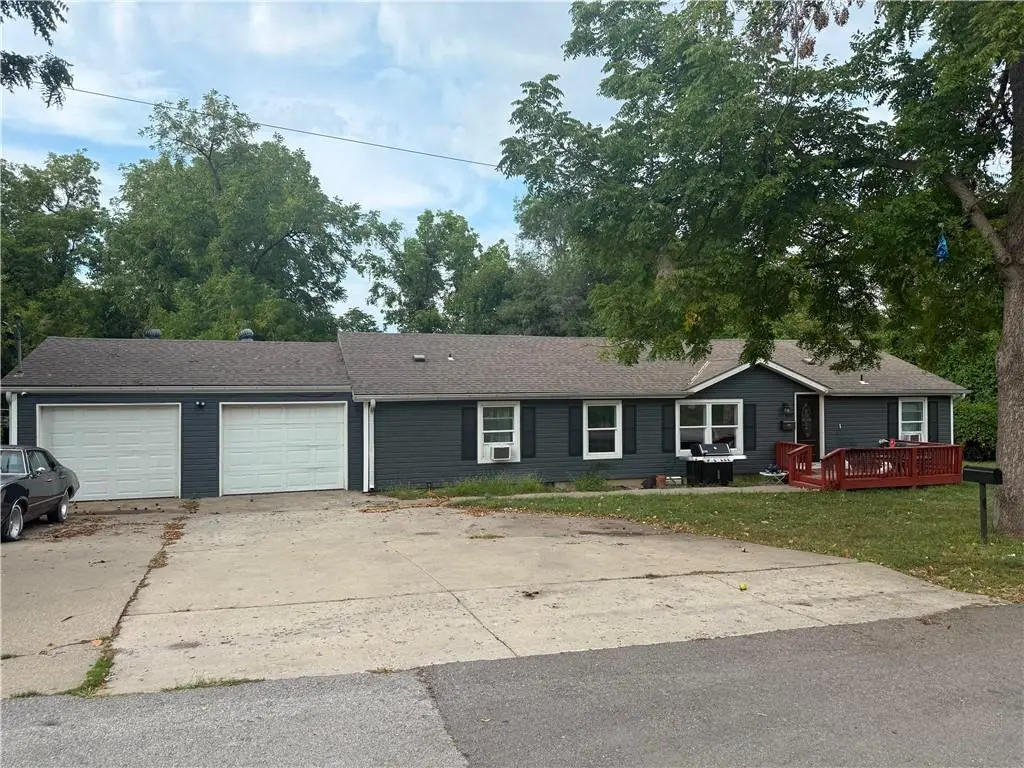
850 Woodend St · Kansas City, KS
Flood risk 1/10 · Minimal
- FEMA flood zone
- X (unshaded)
- Chance of flooding over 30 yrs
- 0.0%
- Est. flood insurance / yr
- $473 – $860
Fire risk 1/10 · Minimal
- Est. fire insurance / yr
- $1,154 – $2,142
Heat risk 4/10 · Minor
- Hot days now (above 106°F)
- 7 days/yr
- Hot days in 30 yrs
- 16 days/yr
Wind risk 2/10 · Minimal
- Chance of severe wind over 30 yrs
- —
Air-quality risk 3/10 · Minor
- Unhealthy air days now
- 2 days/yr
- Unhealthy air days in 30 yrs
- 3 days/yr
Risk factors via First Street. Map © Google.
Why this score? — see what drove the C+ grade
The composite is a weighted blend of 9 inputs, each scored 0–100. Each bar is that input's sub-score; the figure is the points it added to the 100-point composite (weight × sub-score).
- Cash flow +20.9/30.0
- ARV discount +15.0/15.0
- 1% rule +6.8/10.0
- DSCR +6.6/10.0
- Rent growth +3.9/5.0
- Livability +3.6/5.0
- Condition / age +2.5/5.0
- Schools +0.9/10.0
- Appreciation +0.0/10.0
$199,500
🖨 Deal sheet (PDF) 📄 Offer letter ✓ Due diligence
Listing remarks MLS
Manufactured ranch home offers living rm, formal dining rm, kitchen with breakfast area, den/office, plus three bedrooms and two baths. Needs some work to interior.
Key facts
- 8,276 sq ft lot
- 2 garage spots
- Built 2001
Property features AI
Finance
- Other: Living area reported as 1,904 (public records)
- HOA & community: No association fees
Exterior
- Parking: Attached 2-car garage
- Utilities: Public water; Septic sewer
- Home design: Single-family residence; Residential property; One-story
- Construction: Frame construction; Composition roof; Built within last 21–30 years
- Exterior features: Lot approximately 8,276 sq ft; Location accessible from Merriam Lane/Woodend area
Interior
- Bedrooms: 4 bedrooms
- Bathrooms: 2 full bathrooms
- Heating & cooling: Electric heating; Electric cooling (central)
- Interior features: Ranch floor plan; Crawl space basement
Neighborhood map
What this means for you Summary
Snapshot
- This is a 3-bed/1.5-bath single-family listed at $200k.
Deal economics
- At list price, monthly cash flow is $276 ($3k/yr) — positive.
- The deal already cash-flows at list — no discount required.
- Meets the 1% rule at list price ($2k rent vs $200k).
- Cap rate 8.0% vs local median 4.8% in Kansas City — top-decile yield for the area; either an underpriced asset or a hidden risk that comps aren't pricing in. Stress-test before assuming the spread holds.
Location & tenants
- Location reads 72/100 on livability (#103 in KS) — a middle-class / working-renter tenant base. Strengths: commute A+, cost of living A+, housing A+; Watch: crime F, employment D-.
- Kansas City (urban): math 8% / reading 15% proficiency, ranked #169 of 169 in KS (top 100%) — low school quality limits family demand, transient renter base, plan for 1-2y turnover; 81% free/reduced lunch — lower-income household profile, screen leases tightly.
- Zoned schools: Thomas A Edison Elem (math 22% / reading 22%, grade F, #569 of 684 statewide, top 85%, 225 students, 88% FRL); Rosedale Middle (math 5% / reading 10%, grade F, #207 of 219 statewide, top 95%, 798 students, 56% FRL); J C Harmon High (math 0% / reading 4%, grade F, #326 of 327 statewide, top 100%, 1,330 students, 79% FRL).
- Market conditions: Rents rising fast (+5.8%/yr); 58 active listings in the ZIP; 8 comparable units currently listed for rent nearby; rentals leasing fast (median 12d on market — plan ~1-2 weeks tenant-placement turnaround); 369 units permitted in Wyandotte County in 2024 (236 in 5+ unit buildings).
- At $2,355/mo this rent would consume 54% of the median local household income ($52k/yr) (locally 805% of renters already pay >50% of income on rent) — very limited rent-growth headroom before tenants either downsize or default.
Forward outlook
- Local home prices are declining (-3.0%/yr); year-one equity from $1k of loan paydown is wiped out by about $6k of value loss. Plan a longer hold.
- Wyandotte County population projected at +17% by 2050 — long-run rental-demand tailwind backs the buy-and-hold thesis.
- At projected returns (-3.0% appreciation + 5.8% rent growth), your $56k cash investment doubles in ~10 years — after that, you're playing with house money.
Negotiation context
- Only 6 days on market — expect competitive offers; lowballing is unlikely to land.
- 2 sale attempts since 19y ago with the ask held roughly flat each time — persistent listings suggest the price (not the market) is what's stuck; bring a comps-based counter.
Risks & watch-outs
- Watch-outs: property tax is 2.7% of price.
Questions for the listing agent
- Property tax is high relative to price — has the assessment been appealed recently, and will the sale trigger a re-assessment?
- Is there a deadline driving the sale (1031 exchange, divorce, estate, relocation)? That informs how much negotiation room exists.
- Schools are F-rated, which usually means shorter tenancies and higher turnover. Who's the typical renter profile here, and what's been the actual vacancy rate?
- Crime grade is F in this area — have there been break-ins, vandalism, or insurance claims at this property in the last 3 years? What carrier currently insures it and at what premium?
- What's the average days-on-market for RENTAL listings here right now (not sales)? A rising rental-DOM trend means longer vacancies and softer asking-rent achievability than the comps imply.
- What's the recent tenant-quality profile in this submarket — average credit score on applications, eviction rate, late-payment / NSF rate, and stable-employment percentage? A property-management company in the area should have these aggregated.
- How much new for-sale + rental construction is in the pipeline within 1–3 miles? Heavy new supply typically softens prices + rents 12–24 months out; constrained supply supports both.
Investment metrics
- 1% rule
- 1.18% ✓
- Cap rate
- 7.95%
- Cash-on-cash
- 5.93%
- DSCR
- 1.26
- GRM
- 7.1
CMA / ARV
- ARV (on-the-fly)
- $333,720
- Comps found
- 11
Show comp detail 11 sales within ~0.75 mi
| Address | Dist | Beds/Ba | Sqft | Sold | Price | $/sf | Match |
|---|---|---|---|---|---|---|---|
| 3901 W 47th St | 0.54mi | 3/2.0 | 1,752 (+8%) | 4mo | $325,000 | $186 | 56 |
| 4733 Fontana St | 0.68mi | 3/2.0 | 1,506 (-7%) | 1mo | $370,000 | $246 | 54 |
| 4016 W 47th Ter | 0.56mi | 3/2.0 | 1,428 (-12%) | 1mo | $385,000 | $270 | 51 |
| 4101 Elledge Dr | 0.67mi | 3/1.5 | 1,580 (-2%) | 21mo | $324,000 | $205 | 47 |
| 4721 El Monte St | 0.65mi | 4/2.5 (+1) | 1,764 (+9%) | 0mo | $400,000 | $227 | 46 |
| 4724 Delmar St | 0.62mi | 2/2.5 (-1) | 1,504 (-7%) | 6mo | $249,000 | $166 | 45 |
| 3912 Elledge Dr | 0.56mi | 3/1.0 | 1,412 (-13%) | 10mo | $289,000 | $205 | 42 |
| 4018 W 47th Ter | 0.56mi | 2/2.0 (-1) | 1,572 (-3%) | 24mo | $340,000 | $216 | 42 |
| 4716 Fontana St | 0.67mi | 3/2.5 | 1,846 (+14%) | 4mo | $365,000 | $198 | 38 |
| 3527 W 47th Ter | 0.71mi | 3/1.5 | 1,438 (-11%) | 23mo | $338,000 | $235 | 29 |
| 4731 Windsor St | 0.72mi | 4/3.0 (+1) | 1,836 (+13%) | 13mo | $379,000 | $206 | 22 |
Match score weights: distance 35% · size 25% · config 20% · recency 20%. Top-matched comps best support the ARV.
Projected returns pro-forma
-3.0% appreciation · 5.78% rent growth · sell at horizon
- IRR
- -3.6%
- Equity multiple
- 0.86×
- Total profit
- $-7,812
- Equity at exit
- $29,746
- IRR
- 9.3%
- Equity multiple
- 1.82×
- Total profit
- $45,910
- Equity at exit
- $17,249
Cash invested: $55,860 (down + closing). Projections, not guarantees.
Landlord ↔ Tenant lean methodology
- Overall (STATE)
- 83 Strongly Landlord-Friendly
- State Kansas
- 83 Strongly Landlord-Friendly · R+10
- County
- — inherits STATE
- City
- — inherits STATE
ZIP-level market 66103
- Home prices YoY
- -20.2%
- Rents YoY
- 5.8%
- Active inventory
- 58
- Price-to-rent
- 7.1×
Monthly cashflow live
- Estimated rent
- $2,355 high interval (Pro) →
- Mortgage (P&I)
- −$1,046
- Tax from tax record
- −$455 /mo · $5,460/yr
- Insurance
- −$83
- HOA
- −$0
- Vacancy / Maint / Mgmt
- −$495
- Net cashflow
- $276
Break-even live
Sensitivity live
| Price | -10% $389 | -5% $333 | +0% $276 | +5% $220 | +10% $163 |
|---|---|---|---|---|---|
| Rent | -10% $90 | -5% $183 | +0% $276 | +5% $369 | +10% $462 |
| Rate | -1.0pp $377 | -0.5pp $327 | base $276 | +0.5pp $224 | +1.0pp $172 |
UW: 25.0% down · 7.5% · 30yr · 1.5% tax · 5.0% vac · 8.0% maint · 8.0% mgmt
Financing live
Cash to close
- Down payment
- $49,875
- Closing costs
- $5,985
- Reserves months
- —
- Total cash needed
- —
Loan-product check · same deal, 3 products live
Conventional
25% down · 7.5% · 30yr
- Down + closing
- —
- Monthly P&I
- —
- Monthly cashflow
- —
- DSCR
- —
- Eligible?
- —
Personal DTI + credit; lowest rate.
DSCR
20% down · 8.5% · 30yr
- Down + closing
- —
- Monthly P&I
- —
- Monthly cashflow
- —
- DSCR
- —
- Eligible?
- —
No personal income docs; deal must DSCR.
Hard money
10% down · 12.0% · 12mo
- Down + closing
- —
- Monthly P&I
- —
- Monthly cashflow
- —
- DSCR
- —
- Eligible?
- —
Short-term bridge; refi at stabilization.
Rent comps 8 comps
| Address | Beds | Baths | Sqft | Rent | $/sqft | DOM | Units | Dist |
|---|---|---|---|---|---|---|---|---|
| 4904 Fontana St Roeland Park, KS | 3.0 | 2.0 | 1834 | $2,700 | $1.47 | 16d | 1 | 0.92mi |
| 3600 Rainbow Blvd Kansas City, KS | 2.0 | 1.0–2.0 | 811 | $3,310 | $4.08 | 12d | 38 | 1.13mi |
| 2200 W 47th Pl Mission, KS | 3.0 | 1.0–2.0 | 1053 | $5,637 | $5.35 | 4d | 3 | 1.25mi |
| 3939 State Line Rd Kansas City, MO | 2.0 | 1.0–2.0 | 939 | $2,740 | $2.92 | 5d | 53 | 1.37mi |
| 4336 Bell St Kansas City, MO | 2.0 | 3.0 | 1820 | $2,575 | $1.41 | 21d | 1 | 1.38mi |
| 2900 W 53rd St Fairway, KS | 2.0 | 2.0 | 1250 | $2,590 | $2.07 | 4d | 1 | 1.42mi |
| 5329 Linden St Roeland Park, KS | 3.0 | 1.5 | 1112 | $2,050 | $1.84 | 3d | 1 | 1.47mi |
| 5300 Rosewood St Mission, KS | 3.0 | 1.5 | 1420 | $2,800 | $1.97 | 25d | 1 | 1.49mi |
Listing history 9 events
-
2026-06-05days on market $199,500 Active 6 DOM
-
2026-06-03days on market $199,500 Active 5 DOM
-
2026-06-02days on market $199,500 Active 4 DOM
-
2026-06-01days on market $199,500 Active 3 DOM
-
2026-05-31days on market $199,500 Active 2 DOM
-
2026-05-29$199,500 Active
-
2008-01-18soldstatus 164-char remark
Show marketing remark (164 chars)
Manufactured ranch home offers living rm, formal dining rm, kitchen with breakfast area, den/office, plus three bedrooms and two baths. Needs some work to interior.
-
2007-06-27$52,900 164-char remark
Show marketing remark (164 chars)
Manufactured ranch home offers living rm, formal dining rm, kitchen with breakfast area, den/office, plus three bedrooms and two baths. Needs some work to interior.
-
2000-03-21soldstatus
ⓘ Source: listings_history table (triggers on properties + properties_extension) + one-shot
backfill from property_details.listing_events for pre-trigger history.
Tax reassessment forecast KS · Resets to sale price
- Current annual tax
- $5,460 · $455/mo
- Projected year-2 tax
- $5,460 · $455/mo
- Expected delta
- $0/yr ($0/mo · 0.0%)
ⓘ Screening estimate from a state-policy table — verify with the county assessor before closing.
Climate risk First Street
- Flood 1/10 Low FEMA zone X (unshaded) · 0% chance over 30 yrs
- Wildfire 1/10 Low
- Heat 4/10 Moderate 7 d/yr ≥106°F today · 16 d/yr by 30 yrs out
- Wind 2/10 Low
- Air quality 3/10 Moderate 2 unhealthy d/yr today · 3 by 30 yrs out
Nearby sold comps map
Loading sold comps map…
Walkable amenities ~0.75 mi
Loading nearby amenities…
Taxation est. · year 1
- Rental income
- $28,260
- − Mortgage interest
- −$11,175
- − Property taxes
- −$5,460
- − Insurance
- −$998
- − Repairs & maintenance
- −$2,261
- − Management
- −$2,261
- − Depreciation
- −$5,804
- Taxable income
- $302
- Est. tax owed @ 24.0%
- −$72
- After-tax cash flow
- $3,241/yr
For passive investors: Depreciation is non-cash, so a rental often shows a tax loss while cash-flowing — sheltering income. Rental losses are passive: they offset passive income freely, and up to $25,000/yr can offset ordinary (W-2) income if you actively participate and your MAGI is under $100k (phasing out to $0 by $150k); unused losses carry forward. On sale, claimed depreciation is recaptured at up to 25%, and gains may owe capital-gains tax (a 1031 exchange can defer both). Figures are a year-1 estimate at your 24.0% rate — not tax advice; consult a CPA.
Schools (NCES district)
- District
- Kansas City
- NCES district ID
- 2007950
- Math proficiency
- 8% ▼ -10.00%
- Reading proficiency
- 15% ▼ -4.00%
- Median HH income
- $34,774
- Composite
- 9.38/100
- National rank
- #9856
- State rank
- #169 of 169 in KS
Livability — Kansas City
- Score
- 72/100
- State rank
- #103
- US rank
- #6054
Category grades
Schools grade is shown separately in the Schools card above.
Census & demographics
- Census place
- Kansas City, KS
- County
- Wyandotte County · 130,206 people
- City population
- 130,206
- Metro
- Kansas City, MO-KS
- Population (ZIP)
- 12,730
- Household income
- $52,479
- Rent vs Own
- Severe rent burden
- 805.0
Population outlook (Wyandotte County) Hauer SSP2
- Today (2025)
- 177,063 people
- By 2030
- 183,212 · +3.5%
- By 2040
- 195,697 · +10.5%
- By 2050
- 207,897 · +17.4%
- By 2075
- 236,169 · +33.4%
- By 2100
- 255,790 · +44.5%
Race, ethnicity, and origin ACS 2023
- Neighborhood character
- Diverse neighborhood (Simpson 0.69)
- Race & ethnicity
- White 45% Hispanic / Latino 31% Two or more races 12% Black 12% Asian 6% Native American 3%
- Hispanic origin (detail)
- Mexican 26% Puerto Rican 1%
- Common ancestry
- Lithuanian 2% Italian 1% Iranian 1%
- Foreign-born
- 16% · Canada, China, South Korea
- Languages at home
- 74% English-only · Spanish 20% Other Indo-European 1% Other Asian/Pacific 1%
Political lean MEDSL · Wyandotte
- 2024 margin
- Strong D (+23.9) · D 61.1% · R 37.3% · Other 1.6%
- 2008→2024 swing
- -17.0pp toward R · 2008: 40.9pp · 2024: 23.9pp
- All cycles
- 2024: D+23.9 2020: D+30.9 2016: D+29.1 2012: D+36.4 2008: D+40.9
Not yet ingested
- Civics
- —
Market trends
- HPI YoY
- ▼ -93.15%
- Current HPI
- 368.8332
- Rent YoY
- ▲ 5.78%
- Metro
- Kansas City, MO-KS
- State GDP YoY
- —
- F500 in state
- 0
Price history
+277.1% since first listed4 events — show timeline
- 2026-05-29 Listed $199,500 Heartland MLS as Distributed by MLS Grid
- 2008-01-18 Sold (MLS) — Heartland MLS as Distributed by MLS Grid
- 2007-06-27 Listed $52,900 Heartland MLS as Distributed by MLS Grid
- 2000-03-21 Sold (Public Records) — Public Records
Property tax history
+10.4%/yrLatest (2025): $5,460 · +8.2% YoY. Source: county tax records.
Cash-flow waterfall
monthlySold comps — $/sqft
last 12 mo · ≤1 miLoading sold comps…