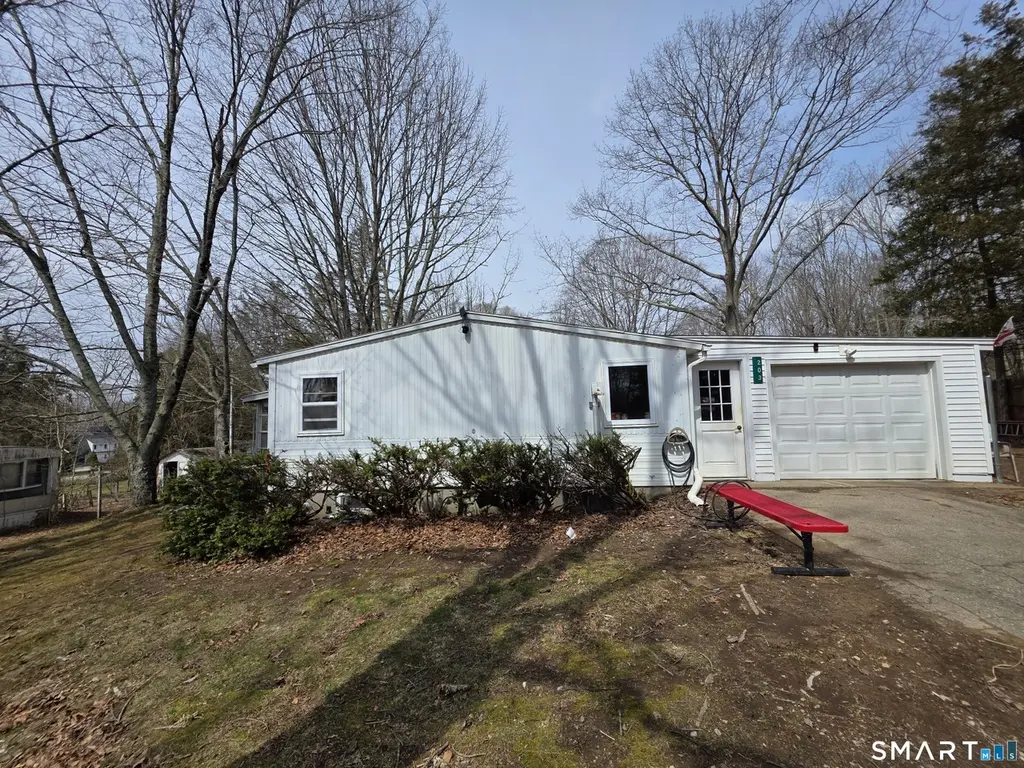
1564 Glasgo Rd Lot 203 · Griswold, CT
Flood risk 1/10 · Minimal
- FEMA flood zone
- X (unshaded)
- Chance of flooding over 30 yrs
- 0.0%
- Est. flood insurance / yr
- $507 – $1,088
Fire risk 3/10 · Minor
- Est. fire insurance / yr
- $829 – $1,539
Heat risk 4/10 · Minor
- Hot days now (above 97°F)
- 7 days/yr
- Hot days in 30 yrs
- 16 days/yr
Wind risk 6/10 · Moderate
- Chance of severe wind over 30 yrs
- 66.0%
Air-quality risk 3/10 · Minor
- Unhealthy air days now
- 2 days/yr
- Unhealthy air days in 30 yrs
- 3 days/yr
Risk factors via First Street. Map © Google.
Why this score? — see what drove the C+ grade
The composite is a weighted blend of 9 inputs, each scored 0–100. Each bar is that input's sub-score; the figure is the points it added to the 100-point composite (weight × sub-score).
- Cash flow +22.7/30.0
- ARV discount +15.0/15.0
- 1% rule +9.3/10.0
- DSCR +7.3/10.0
- Schools +3.2/10.0
- Rent growth +2.5/5.0
- Livability +2.5/5.0
- Condition / age +2.5/5.0
- Appreciation +0.0/10.0
$134,000
🖨 Deal sheet 📄 Offer letter ✓ Due diligence
Listing remarks MLS
Mobile home with 3 bedrooms and 2 full baths, open floor plan, with pellet stove to help with heating costs, granite counter tops, vaulted ceilings in Livingroom, appliances with home, laundry room is on the first floor, lower level has a full basement with walk out, one room finished off for extra space, enclosed 3 season room, generator hook up, mini split in lower level for heat and ac, and updated electrical. One car attached garage, fenced in yard. On a corner lot, close to RI and Foxwoods Casino, Mohegan Casino, State forest for enjoying nature.
Key facts
- 2,178 sq ft lot
- Garage
- Built 1965
Neighborhood map
What this means for you Summary
Snapshot
- This is a 3-bed/1.0-bath manufactured listed at $134k.
Deal economics
- At list price, monthly cash flow is $230 ($3k/yr) — positive.
- The deal already cash-flows at list — no discount required.
- Meets the 1% rule at list price ($2k rent vs $134k).
- Recommended offer: $126k (6.0% below list) — sets the bar for market timing.
Location & tenants
- Location reads: area grade C — affects rentability + tenant quality, not the cash-flow math above.
- Griswold School District (rural): math 29% / reading 42% proficiency, ranked #111 of 153 in CT (top 72%) — families likely to look elsewhere, expect single-tenant / working-renter base with shorter leases.
- Market conditions: 75 active listings in the ZIP; 487 units permitted in Southeastern Connecticut Planning Region in 2024 (244 in 5+ unit buildings).
Forward outlook
- Local home prices are declining (-3.0%/yr); year-one equity from $926 of loan paydown is wiped out by about $4k of value loss. Plan a longer hold.
Negotiation context
- It's been on market 82 days — a 6% lower offer ($126k) is reasonable based on typical stale-listing flexibility.
- 5 sale attempts since 8y ago with the ask held roughly flat each time — persistent listings suggest the price (not the market) is what's stuck; bring a comps-based counter.
- Current owner paid $58k; list at $134k implies a 131% gain — meaningful room to come down on a strong offer.
Risks & watch-outs
- Watch-outs: HOA is 26% of rent.
- Climate carrying-cost: major wind risk, 66% chance of damaging wind over 30y — expect insurance premiums to compound above CPI over the hold.
Questions for the listing agent
- It's been on market 82 days. Have you received any prior offers? Is the seller open to a 6% concession, seller financing, or rate buy-down credit?
- Built in 1965 — when were the roof, HVAC, electrical panel, plumbing, and water heater last replaced?
- What does the HOA fee cover, when was the last increase, and are there any pending special assessments or reserve-fund shortfalls?
- Why hasn't it sold? Are there any deal-killer items the seller is aware of (foundation, flood, title, zoning, code violations)?
- Is there a deadline driving the sale (1031 exchange, divorce, estate, relocation)? That informs how much negotiation room exists.
- What's the average days-on-market for RENTAL listings here right now (not sales)? A rising rental-DOM trend means longer vacancies and softer asking-rent achievability than the comps imply.
- What's the recent tenant-quality profile in this submarket — average credit score on applications, eviction rate, late-payment / NSF rate, and stable-employment percentage? A property-management company in the area should have these aggregated.
- How much new for-sale + rental construction is in the pipeline within 1–3 miles? Heavy new supply typically softens prices + rents 12–24 months out; constrained supply supports both.
Investment metrics
- 1% rule
- 1.43% ✓
- Cap rate
- 8.35%
- Cash-on-cash
- 7.35%
- DSCR
- 1.33
- GRM
- 5.8
CMA / ARV
- ARV (median comp)
- $237,588
- List price
- $134,000
- Delta
- -43.60%
- Verdict
- UNDERPRICED
- Comps
- 8 within 1.0 mi
Projected returns pro-forma
-3.0% appreciation · 3.0% rent growth · sell at horizon
- IRR
- -4.9%
- Equity multiple
- 0.82×
- Total profit
- $-6,831
- Equity at exit
- $19,980
- IRR
- 5.0%
- Equity multiple
- 1.37×
- Total profit
- $13,903
- Equity at exit
- $11,586
Cash invested: $37,520 (down + closing). Projections, not guarantees.
Landlord ↔ Tenant lean methodology
- Overall (STATE)
- 27 Tenant-Leaning
- State Connecticut
- 27 Tenant-Leaning · D+7
- County
- — inherits STATE
- City
- — inherits STATE
ZIP-level market 06351
- Home prices YoY
- -22.8%
- Active inventory
- 75
- Price-to-rent
- 5.8×
Monthly cashflow live
- Estimated rent
- $1,913 medium interval (Pro) →
- Mortgage (P&I)
- −$703
- Tax from tax record
- −$23 /mo · $274/yr
- Insurance
- −$56
- HOA
- −$500
- Vacancy / Maint / Mgmt
- −$402
- Net cashflow
- $230
Break-even live
UW: 25.0% down · 7.5% · 30yr · 1.5% tax · 5.0% vac · 8.0% maint · 8.0% mgmt
Financing live
Cash to close
- Down payment
- $33,500
- Closing costs
- $4,020
- Reserves months
- —
- Total cash needed
- —
Loan-product check · same deal, 3 products live
Conventional
25% down · 7.5% · 30yr
- Down + closing
- —
- Monthly P&I
- —
- Monthly cashflow
- —
- DSCR
- —
- Eligible?
- —
Personal DTI + credit; lowest rate.
DSCR
20% down · 8.5% · 30yr
- Down + closing
- —
- Monthly P&I
- —
- Monthly cashflow
- —
- DSCR
- —
- Eligible?
- —
No personal income docs; deal must DSCR.
Hard money
10% down · 12.0% · 12mo
- Down + closing
- —
- Monthly P&I
- —
- Monthly cashflow
- —
- DSCR
- —
- Eligible?
- —
Short-term bridge; refi at stabilization.
HOA detail
- Monthly dues
- $500 · $6,000/yr
- Likely covers
- electric
Listing history 29 events
-
2026-06-18days on market $134,000 Active 82 DOM
-
2026-06-17days on market $134,000 Active 81 DOM
-
2026-06-16days on market $134,000 Active 80 DOM
-
2026-06-15days on market $134,000 Active 79 DOM
-
2026-06-13days on market $134,000 Active 77 DOM
-
2026-06-12days on market $134,000 Active 76 DOM
-
2026-06-09days on market $134,000 Active 73 DOM
-
2026-06-08days on market $134,000 Active 72 DOM
-
2026-06-07days on market $134,000 Active 71 DOM
-
2026-06-07days on market $134,000 Active 70 DOM
-
2026-06-04days on market $134,000 Active 67 DOM
-
2026-06-02days on market $134,000 Active 66 DOM
-
2026-06-01days on market $134,000 Active 65 DOM
-
2026-05-31days on market $134,000 Active 64 DOM
-
2026-05-31days on market $134,000 Active 63 DOM
-
2026-03-29$134,000 Active 557-char remark
Show marketing remark (557 chars)
Mobile home with 3 bedrooms and 2 full baths, open floor plan, with pellet stove to help with heating costs, granite counter tops, vaulted ceilings in Livingroom, appliances with home, laundry room is on the first floor, lower level has a full basement with walk out, one room finished off for extra space, enclosed 3 season room, generator hook up, mini split in lower level for heat and ac, and updated electrical. One car attached garage, fenced in yard. On a corner lot, close to RI and Foxwoods Casino, Mohegan Casino, State forest for enjoying nature.
-
2026-03-26historical $134,000 557-char remark
Show marketing remark (557 chars)
Mobile home with 3 bedrooms and 2 full baths, open floor plan, with pellet stove to help with heating costs, granite counter tops, vaulted ceilings in Livingroom, appliances with home, laundry room is on the first floor, lower level has a full basement with walk out, one room finished off for extra space, enclosed 3 season room, generator hook up, mini split in lower level for heat and ac, and updated electrical. One car attached garage, fenced in yard. On a corner lot, close to RI and Foxwoods Casino, Mohegan Casino, State forest for enjoying nature.
-
2025-11-30historical
-
2025-11-04price $134,900
-
2025-10-25status Active
-
2025-09-29status Under Contract
-
2025-09-19$144,900 Active
-
2022-04-04soldstatus $58,000 Closed
-
2021-12-14price $84,900
-
2021-11-06$89,900 Active
-
2021-10-31historical $89,900
-
2019-03-26historical
-
2019-02-01price $62,500
-
2018-10-15$90,000 Active
ⓘ Source: listings_history table (triggers on properties + properties_extension) + one-shot
backfill from property_details.listing_events for pre-trigger history.
Tax reassessment forecast CT · Partial reset (capped growth)
- Current annual tax
- $274 · $23/mo
- Projected year-2 tax
- $1,571 · $131/mo
- Expected delta
- +$1,297/yr (+$108/mo · 473.3%)
ⓘ Screening estimate from a state-policy table — verify with the county assessor before closing.
Climate risk First Street
- Flood 1/10 Low FEMA zone X (unshaded) · 0% chance over 30 yrs
- Wildfire 3/10 Moderate
- Heat 4/10 Moderate 7 d/yr ≥97°F today · 16 d/yr by 30 yrs out
- Wind 6/10 Major 66% chance of damaging wind over 30 yrs
- Air quality 3/10 Moderate 2 unhealthy d/yr today · 3 by 30 yrs out
Nearby sold comps map
Loading sold comps map…
Walkable amenities ~0.75 mi
Loading nearby amenities…
Taxation est. · year 1
- Rental income
- $22,955
- − Mortgage interest
- −$7,506
- − Property taxes
- −$274
- − Insurance
- −$670
- − Repairs & maintenance
- −$1,836
- − Management
- −$1,836
- − HOA
- −$6,000
- − Depreciation
- −$3,898
- Taxable income
- $934
- Est. tax owed @ 24.0%
- −$224
- After-tax cash flow
- $2,534/yr
For passive investors: Depreciation is non-cash, so a rental often shows a tax loss while cash-flowing — sheltering income. Rental losses are passive: they offset passive income freely, and up to $25,000/yr can offset ordinary (W-2) income if you actively participate and your MAGI is under $100k (phasing out to $0 by $150k); unused losses carry forward. On sale, claimed depreciation is recaptured at up to 25%, and gains may owe capital-gains tax (a 1031 exchange can defer both). Figures are a year-1 estimate at your 24.0% rate — not tax advice; consult a CPA.
Schools (NCES district)
- District
- Griswold School District
- NCES district ID
- 0901740
- Math proficiency
- 29% ▼ -22.00%
- Reading proficiency
- 42% ▼ -13.00%
- Median HH income
- $59,711
- Composite
- 31.64/100
- National rank
- #5932
- State rank
- #111 of 153 in CT
Livability — Griswold
No livability data for this city. (Only ~50 U.S. cities are tracked.)
Census & demographics
- Population (ZIP)
- 15,697
Population outlook (Southeastern Connecticut County) Hauer SSP2
- By 2040
- 293,442
Race, ethnicity, and origin ACS 2023
- Neighborhood character
- Predominantly White (89%)
- Race & ethnicity
- White 89% Two or more races 7% Hispanic / Latino 4% Native American 1%
- Common ancestry
- Lithuanian 15% Romanian 10% Slovak 2%
- Foreign-born
- 2% · Canada
- Languages at home
- 97% English-only · Spanish 1% French/Haitian/Cajun 1%
Political lean MEDSL · Southeastern Connecticut
- 2024 margin
- D (+13.0) · D 55.6% · R 42.6% · Other 1.8%
- All cycles
- 2024: D+13.0
Not yet ingested
- Civics
- —
Market trends
- HPI YoY
- ▼ -67.06%
- Current HPI
- 227.571
- Rent YoY
- —
- Metro
- —
- State GDP YoY
- ▲ 1.06%
- F500 in state
- 38
Industry mix (Fortune 500 HQ in CT)
| Industry | F500 HQs | Revenue |
|---|---|---|
| Industrial Machinery | 4 | $38B |
|
||
| Insurance | 3 | $71B |
|
||
| Financial Services | 2 | $25B |
|
||
| Transportation / Logistics | 2 | $18B |
|
||
| Healthcare | 1 | $247B |
|
||
| Telecommunications | 1 | $55B |
|
||
Price history
+48.9% since first listed14 events — show timeline
- 2026-03-29 Listed $134,000 Smart MLS
- 2026-03-26 Coming Soon $134,000 Smart MLS
- 2025-11-30 Listing Removed — Smart MLS
- 2025-11-04 Price Changed $134,900 Smart MLS
- 2025-10-25 Relisted — Smart MLS
- 2025-09-29 Pending — Smart MLS
- 2025-09-19 Listed $144,900 Smart MLS
- 2022-04-04 Sold (MLS) $58,000 Smart MLS
- 2021-12-14 Price Changed $84,900 Smart MLS
- 2021-11-06 Listed $89,900 Smart MLS
- 2021-10-31 Coming Soon $89,900 Smart MLS
- 2019-03-26 Listing Removed — Smart MLS
- 2019-02-01 Price Changed $62,500 Smart MLS
- 2018-10-15 Listed $90,000 Smart MLS
Property tax history
-4.5%/yrLatest (2023): $274 · +0.0% YoY. Source: county tax records.
Cash-flow waterfall
monthlySold comps — $/sqft
last 12 mo · ≤1 miLoading sold comps…