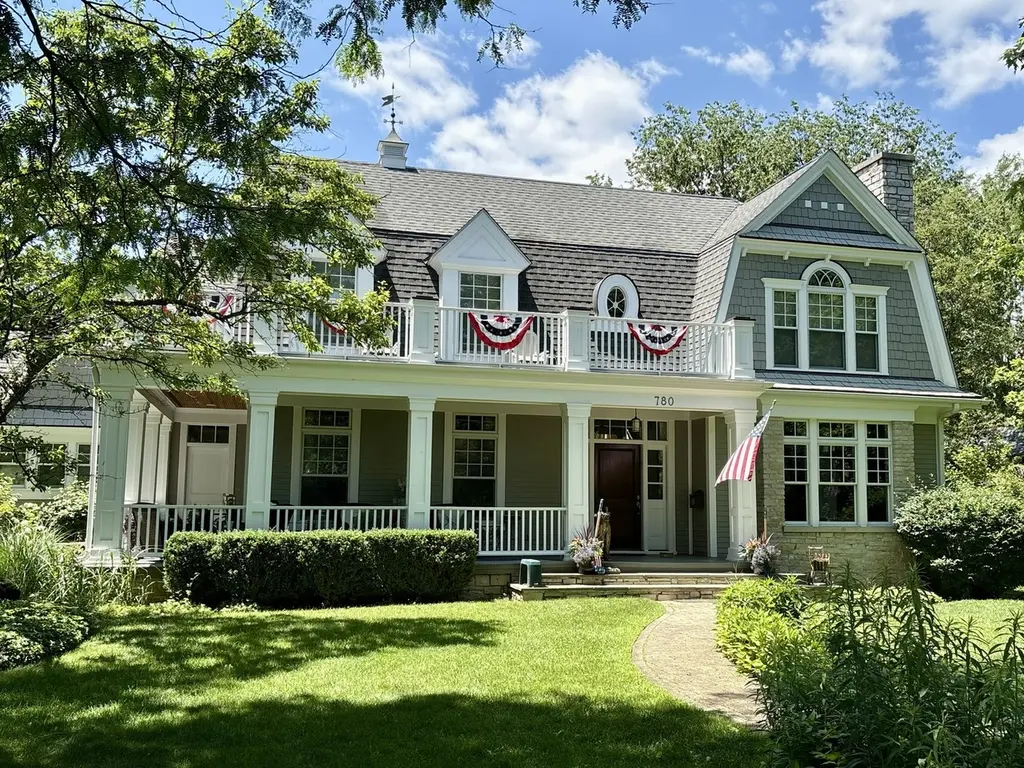
780 Prairie Rd · Glencoe, IL
Flood risk 1/10 · Minimal
- FEMA flood zone
- X (unshaded)
- Chance of flooding over 30 yrs
- 0.0%
- Est. flood insurance / yr
- $473 – $860
Fire risk 1/10 · Minimal
- Est. fire insurance / yr
- $804 – $1,492
Heat risk 2/10 · Minimal
- Hot days now (above 98°F)
- 7 days/yr
- Hot days in 30 yrs
- 14 days/yr
Wind risk 2/10 · Minimal
- Chance of severe wind over 30 yrs
- 1.0%
Air-quality risk 4/10 · Minor
- Unhealthy air days now
- 5 days/yr
- Unhealthy air days in 30 yrs
- 5 days/yr
Risk factors via First Street. Map © Google.
Why this score? — see what drove the F grade
The composite is a weighted blend of 9 inputs, each scored 0–100. Each bar is that input's sub-score; the figure is the points it added to the 100-point composite (weight × sub-score).
- Schools +7.7/10.0
- ARV discount +7.5/15.0
- Livability +4.0/5.0
- Rent growth +2.5/5.0
- Condition / age +2.5/5.0
- Cash flow +0.0/30.0
- 1% rule +0.0/10.0
- DSCR +0.0/10.0
- Appreciation +0.0/10.0
$2,950,000
🖨 Deal sheet (PDF) 📄 Offer letter ✓ Due diligence
Listing remarks
This "New Traditional" home offers uncompromising craftsmanship and easy living luxury. Quality is highlighted by 10+ foot ceilings, extensive fine millwork, gorgeous Cherry cabinetry, heated floors in the basement and primary bathroom, premium Pella windows, Baldwin hardware, and beautiful wideplank Oak floors. The attached two-car and detached 2 car (with storage above) garages offer ample opportunities for the car-enthusiast and or all of the kids' gear. The almost half acre of land across from the SCC golf course provides privacy and space to play or entertain, and the proximity to town, schools, the lagoons and commuting options make it the perfect place to call home. This ho
Key facts
- Attached garage
- Heated floors
- 10 foot ceilings
Tags
Property features AI
Finance
- Other: Commuter train access, interstate access, and school bus service nearby
- HOA & community: No master association fee required
Exterior
- Parking: 4 total parking spaces; 4-car garage (attached and detached listed) with heated garage and garage door opener; Asphalt driveway; Garage owned
- Utilities: Public sewer; 200+ amp electric service; Lake Michigan as water source
- Home design: Detached single-family home; Three stories; Fee simple ownership; Approximately 21–25 years old
- Construction: Stone and shingle siding exterior; Shingle roof; Built ~21–25 years ago; Unfinished basement area exists (small portion unfinished)
- Exterior features: Corner lot; Lot dimensions approximately 101 x 183 x 102 x 186; Lake Michigan water source (municipal supply implied)
Interior
- Kitchen: Island; Pantry; Granite counters; Double oven; Cooktop (gas cooktop); Range hood; Dishwasher; Garbage disposal; Refrigerator
- Bedrooms: 4 bedrooms on upper levels; additional 1 below-grade possible bedroom (basement bedroom 15 x 15)
- Flooring: Hardwood floors on main and upper living areas; Ceramic tile in mud room and laundry; Carpet in some bedrooms, loft and basement recreation areas
- Bathrooms: 4 full bathrooms; 1 half bathroom; Master bath with double sinks, whirlpool tub and separate shower; Basement bathroom(s) present; Whirlpool in at least one bath
- Heating & cooling: Natural gas heating; Forced air; Radiant floor heating; Central air conditioning; 200+ amp electrical service
- Interior features: Walk-in closets; Coffered ceilings; Skylights; Finished full basement; Attic with pull-down stair; Separate dining room; Central vacuum; Ceiling fans; Sump pump with backup; Whole-house generator
- Laundry & utility: Laundry on main and upper levels (multiple locations); Washer and dryer included; Humidifier
Neighborhood map
What this means for you Summary
Snapshot
- This is a 4-bed/4.5-bath single-family listed at $2.95M.
Deal economics
- At list price, monthly cash flow is $-18k ($-212k/yr) — negative.
- To cash-flow at today's rent, offer at most $354k (88.0% below list).
- To meet the 1% rule (rent ≥ 1% of price), the offer needs to be $309k (89.5% below list).
- Recommended offer: $309k (89.5% below list) — sets the bar for 1% rule.
- Cap rate -0.9% vs local median 1.6% in Glencoe — below-typical yield; the buyer is paying a premium for something (appreciation thesis, condition, location) that the cap rate doesn't capture.
Location & tenants
- Location reads 79/100 on livability (#119 in IL, #2,064 nationally) — a middle-class / working-renter tenant base. Strengths: crime A+, commute A+, employment A+; Watch: amenities D+, cost of living F.
- New Trier Twp Hsd 203 (suburban): math 76% / reading 80% proficiency, ranked #2 of 620 in IL (top 0%) — strong family-tenant draw, lease renewals of 3-5y typical.
- Zoned schools: New Trier Township H S Northfield (923 students, 0% FRL).
- Market conditions: 41 active listings in the ZIP; 6,272 units permitted in Cook County in 2024 (4,658 in 5+ unit buildings).
Forward outlook
- Local home prices are declining (-3.0%/yr); year-one equity from $20k of loan paydown is wiped out by about $88k of value loss. Plan a longer hold.
Negotiation context
- It's been on market 30 days — a 2% lower offer ($2.91M) is reasonable based on typical stale-listing flexibility.
- 3 sale attempts with the ask held roughly flat each time — persistent listings suggest the price (not the market) is what's stuck; bring a comps-based counter.
- Current owner paid $620k; list at $2.95M implies a 376% gain — meaningful room to come down on a strong offer.
Questions for the listing agent
- What do current leases actually rent for vs. the listed asking? Can we see a recent rent roll and the last 12 months of T-12 income?
- Is there a deadline driving the sale (1031 exchange, divorce, estate, relocation)? That informs how much negotiation room exists.
- Schools are A-rated — typically a magnet for longer-tenancy family renters. What's the average tenant stay here, and is there a school-zone premium baked into asking?
- The area grade is low — what's the realistic commute time and amenity access for the typical tenant pool here? Any planned neighborhood developments (good or bad) we should know about?
- What's the average days-on-market for RENTAL listings here right now (not sales)? A rising rental-DOM trend means longer vacancies and softer asking-rent achievability than the comps imply.
- What's the recent tenant-quality profile in this submarket — average credit score on applications, eviction rate, late-payment / NSF rate, and stable-employment percentage? A property-management company in the area should have these aggregated.
- How much new for-sale + rental construction is in the pipeline within 1–3 miles? Heavy new supply typically softens prices + rents 12–24 months out; constrained supply supports both.
Investment metrics
- 1% rule
- 0.10% ✗
- Cap rate
- -0.89%
- Cash-on-cash
- -25.65%
- DSCR
- -0.14
- GRM
- 79.5
CMA / ARV
- ARV (on-the-fly)
- $1,754,370
- Comps found
- 12
Show comp detail 12 sales within ~0.75 mi
| Address | Dist | Beds/Ba | Sqft | Sold | Price | $/sf | Match |
|---|---|---|---|---|---|---|---|
| 885 Oak Dr | 0.18mi | 4/4.0 | 4,175 (-8%) | 13mo | $1,610,000 | $386 | 66 |
| 982 Elm Ridge Dr | 0.47mi | 4/4.0 | 4,440 (-2%) | 14mo | $1,815,000 | $409 | 60 |
| 863 Vernon Ave | 0.58mi | 3/4.0 (-1) | 4,458 (-2%) | 8mo | $1,100,000 | $247 | 56 |
| 1077 Green Bay Rd | 0.74mi | 5/5.0 (+1) | 4,500 (-1%) | 2mo | $1,920,000 | $427 | 55 |
| 829 Greenwood Ave | 0.48mi | 5/3.5 (+1) | 4,273 (-6%) | 7mo | $1,850,000 | $433 | 53 |
| 751 Woodridge Ln | 0.40mi | 4/3.0 | 3,926 (-14%) | 0mo | $1,404,000 | $358 | 53 |
| 929 Valley Rd | 0.33mi | 5/3.5 (+1) | 4,270 (-6%) | 19mo | $1,315,000 | $308 | 50 |
| 601 Greenwood Ave | 0.61mi | 5/4.5 (+1) | 4,443 (-2%) | 23mo | $1,700,000 | $383 | 44 |
| 761 Vernon Ave | 0.57mi | 5/4.0 (+1) | 4,300 (-5%) | 23mo | $2,100,000 | $488 | 38 |
| 922 Glencoe Dr | 0.66mi | 5/5.5 (+1) | 4,920 (+8%) | 14mo | $2,035,000 | $414 | 35 |
| 400 Lincoln Ave | 0.48mi | 4/5.5 | 4,000 (-12%) | 23mo | $1,385,000 | $346 | 35 |
| 1020 Edgebrook Ln | 0.51mi | 4/4.5 | 5,200 (+14%) | 23mo | $1,501,300 | $289 | 33 |
Match score weights: distance 35% · size 25% · config 20% · recency 20%. Top-matched comps best support the ARV.
Projected returns pro-forma
-3.0% appreciation · 3.0% rent growth · sell at horizon
- IRR
- -74.4%
- Equity multiple
- -0.94×
- Total profit
- $-1,602,669
- Equity at exit
- $439,855
- IRR
- —
- Equity multiple
- -2.44×
- Total profit
- $-2,844,094
- Equity at exit
- $255,062
Cash invested: $826,000 (down + closing). Projections, not guarantees.
Landlord ↔ Tenant lean methodology
- Overall (STATE)
- 43 Moderately Tenant-Leaning
- State Illinois
- 43 Moderately Tenant-Leaning · D+7
- County
- — inherits STATE
- City
- — inherits STATE
ZIP-level market 60022
- Active inventory
- 41
- Price-to-rent
- 79.5×
Monthly cashflow live
- Estimated rent
- $3,093 medium interval (Pro) →
- Mortgage (P&I)
- −$15,470
- Tax from tax record
- −$3,400 /mo · $40,800/yr
- Insurance
- −$1,229
- HOA
- −$0
- Vacancy / Maint / Mgmt
- −$650
- Net cashflow
- $-17,656
Break-even live
Sensitivity live
| Price | -10% $-15,986 | -5% $-16,821 | +0% $-17,656 | +5% $-18,491 | +10% $-19,326 |
|---|---|---|---|---|---|
| Rent | -10% $-17,900 | -5% $-17,778 | +0% $-17,656 | +5% $-17,534 | +10% $-17,412 |
| Rate | -1.0pp $-16,170 | -0.5pp $-16,906 | base $-17,656 | +0.5pp $-18,420 | +1.0pp $-19,198 |
UW: 25.0% down · 7.5% · 30yr · 1.5% tax · 5.0% vac · 8.0% maint · 8.0% mgmt
Financing live
Cash to close
- Down payment
- $737,500
- Closing costs
- $88,500
- Reserves months
- —
- Total cash needed
- —
Loan-product check · same deal, 3 products live
Conventional
25% down · 7.5% · 30yr
- Down + closing
- —
- Monthly P&I
- —
- Monthly cashflow
- —
- DSCR
- —
- Eligible?
- —
Personal DTI + credit; lowest rate.
DSCR
20% down · 8.5% · 30yr
- Down + closing
- —
- Monthly P&I
- —
- Monthly cashflow
- —
- DSCR
- —
- Eligible?
- —
No personal income docs; deal must DSCR.
Hard money
10% down · 12.0% · 12mo
- Down + closing
- —
- Monthly P&I
- —
- Monthly cashflow
- —
- DSCR
- —
- Eligible?
- —
Short-term bridge; refi at stabilization.
Listing history 21 events
-
2026-06-18days on market $2,950,000 Active 30 DOM
-
2026-06-17days on market $2,950,000 Active 29 DOM
-
2026-06-16days on market $2,950,000 Active 28 DOM
-
2026-06-15days on market $2,950,000 Active 27 DOM
-
2026-06-13days on market $2,950,000 Active 25 DOM
-
2026-06-13days on market $2,950,000 Active 24 DOM
-
2026-06-09days on market $2,950,000 Active 21 DOM
-
2026-06-08days on market $2,950,000 Active 20 DOM
-
2026-06-07pricedays on market $2,950,000 Active 19 DOM
-
2026-06-04days on market $3,100,000 Active 16 DOM
-
2026-06-03days on market $3,100,000 Active 15 DOM
-
2026-06-02days on market $3,100,000 Active 14 DOM
-
2026-06-01days on market $3,100,000 Active 13 DOM
-
2026-05-31days on market $3,100,000 Active 12 DOM
-
2026-05-19$3,100,000 Active
-
2026-05-17historical
-
2026-04-11Active
-
2026-04-11historical
-
2026-03-31Active
-
2002-08-19soldstatus $620,000
-
2001-06-18soldstatus $660,000
ⓘ Source: listings_history table (triggers on properties + properties_extension) + one-shot
backfill from property_details.listing_events for pre-trigger history.
Tax reassessment forecast IL · Partial reset (capped growth)
- Current annual tax
- $40,800 · $3,400/mo
- Projected year-2 tax
- $53,882 · $4,490/mo
- Expected delta
- +$13,083/yr (+$1,090/mo · 32.1%)
ⓘ Screening estimate from a state-policy table — verify with the county assessor before closing.
Climate risk First Street
- Flood 1/10 Low FEMA zone X (unshaded) · 0% chance over 30 yrs
- Wildfire 1/10 Low
- Heat 2/10 Low 7 d/yr ≥98°F today · 14 d/yr by 30 yrs out
- Wind 2/10 Low 100% chance of damaging wind over 30 yrs
- Air quality 4/10 Moderate 5 unhealthy d/yr today · 5 by 30 yrs out
Nearby sold comps map
Loading sold comps map…
Walkable amenities ~0.75 mi
Loading nearby amenities…
Taxation est. · year 1
- Rental income
- $37,115
- − Mortgage interest
- −$165,246
- − Property taxes
- −$40,800
- − Insurance
- −$14,750
- − Repairs & maintenance
- −$2,969
- − Management
- −$2,969
- − Depreciation
- −$85,818
- Taxable loss
- −$275,437
- Est. tax savings @ 24.0%
- +$66,105
- After-tax cash flow
- $-145,766/yr
For passive investors: Depreciation is non-cash, so a rental often shows a tax loss while cash-flowing — sheltering income. Rental losses are passive: they offset passive income freely, and up to $25,000/yr can offset ordinary (W-2) income if you actively participate and your MAGI is under $100k (phasing out to $0 by $150k); unused losses carry forward. On sale, claimed depreciation is recaptured at up to 25%, and gains may owe capital-gains tax (a 1031 exchange can defer both). Figures are a year-1 estimate at your 24.0% rate — not tax advice; consult a CPA.
Schools (NCES district)
- District
- New Trier Twp Hsd 203
- NCES district ID
- 1728200
- Math proficiency
- 76% ▼ -4.00%
- Reading proficiency
- 80% ▼ -1.00%
- Median HH income
- $164,521
- Composite
- 76.94/100
- National rank
- #103
- State rank
- #2 of 620 in IL
Livability — Glencoe
- Score
- 79/100
- State rank
- #119
- US rank
- #2064
Category grades
Schools grade is shown separately in the Schools card above.
Census & demographics
- Census place
- Glencoe, IL
- City population
- 8,415
- Population (ZIP)
- 8,415
Population outlook (Cook County) Hauer SSP2
- Today (2025)
- 5,347,519 people
- By 2030
- 5,357,703 · +0.2%
- By 2040
- 5,324,924 · -0.4%
- By 2050
- 5,230,762 · -2.2%
- By 2075
- 4,785,735 · -10.5%
- By 2100
- 4,188,836 · -21.7%
Race, ethnicity, and origin ACS 2023
- Neighborhood character
- Predominantly White (93%)
- Race & ethnicity
- White 93% Two or more races 2% Hispanic / Latino 2% Black 2% Asian 2%
- Common ancestry
- Scotch-Irish 14% Romanian 7% Subsaharan African 3%
- Foreign-born
- 6% · Canada, Jamaica, South Korea
- Languages at home
- 93% English-only · Russian/Polish/Slavic 2% Spanish 1% French/Haitian/Cajun 1%
Political lean MEDSL · Cook
- 2024 margin
- Solid D (+42.0) · D 70.4% · R 28.4% · Other 1.2%
- 2008→2024 swing
- -11.4pp toward R · 2008: 53.4pp · 2024: 42.0pp
- All cycles
- 2024: D+42.0 2020: D+50.3 2016: D+53.0 2012: D+49.4 2008: D+53.4
Not yet ingested
- Civics
- —
Market trends
- HPI YoY
- ▼ -177.44%
- Current HPI
- 188.4335
- Rent YoY
- —
- Metro
- —
- State GDP YoY
- ▲ 1.59%
- F500 in state
- 60
Industry mix (Fortune 500 HQ in IL)
| Industry | F500 HQs | Revenue |
|---|---|---|
| Insurance | 4 | $201B |
|
||
| Consumer Goods | 4 | $87B |
|
||
| Industrial Machinery | 3 | $64B |
|
||
| Healthcare | 2 | $55B |
|
||
| Retail / Pharmacy | 1 | $148B |
|
||
| Agriculture / Food | 1 | $86B |
|
||
Price history
+369.7% since first listed7 events — show timeline
- 2026-05-19 Listed $3,100,000 MRED as Distributed by MLS Grid
- 2026-05-17 Listing Removed — MRED as Distributed by MLS Grid
- 2026-04-11 Listing Removed — MRED as Distributed by MLS Grid
- 2026-04-11 Listed — MRED as Distributed by MLS Grid
- 2026-03-31 Listed — MRED as Distributed by MLS Grid
- 2002-08-19 Sold (Public Records) $620,000 Public Records
- 2001-06-18 Sold (Public Records) $660,000 Public Records
Property tax history
+2.8%/yrLatest (2023): $40,800 · +7.2% YoY. Source: county tax records.
Cash-flow waterfall
monthlySold comps — $/sqft
last 12 mo · ≤1 miLoading sold comps…