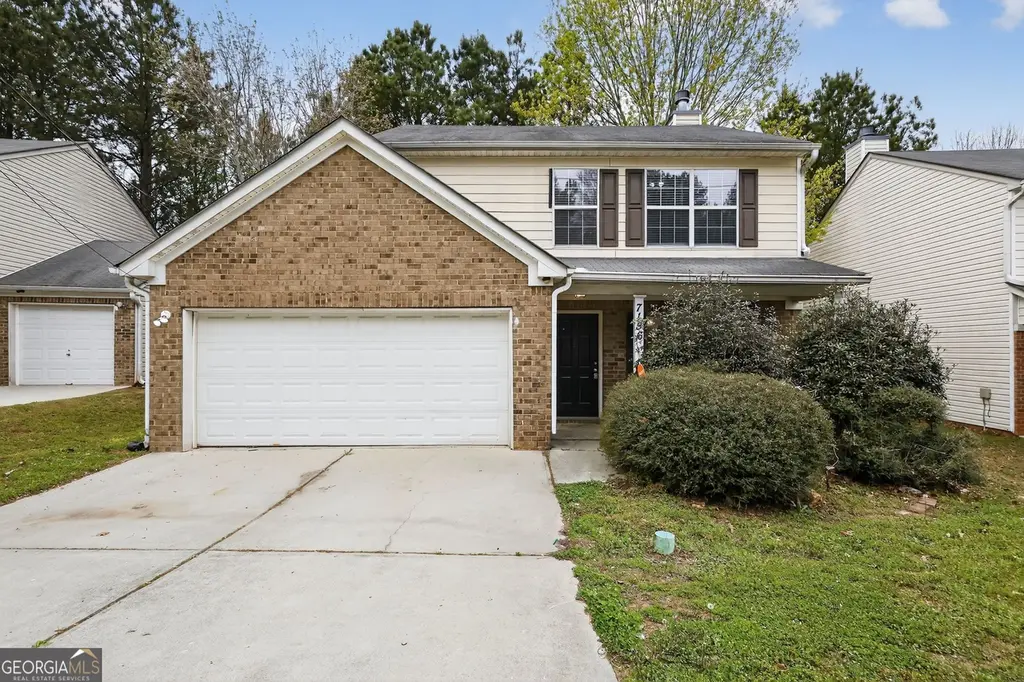
7156 Bowie Dr · Stonecrest, GA
Flood risk 1/10 · Minimal
- FEMA flood zone
- X (unshaded)
- Chance of flooding over 30 yrs
- 0.0%
- Est. flood insurance / yr
- $507 – $1,088
Fire risk 3/10 · Minor
- Est. fire insurance / yr
- $963 – $1,789
Heat risk 6/10 · Moderate
- Hot days now (above 106°F)
- 8 days/yr
- Hot days in 30 yrs
- 20 days/yr
Wind risk 4/10 · Minor
- Chance of severe wind over 30 yrs
- 24.0%
Air-quality risk 5/10 · Moderate
- Unhealthy air days now
- 6 days/yr
- Unhealthy air days in 30 yrs
- 8 days/yr
Risk factors via First Street. Map © Google.
Why this score? — see what drove the D+ grade
The composite is a weighted blend of 9 inputs, each scored 0–100. Each bar is that input's sub-score; the figure is the points it added to the 100-point composite (weight × sub-score).
- ARV discount +15.0/15.0
- Cash flow +13.9/30.0
- 1% rule +5.0/10.0
- DSCR +4.2/10.0
- Rent growth +3.7/5.0
- Livability +2.5/5.0
- Condition / age +2.5/5.0
- Schools +2.1/10.0
- Appreciation +0.0/10.0
$199,900
🖨 Deal sheet 📄 Offer letter ✓ Due diligence
Listing remarks MLS
Move-in ready single-story home in Chestnut Lake Preserve! Features a partially finished basement, fireplace, central A/C, updated kitchen appliances, and carpet/vinyl flooring. Zoned for Murphy Candler Elementary, Salem Middle, and MLK Jr. High. Level lot, friendly HOA, and convenient location.
Key facts
- Central a/c
- Fireplace
- 6,534 sq ft lot
Tags
Neighborhood map
What this means for you Summary
Snapshot
- This is a 4-bed/3.0-bath single-family listed at $200k.
Deal economics
- At list price, monthly cash flow is $22 ($261/yr) — positive.
- The deal already cash-flows at list — no discount required.
- Meets the 1% rule at list price ($2k rent vs $200k).
- Recommended offer: $188k (6.0% below list) — sets the bar for market timing.
- Cap rate 6.4% vs local median 5.1% in Stonecrest — meaningfully above typical; check what's discounted (condition, days-on-market, listing class) to confirm the premium yield is real.
Location & tenants
- Location reads: area grade D — affects rentability + tenant quality, not the cash-flow math above.
- Dekalb County (suburban): math 19% / reading 28% proficiency, ranked #125 of 174 in GA (top 72%) — low school quality limits family demand, transient renter base, plan for 1-2y turnover; 68% free/reduced lunch — lower-income household profile, screen leases tightly.
- Market conditions: Rents rising fast (+4.6%/yr); 320 active listings in the ZIP; 37 comparable units currently listed for rent nearby; rentals at typical pace (median 22d on market — plan ~3-4 weeks tenant-placement turnaround); 1,240 units permitted in DeKalb County in 2024 (385 in 5+ unit buildings).
- This rent runs 33% of the median local income ($74k/yr) — at the standard rent-burdened threshold; future hikes will face affordability resistance.
Forward outlook
- Local home prices are declining (-3.0%/yr); year-one equity from $1k of loan paydown is wiped out by about $6k of value loss. Plan a longer hold.
- DeKalb County population projected at +28% by 2050 — long-run rental-demand tailwind backs the buy-and-hold thesis.
Negotiation context
- It's been on market 83 days — a 6% lower offer ($188k) is reasonable based on typical stale-listing flexibility.
Risks & watch-outs
- Climate carrying-cost: extreme-heat days projected 8→20/yr by 2055 (HVAC capex compounding) — expect insurance premiums to compound above CPI over the hold.
Questions for the listing agent
- It's been on market 83 days. Have you received any prior offers? Is the seller open to a 6% concession, seller financing, or rate buy-down credit?
- What does the HOA fee cover, when was the last increase, and are there any pending special assessments or reserve-fund shortfalls?
- Why hasn't it sold? Are there any deal-killer items the seller is aware of (foundation, flood, title, zoning, code violations)?
- Is there a deadline driving the sale (1031 exchange, divorce, estate, relocation)? That informs how much negotiation room exists.
- The area grade is low — what's the realistic commute time and amenity access for the typical tenant pool here? Any planned neighborhood developments (good or bad) we should know about?
- What's the average days-on-market for RENTAL listings here right now (not sales)? A rising rental-DOM trend means longer vacancies and softer asking-rent achievability than the comps imply.
- What's the recent tenant-quality profile in this submarket — average credit score on applications, eviction rate, late-payment / NSF rate, and stable-employment percentage? A property-management company in the area should have these aggregated.
- How much new for-sale + rental construction is in the pipeline within 1–3 miles? Heavy new supply typically softens prices + rents 12–24 months out; constrained supply supports both.
Investment metrics
- 1% rule
- 1.00% ✓
- Cap rate
- 6.42%
- Cash-on-cash
- 0.47%
- DSCR
- 1.02
- GRM
- 8.3
CMA / ARV
- ARV (median comp)
- $248,007
- List price
- $199,900
- Delta
- -19.40%
- Verdict
- UNDERPRICED
- Comps
- 20 within 1.0 mi
Show comp detail 12 sales within ~0.75 mi
| Address | Dist | Beds/Ba | Sqft | Sold | Price | $/sf | Match |
|---|---|---|---|---|---|---|---|
| 6901 Malvern Ct | 0.06mi | 4/3.0 | 1,624 (-0%) | 0mo | $245,000 | $151 | 97 |
| 7012 Setters Way | 0.13mi | 4/3.5 | 1,586 (-2%) | 5mo | $194,000 | $122 | 84 |
| 7074 Ravenwood Ln | 0.17mi | 3/2.5 (-1) | 1,508 (-7%) | 5mo | $240,000 | $159 | 68 |
| 6684 Browns Mill Trl | 0.42mi | 3/2.0 (-1) | 1,635 (+1%) | 3mo | $245,000 | $150 | 68 |
| 7069 Ravenwood Ln | 0.18mi | 3/2.0 (-1) | 1,520 (-6%) | 5mo | $205,000 | $135 | 68 |
| 7037 Mahonia Pl | 0.24mi | 3/2.5 (-1) | 1,506 (-7%) | 3mo | $200,000 | $133 | 67 |
| 6595 Browns Mill Ferry Dr | 0.37mi | 3/2.0 (-1) | 1,645 (+1%) | 6mo | $215,000 | $131 | 66 |
| 6716 Browns Mill Ferry Dr | 0.54mi | 4/3.0 | 1,524 (-6%) | 7mo | $251,000 | $165 | 59 |
| 4273 Chestnut Lake Ave | 0.59mi | 4/2.5 | 1,515 (-7%) | 0mo | $240,800 | $159 | 58 |
| 4237 Chestnut Lake Ave | 0.54mi | 3/2.5 (-1) | 1,469 (-10%) | 2mo | $200,000 | $136 | 50 |
| 6731 Browns Mill Trl | 0.40mi | 3/2.0 (-1) | 1,398 (-14%) | 4mo | $223,700 | $160 | 45 |
| 6572 Chestnut Oaks Rdg | 0.71mi | 3/2.0 (-1) | 1,497 (-8%) | 6mo | $195,000 | $130 | 39 |
Match score weights: distance 35% · size 25% · config 20% · recency 20%. Top-matched comps best support the ARV.
Projected returns pro-forma
-3.0% appreciation · 4.6% rent growth · sell at horizon
- IRR
- -13.5%
- Equity multiple
- 0.51×
- Total profit
- $-27,586
- Equity at exit
- $29,806
- IRR
- -1.9%
- Equity multiple
- 0.86×
- Total profit
- $-7,767
- Equity at exit
- $17,284
Cash invested: $55,972 (down + closing). Projections, not guarantees.
Landlord ↔ Tenant lean methodology
- Overall (STATE)
- 90 Strongly Landlord-Friendly
- State Georgia
- 90 Strongly Landlord-Friendly · R+3
- County
- — inherits STATE
- City
- — inherits STATE
ZIP-level market 30038
- Home prices YoY
- -28.0%
- Rents YoY
- 4.6%
- Active inventory
- 320
- Price-to-rent
- 8.3×
Monthly cashflow live
- Estimated rent
- $2,004 high interval (Pro) →
- Mortgage (P&I)
- −$1,048
- Tax from tax record
- −$409 /mo · $4,905/yr
- Insurance
- −$83
- HOA
- −$21
- Vacancy / Maint / Mgmt
- −$421
- Net cashflow
- $22
Break-even live
UW: 25.0% down · 7.5% · 30yr · 1.5% tax · 5.0% vac · 8.0% maint · 8.0% mgmt
Financing live
Cash to close
- Down payment
- $49,975
- Closing costs
- $5,997
- Reserves months
- —
- Total cash needed
- —
Loan-product check · same deal, 3 products live
Conventional
25% down · 7.5% · 30yr
- Down + closing
- —
- Monthly P&I
- —
- Monthly cashflow
- —
- DSCR
- —
- Eligible?
- —
Personal DTI + credit; lowest rate.
DSCR
20% down · 8.5% · 30yr
- Down + closing
- —
- Monthly P&I
- —
- Monthly cashflow
- —
- DSCR
- —
- Eligible?
- —
No personal income docs; deal must DSCR.
Hard money
10% down · 12.0% · 12mo
- Down + closing
- —
- Monthly P&I
- —
- Monthly cashflow
- —
- DSCR
- —
- Eligible?
- —
Short-term bridge; refi at stabilization.
Rent comps 37 comps
| Address | Beds | Baths | Sqft | Rent | $/sqft | DOM | Units | Dist |
|---|---|---|---|---|---|---|---|---|
| 7132 Bowie Dr Lithonia, GA | 3.0 | 2.5 | 1571 | $1,904 | $1.21 | 12d | 1 | 0.06mi |
| 7152 Ravenwood Ln Lithonia, GA | 4.0 | 3.0 | 1500 | $1,915 | $1.28 | 43d | 1 | 0.06mi |
| 7020 Setters Way Lithonia, GA | 4.0 | 2.0 | 1573 | $1,819 | $1.16 | 43d | 1 | 0.10mi |
| 6989 Setters Way Lithonia, GA | 4.0 | 2.0 | 1526 | $1,795 | $1.18 | 5d | 1 | 0.11mi |
| 4868 Browns Mill Ferry Rd Lithonia, GA | 3.0 | 2.5 | 1606 | $1,927 | $1.20 | 43d | 1 | 0.11mi |
| 4848 Browns Mill Ferry Rd Lithonia, GA | 4.0 | 3.0 | 1836 | $2,195 | $1.20 | 24d | 1 | 0.12mi |
| 6857 Mahonia Pl Lithonia, GA | 4.0 | 2.5 | 2192 | $1,795 | $0.82 | 43d | 1 | 0.13mi |
| 6858 Mahonia Pl Lithonia, GA | 3.0 | 2.5 | 1580 | $1,695 | $1.07 | 43d | 1 | 0.14mi |
| 6940 Red Bone Way Lithonia, GA | 3.0 | 2.5 | 1494 | $1,949 | $1.30 | 5d | 1 | 0.16mi |
| 7078 Bowie Dr Lithonia, GA | 4.0 | 2.5 | 1571 | $1,781 | $1.13 | 43d | 1 | 0.17mi |
| 7093 Mahonia Pl Lithonia, GA | 3.0 | 2.5 | 1500 | $1,895 | $1.26 | 24d | 1 | 0.22mi |
| 6957 Mahonia Pl Lithonia, GA | 4.0 | 2.0 | 1560 | $1,931 | $1.24 | 43d | 1 | 0.24mi |
| 6626 Browns Mill Ferry Dr Lithonia, GA | 3.0 | 2.0 | 1382 | $1,820 | $1.32 | 2d | 1 | 0.40mi |
| 6700 Browns Mill Ferry Dr Lithonia, GA | 3.0 | 2.0 | 1587 | $1,765 | $1.11 | 5d | 1 | 0.52mi |
| 6613 Chestnut Oaks Rdg Lithonia, GA | 3.0 | 2.5 | 1438 | $1,985 | $1.38 | 5d | 1 | 0.63mi |
| 6530 Lake Mill Ct Lithonia, GA | 4.0 | 2.0 | 2233 | $1,640 | $0.73 | 12d | 1 | 0.78mi |
| 6506 Chestnut Lake Xing Lithonia, GA | 4.0 | 2.5 | 2014 | $2,060 | $1.02 | 3d | 1 | 0.85mi |
| 6274 Varnay Ct Stonecrest, GA | 3.0 | 2.0 | 1427 | $1,915 | $1.34 | 15d | 1 | 0.94mi |
| 6354 Klondike River Rd Lithonia, GA | 3.0 | 2.5 | 1521 | $1,830 | $1.20 | 43d | 1 | 0.96mi |
| 6609 Carmen Ct Lithonia, GA | 3.0 | 2.0 | 1633 | $1,200 | $0.73 | 17d | 1 | 0.99mi |
| 5014 River Overlook Way Lithonia, GA | 3.0 | 2.5 | 2017 | $2,060 | $1.02 | 24d | 1 | 1.04mi |
| 6625 Paula Ct Unit Labs Stonecrest, GA | 4.0 | 2.0 | 1925 | $2,000 | $1.04 | 18d | 1 | 1.06mi |
| 6265 Leverett Dr Lithonia, GA | 3.0 | 2.0 | 1378 | $1,595 | $1.16 | 24d | 1 | 1.07mi |
| 4436 Jackam Ridge Ct Lithonia, GA | 3.0 | 2.0 | 1981 | $2,080 | $1.05 | 5d | 1 | 1.08mi |
| 6295 Klondike River Rd Lithonia, GA | 4.0 | 2.5 | 1742 | $1,930 | $1.11 | 5d | 1 | 1.08mi |
| 4651 Jackam Ridge Ct Lithonia, GA | 3.0 | 2.0 | 1441 | $1,970 | $1.37 | 43d | 1 | 1.09mi |
| 4393 English Loop Lithonia, GA | 3.0 | 2.0 | 1820 | $1,900 | $1.04 | 19d | 1 | 1.17mi |
| 6467 Gina Agha Cir Lithonia, GA | 5.0 | 2.5 | 1939 | $2,159 | $1.11 | 21d | 1 | 1.20mi |
| 4675 Forest Creek Ln Lithonia, GA | 4.0 | 2.5 | 1854 | $2,200 | $1.19 | 43d | 1 | 1.21mi |
| 4636 Forest Creek Ln Lithonia, GA | 3.0 | 2.5 | 1476 | $1,650 | $1.12 | 24d | 1 | 1.25mi |
| 4584 Garden City Dr Lithonia, GA | 4.0 | 2.5 | 1958 | $2,300 | $1.17 | 1d | 1 | 1.26mi |
| 6215 Klondike River Rd Lithonia, GA | 4.0 | 3.0 | 2048 | $1,875 | $0.92 | 5d | 1 | 1.28mi |
| 4756 Golod Way Lithonia, GA | 3.0 | 2.0 | 1578 | $1,820 | $1.15 | 24d | 1 | 1.31mi |
| 4744 Golod Way Lithonia, GA | 3.0 | 2.0 | 1584 | $1,695 | $1.07 | 43d | 1 | 1.32mi |
| 6950 Carleen Ct Lithonia, GA | 3.0 | 2.0 | 1784 | $1,945 | $1.09 | 12d | 1 | 1.32mi |
| 6269 Cathedral Ln Lithonia, GA | 3.0 | 2.0 | 1328 | $1,725 | $1.30 | 12d | 1 | 1.34mi |
| 4609 Post Ridge Ln Lithonia, GA | 3.0 | 2.0 | 1527 | $1,855 | $1.21 | 43d | 1 | 1.44mi |
HOA detail
- Monthly dues
- $21 · $252/yr
Listing history 16 events
-
2026-06-18days on market $199,900 Active 83 DOM
-
2026-06-17days on market $199,900 Active 82 DOM
-
2026-06-16days on market $199,900 Active 81 DOM
-
2026-06-15statusdays on market $199,900 Active 80 DOM
-
2026-06-13pricestatusdays on market $199,900 Price Change 78 DOM
-
2026-06-09days on market $214,900 Active 74 DOM
-
2026-06-08days on market $214,900 Active 73 DOM
-
2026-06-07days on market $214,900 Active 72 DOM
-
2026-06-04days on market $214,900 Active 69 DOM
-
2026-06-03days on market $214,900 Active 68 DOM
-
2026-06-02days on market $214,900 Active 67 DOM
-
2026-06-01statusdays on market $214,900 Active 66 DOM
-
2026-05-31days on market $214,900 Price Change 65 DOM
-
2026-05-15price $219,900 296-char remark
Show marketing remark (296 chars)
Move-in ready single-story home in Chestnut Lake Preserve! Features a partially finished basement, fireplace, central A/C, updated kitchen appliances, and carpet/vinyl flooring. Zoned for Murphy Candler Elementary, Salem Middle, and MLK Jr. High. Level lot, friendly HOA, and convenient location.
-
2026-04-24price $229,900 296-char remark
Show marketing remark (296 chars)
Move-in ready single-story home in Chestnut Lake Preserve! Features a partially finished basement, fireplace, central A/C, updated kitchen appliances, and carpet/vinyl flooring. Zoned for Murphy Candler Elementary, Salem Middle, and MLK Jr. High. Level lot, friendly HOA, and convenient location.
-
2026-03-27$234,900 New 296-char remark
Show marketing remark (296 chars)
Move-in ready single-story home in Chestnut Lake Preserve! Features a partially finished basement, fireplace, central A/C, updated kitchen appliances, and carpet/vinyl flooring. Zoned for Murphy Candler Elementary, Salem Middle, and MLK Jr. High. Level lot, friendly HOA, and convenient location.
ⓘ Source: listings_history table (triggers on properties + properties_extension) + one-shot
backfill from property_details.listing_events for pre-trigger history.
Tax reassessment forecast GA · Resets to sale price
- Current annual tax
- $4,905 · $409/mo
- Projected year-2 tax
- $4,905 · $409/mo
- Expected delta
- $0/yr ($0/mo · 0.0%)
ⓘ Screening estimate from a state-policy table — verify with the county assessor before closing.
Climate risk First Street
- Flood 1/10 Low FEMA zone X (unshaded) · 0% chance over 30 yrs
- Wildfire 3/10 Moderate
- Heat 6/10 Major 8 d/yr ≥106°F today · 20 d/yr by 30 yrs out
- Wind 4/10 Moderate 24% chance of damaging wind over 30 yrs
- Air quality 5/10 Major 6 unhealthy d/yr today · 8 by 30 yrs out
Nearby sold comps map
Loading sold comps map…
Walkable amenities ~0.75 mi
Loading nearby amenities…
Taxation est. · year 1
- Rental income
- $24,048
- − Mortgage interest
- −$11,198
- − Property taxes
- −$4,905
- − Insurance
- −$1,000
- − Repairs & maintenance
- −$1,924
- − Management
- −$1,924
- − HOA
- −$252
- − Depreciation
- −$5,815
- Taxable loss
- −$2,969
- Est. tax savings @ 24.0%
- +$713
- After-tax cash flow
- $974/yr
For passive investors: Depreciation is non-cash, so a rental often shows a tax loss while cash-flowing — sheltering income. Rental losses are passive: they offset passive income freely, and up to $25,000/yr can offset ordinary (W-2) income if you actively participate and your MAGI is under $100k (phasing out to $0 by $150k); unused losses carry forward. On sale, claimed depreciation is recaptured at up to 25%, and gains may owe capital-gains tax (a 1031 exchange can defer both). Figures are a year-1 estimate at your 24.0% rate — not tax advice; consult a CPA.
Schools (NCES district)
- District
- Dekalb County
- NCES district ID
- 1301740
- Math proficiency
- 19% ▼ -12.00%
- Reading proficiency
- 28% ▼ -7.00%
- Median HH income
- $51,448
- Composite
- 20.92/100
- National rank
- #8482
- State rank
- #125 of 174 in GA
Livability — Stonecrest
No livability data for this city. (Only ~50 U.S. cities are tracked.)
Census & demographics
- Census place
- Stonecrest, GA
- County
- Dekalb County · 782,738 people
- City population
- 106,165
- Metro
- Atlanta-Sandy Springs-Alpharetta, GA
- Population (ZIP)
- 43,776
- Household income
- $73,694
- Rent vs Own
- Severe rent burden
- 1168.0
Population outlook (DeKalb County) Hauer SSP2
- Today (2025)
- 839,977 people
- By 2030
- 891,768 · +6.2%
- By 2040
- 988,894 · +17.7%
- By 2050
- 1,074,583 · +27.9%
- By 2075
- 1,245,026 · +48.2%
- By 2100
- 1,303,135 · +55.1%
Race, ethnicity, and origin ACS 2023
- Neighborhood character
- Predominantly Black (84%)
- Race & ethnicity
- Black 84% Two or more races 10% Hispanic / Latino 5% White 4% Asian 1%
- Foreign-born
- 12% · Canada, China
- Languages at home
- 90% English-only · Spanish 5% French/Haitian/Cajun 1% Other Indo-European 0%
Political lean MEDSL · DeKalb
- 2024 margin
- Solid D (+64.8) · D 81.9% · R 17.1% · Other 1.0%
- 2008→2024 swing
- +6.1pp toward D · 2008: 58.6pp · 2024: 64.8pp
- All cycles
- 2024: D+64.8 2020: D+67.4 2016: D+64.8 2012: D+56.8 2008: D+58.6
Not yet ingested
- Civics
- —
Market trends
- HPI YoY
- ▼ -74.98%
- Current HPI
- 192.8328
- Rent YoY
- ▲ 4.60%
- Metro
- Atlanta-Sandy Springs-Alpharetta, GA
- State GDP YoY
- ▲ 2.66%
- F500 in state
- 28
Industry mix (Fortune 500 HQ in GA)
| Industry | F500 HQs | Revenue |
|---|---|---|
| Paper / Packaging | 2 | $29B |
|
||
| Retail | 1 | $160B |
|
||
| Transportation / Logistics | 1 | $91B |
|
||
| Airlines | 1 | $62B |
|
||
| Consumer Goods | 1 | $47B |
|
||
| Utilities | 1 | $25B |
|
||
Price history
-6.4% since first listed3 events — show timeline
- 2026-05-15 Price Changed $219,900 GAMLS
- 2026-04-24 Price Changed $229,900 GAMLS
- 2026-03-27 Listed $234,900 GAMLS
Property tax history
+7.5%/yrLatest (2025): $4,905 · +23.9% YoY. Source: county tax records.
Cash-flow waterfall
monthlySold comps — $/sqft
last 12 mo · ≤1 miLoading sold comps…