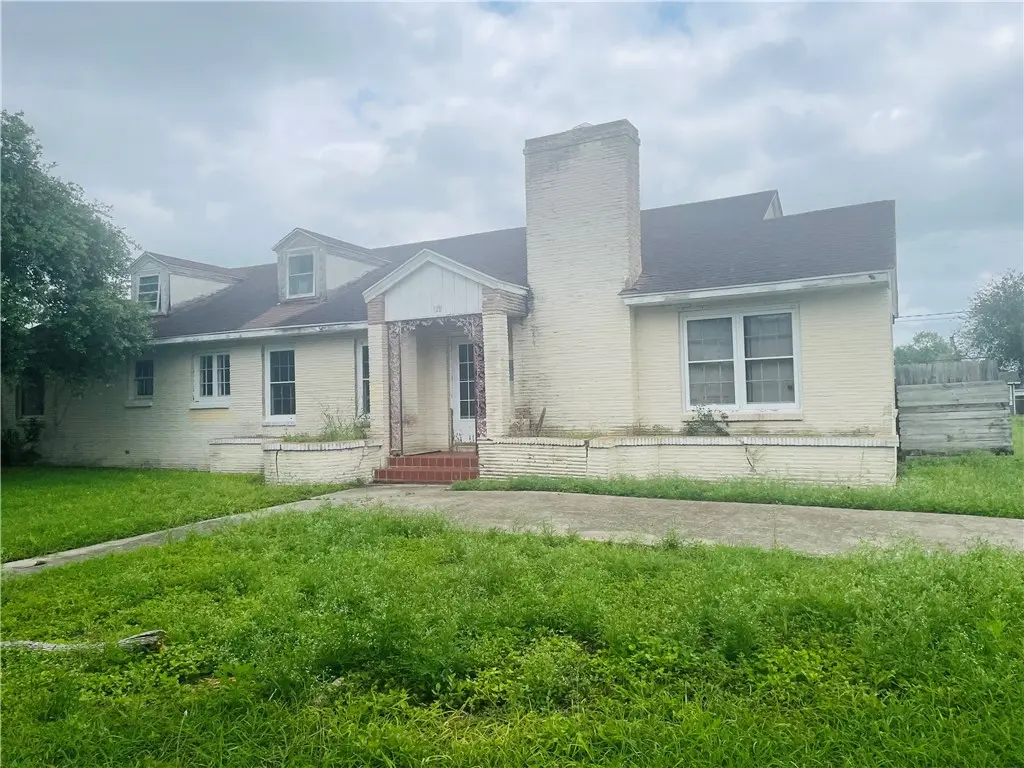
626 Fetick Ave · Taft, TX
Flood risk 1/10 · Minimal
- FEMA flood zone
- X (unshaded)
- Chance of flooding over 30 yrs
- 0.0%
- Est. flood insurance / yr
- $507 – $1,088
Fire risk 1/10 · Minimal
- Est. fire insurance / yr
- $1,222 – $2,270
Heat risk 10/10 · Severe
- Hot days now (above 107°F)
- 7 days/yr
- Hot days in 30 yrs
- 25 days/yr
Wind risk 9/10 · Severe
- Chance of severe wind over 30 yrs
- 99.0%
Air-quality risk 1/10 · Minimal
- Unhealthy air days now
- 0 days/yr
- Unhealthy air days in 30 yrs
- 0 days/yr
Risk factors via First Street. Map © Google.
Why this score? — see what drove the D grade
The composite is a weighted blend of 9 inputs, each scored 0–100. Each bar is that input's sub-score; the figure is the points it added to the 100-point composite (weight × sub-score).
- Cash flow +11.1/30.0
- ARV discount +7.5/15.0
- Appreciation +7.2/10.0
- 1% rule +4.4/10.0
- DSCR +3.2/10.0
- Livability +3.2/5.0
- Rent growth +2.5/5.0
- Condition / age +2.5/5.0
- Schools +2.0/10.0
$85,000
🖨 Deal sheet (PDF) 📄 Offer letter ✓ Due diligence
Listing remarks
Bring back this home to it's former craftsman style glory!! Most of the home has been taken to the studs, so that your imagination can be brought to fruition. Potential for 4 bedroom/2bath plus a sunroom. Seller is motivated and will consider owner finance.
Key facts
- 0.43 acre lot
- Garage
- Built 1942
Property features AI
Finance
- HOA & community: Short-term rentals allowed
Exterior
- Parking: Assigned parking; Rear/side/off-street parking; 1 covered parking space; 1-car garage
- Utilities: Public water; Public sewer; Water and sewer available
- Home design: Single-story home; Shingle roof; Veneer exterior; Pillar/post/pier foundation
- Construction: Built with veneer materials
- Exterior features: Interior lot
Interior
- Interior features: No notable interior features listed; Wood-burning fireplace
Neighborhood map
What this means for you Summary
Snapshot
- This is a 3-bed/?-bath single-family listed at $85k.
Deal economics
- At list price, monthly cash flow is $-34 ($-406/yr) — negative.
- To cash-flow at today's rent, offer at most $79k (7.0% below list).
- To meet the 1% rule (rent ≥ 1% of price), the offer needs to be $80k (6.5% below list).
- Recommended offer: $79k (7.0% below list) — sets the bar for cash-flow.
Location & tenants
- Location reads 65/100 on livability (#673 in TX) — a middle-class / working-renter tenant base. Strengths: crime A+, cost of living A+, housing A+; Watch: amenities F, commute F, employment F.
- Taft ISD (town): math 24% / reading 24% proficiency, ranked #727 of 826 in TX (top 88%) — low school quality limits family demand, transient renter base, plan for 1-2y turnover; 77% free/reduced lunch — lower-income household profile, screen leases tightly.
- Zoned schools: Woodroe Petty El (math 18% / reading 22%, grade F, #3,536 of 4,322 statewide, top 83%, 381 students, 92% FRL); Ricardo L Trevino J H (math 28% / reading 26%, grade F, #1,177 of 1,662 statewide, top 72%, 199 students, 90% FRL); Taft H S (math 27% / reading 27%, grade F, #1,204 of 1,632 statewide, top 75%, 242 students, 80% FRL).
- Market conditions: 61 active listings in the ZIP; 1 comparable units currently listed for rent nearby; 344 units permitted in San Patricio County in 2024 (0 in 5+ unit buildings).
Forward outlook
- In year one you build about $4k of equity ($588 loan paydown + $4k appreciation (4.4% local appreciation)).
- San Patricio County population projected at +27% by 2050 — long-run rental-demand tailwind backs the buy-and-hold thesis.
- At projected returns (4.4% appreciation + 3.0% rent growth), your $24k cash investment doubles in ~6 years — after that, you're playing with house money.
- By year 8, paydown + projected appreciation supports a ~$33k cash-out refi (75% LTV) — recoverable capital for the next deal without selling this one.
Negotiation context
- It's been on market 24 days — a 2% lower offer ($84k) is reasonable based on typical stale-listing flexibility.
Risks & watch-outs
- Watch-outs: property tax is 2.6% of price; built in 1942 — expect roof / HVAC / electrical / plumbing capex.
- Climate carrying-cost: severe wind risk, 99% chance of damaging wind over 30y; extreme-heat days projected 7→25/yr by 2055 (HVAC capex compounding) — expect insurance premiums to compound above CPI over the hold.
Questions for the listing agent
- What do current leases actually rent for vs. the listed asking? Can we see a recent rent roll and the last 12 months of T-12 income?
- Built in 1942 — when were the roof, HVAC, electrical panel, plumbing, and water heater last replaced?
- Property tax is high relative to price — has the assessment been appealed recently, and will the sale trigger a re-assessment?
- Is there a deadline driving the sale (1031 exchange, divorce, estate, relocation)? That informs how much negotiation room exists.
- Schools are F-rated, which usually means shorter tenancies and higher turnover. Who's the typical renter profile here, and what's been the actual vacancy rate?
- The area grade is low — what's the realistic commute time and amenity access for the typical tenant pool here? Any planned neighborhood developments (good or bad) we should know about?
- What's the average days-on-market for RENTAL listings here right now (not sales)? A rising rental-DOM trend means longer vacancies and softer asking-rent achievability than the comps imply.
- What's the recent tenant-quality profile in this submarket — average credit score on applications, eviction rate, late-payment / NSF rate, and stable-employment percentage? A property-management company in the area should have these aggregated.
- How much new for-sale + rental construction is in the pipeline within 1–3 miles? Heavy new supply typically softens prices + rents 12–24 months out; constrained supply supports both.
Investment metrics
- 1% rule
- 0.94% ✗
- Cap rate
- 5.82%
- Cash-on-cash
- -1.70%
- DSCR
- 0.92
- GRM
- 8.9
CMA / ARV
- ARV (on-the-fly)
- $306,876
- Comps found
- 2
Show comp detail 2 sales within ~0.75 mi
| Address | Dist | Beds/Ba | Sqft | Sold | Price | $/sf | Match |
|---|---|---|---|---|---|---|---|
| 530 Green Ave | 0.18mi | 3/2.0 | 3,083 (+8%) | 16mo | $230,000 | $75 | 66 |
| 643 Reynolds Ave | 0.18mi | 3/2.0 | 2,562 (-11%) | 24mo | $275,000 | $107 | 54 |
Match score weights: distance 35% · size 25% · config 20% · recency 20%. Top-matched comps best support the ARV.
Projected returns pro-forma
4.44% appreciation · 3.0% rent growth · sell at horizon
- IRR
- 10.0%
- Equity multiple
- 1.62×
- Total profit
- $14,788
- Equity at exit
- $45,287
- IRR
- 11.7%
- Equity multiple
- 3.02×
- Total profit
- $48,059
- Equity at exit
- $75,876
Cash invested: $23,800 (down + closing). Projections, not guarantees.
Landlord ↔ Tenant lean methodology
- Overall (STATE)
- 87 Strongly Landlord-Friendly
- State Texas
- 87 Strongly Landlord-Friendly · R+5
- County
- — inherits STATE
- City
- — inherits STATE
ZIP-level market 78390
- Home prices YoY
- 3.7%
- Active inventory
- 61
- Price-to-rent
- 8.9×
Monthly cashflow live
- Estimated rent
- $795 medium interval (Pro) →
- Mortgage (P&I)
- −$446
- Tax from tax record
- −$181 /mo · $2,168/yr
- Insurance
- −$35
- HOA
- −$0
- Vacancy / Maint / Mgmt
- −$167
- Net cashflow
- $-34
Break-even live
Sensitivity live
| Price | -10% $14 | -5% $-10 | +0% $-34 | +5% $-58 | +10% $-82 |
|---|---|---|---|---|---|
| Rent | -10% $-97 | -5% $-65 | +0% $-34 | +5% $-2 | +10% $29 |
| Rate | -1.0pp $9 | -0.5pp $-12 | base $-34 | +0.5pp $-56 | +1.0pp $-78 |
UW: 25.0% down · 7.5% · 30yr · 1.5% tax · 5.0% vac · 8.0% maint · 8.0% mgmt
Financing live
Cash to close
- Down payment
- $21,250
- Closing costs
- $2,550
- Reserves months
- —
- Total cash needed
- —
Loan-product check · same deal, 3 products live
Conventional
25% down · 7.5% · 30yr
- Down + closing
- —
- Monthly P&I
- —
- Monthly cashflow
- —
- DSCR
- —
- Eligible?
- —
Personal DTI + credit; lowest rate.
DSCR
20% down · 8.5% · 30yr
- Down + closing
- —
- Monthly P&I
- —
- Monthly cashflow
- —
- DSCR
- —
- Eligible?
- —
No personal income docs; deal must DSCR.
Hard money
10% down · 12.0% · 12mo
- Down + closing
- —
- Monthly P&I
- —
- Monthly cashflow
- —
- DSCR
- —
- Eligible?
- —
Short-term bridge; refi at stabilization.
Rent comps 1 comps
| Address | Beds | Baths | Sqft | Rent | $/sqft | DOM | Units | Dist |
|---|---|---|---|---|---|---|---|---|
| 219 Tutt Ave Taft, TX | 2.0 | 1.0 | 2818 | $795 | $0.28 | 15d | 1 | 0.42mi |
Listing history 22 events
-
2026-06-22days on market $85,000 Active 24 DOM
-
2026-06-18days on market $85,000 Active 21 DOM
-
2026-06-17days on market $85,000 Active 20 DOM
-
2026-06-16days on market $85,000 Active 19 DOM
-
2026-06-15days on market $85,000 Active 18 DOM
-
2026-06-14days on market $85,000 Active 16 DOM
-
2026-06-13days on market $85,000 Active 15 DOM
-
2026-06-10days on market $85,000 Active 13 DOM
-
2026-06-09days on market $85,000 Active 12 DOM
-
2026-06-08days on market $85,000 Active 11 DOM
-
2026-06-07days on market $85,000 Active 10 DOM
-
2026-06-05days on market $85,000 Active 7 DOM
-
2026-06-03days on market $85,000 Active 6 DOM
-
2026-06-02days on market $85,000 Active 5 DOM
-
2026-06-01days on market $85,000 Active 4 DOM
-
2026-05-31days on market $85,000 Active 3 DOM
-
2026-05-30days on market $85,000 Active 2 DOM
-
2026-05-28$85,000 Active
-
2017-02-03soldstatus
-
2011-01-18soldstatus
-
2006-12-29soldstatus
-
1992-04-06soldstatus
ⓘ Source: listings_history table (triggers on properties + properties_extension) + one-shot
backfill from property_details.listing_events for pre-trigger history.
Tax reassessment forecast TX · Resets to sale price
- Current annual tax
- $2,168 · $181/mo
- Projected year-2 tax
- $2,168 · $181/mo
- Expected delta
- $0/yr ($0/mo · 0.0%)
ⓘ Screening estimate from a state-policy table — verify with the county assessor before closing.
Climate risk First Street
- Flood 1/10 Low FEMA zone X (unshaded) · 0% chance over 30 yrs
- Wildfire 1/10 Low
- Heat 10/10 Extreme 7 d/yr ≥107°F today · 25 d/yr by 30 yrs out
- Wind 9/10 Extreme 99% chance of damaging wind over 30 yrs
- Air quality 1/10 Low 0 unhealthy d/yr today · 0 by 30 yrs out
Nearby sold comps map
Loading sold comps map…
Walkable amenities ~0.75 mi
Loading nearby amenities…
Taxation est. · year 1
- Rental income
- $9,540
- − Mortgage interest
- −$4,761
- − Property taxes
- −$2,168
- − Insurance
- −$425
- − Repairs & maintenance
- −$763
- − Management
- −$763
- − Depreciation
- −$2,473
- Taxable loss
- −$1,814
- Est. tax savings @ 24.0%
- +$435
- After-tax cash flow
- $30/yr
For passive investors: Depreciation is non-cash, so a rental often shows a tax loss while cash-flowing — sheltering income. Rental losses are passive: they offset passive income freely, and up to $25,000/yr can offset ordinary (W-2) income if you actively participate and your MAGI is under $100k (phasing out to $0 by $150k); unused losses carry forward. On sale, claimed depreciation is recaptured at up to 25%, and gains may owe capital-gains tax (a 1031 exchange can defer both). Figures are a year-1 estimate at your 24.0% rate — not tax advice; consult a CPA.
Schools (NCES district)
- District
- Taft ISD
- NCES district ID
- 4842060
- Math proficiency
- 24% ▼ -6.00%
- Reading proficiency
- 24% ▲ 2.00%
- Median HH income
- $40,110
- Composite
- 20.29/100
- National rank
- #8618
- State rank
- #727 of 826 in TX
Livability — Taft
- Score
- 65/100
- State rank
- #673
- US rank
- #12651
Category grades
Schools grade is shown separately in the Schools card above.
Census & demographics
- Census place
- Taft, TX
- Population (ZIP)
- 5,620
Population outlook (San Patricio County) Hauer SSP2
- Today (2025)
- 75,538 people
- By 2030
- 79,575 · +5.3%
- By 2040
- 87,670 · +16.1%
- By 2050
- 96,107 · +27.2%
- By 2075
- 117,984 · +56.2%
- By 2100
- 130,010 · +72.1%
Race, ethnicity, and origin ACS 2023
- Neighborhood character
- Predominantly Hispanic (78%)
- Race & ethnicity
- Hispanic / Latino 78% Two or more races 52% White 21%
- Hispanic origin (detail)
- Mexican 75%
- Common ancestry
- Slovak 1% Lithuanian 1%
- Foreign-born
- 3% · Canada
- Languages at home
- 61% English-only · Spanish 39%
Political lean MEDSL · San Patricio
- 2024 margin
- Solid R (+36.4) · D 31.4% · R 67.8%
- 2008→2024 swing
- -19.8pp toward R · 2008: -16.6pp · 2024: -36.4pp
- All cycles
- 2024: R+36.4 2020: R+29.1 2016: R+24.1 2012: R+20.6 2008: R+16.6
Not yet ingested
- Civics
- —
Market trends
- HPI YoY
- ▲ 4.44%
- Current HPI
- 123.4461
- Rent YoY
- —
- Metro
- —
- State GDP YoY
- ▲ 3.95%
- F500 in state
- 110
Industry mix (Fortune 500 HQ in TX)
| Industry | F500 HQs | Revenue |
|---|---|---|
| Energy | 16 | $1,198B |
|
||
| Technology | 5 | $198B |
|
||
| Engineering / Construction | 4 | $72B |
|
||
| Energy Services | 3 | $60B |
|
||
| Utilities | 3 | $41B |
|
||
| Healthcare | 2 | $330B |
|
||
Price history
5 events — show timeline
- 2026-05-28 Listed $85,000 CBMLS
- 2017-02-03 Sold (Public Records) — Public Records
- 2011-01-18 Sold (Public Records) — Public Records
- 2006-12-29 Sold (Public Records) — Public Records
- 1992-04-06 Sold (Public Records) — Public Records
Property tax history
-1.8%/yrLatest (2025): $2,168 · -23.2% YoY. Source: county tax records.
Cash-flow waterfall
monthlySold comps — $/sqft
last 12 mo · ≤1 miLoading sold comps…