7950 N Stadium Dr #138 · Houston, TX
Flood risk 1/10 · Minimal
- FEMA flood zone
- X (shaded)
- Chance of flooding over 30 yrs
- 0.0%
- Est. flood insurance / yr
- $507 – $1,088
Fire risk 1/10 · Minimal
- Est. fire insurance / yr
- $1,222 – $2,270
Heat risk 9/10 · Severe
- Hot days now (above 109°F)
- 7 days/yr
- Hot days in 30 yrs
- 24 days/yr
Wind risk 9/10 · Severe
- Chance of severe wind over 30 yrs
- 99.0%
Air-quality risk 2/10 · Minimal
- Unhealthy air days now
- 2 days/yr
- Unhealthy air days in 30 yrs
- 2 days/yr
Risk factors via First Street. Map © Google.
Why this score? — see what drove the D grade
The composite is a weighted blend of 9 inputs, each scored 0–100. Each bar is that input's sub-score; the figure is the points it added to the 100-point composite (weight × sub-score).
- ARV discount +15.0/15.0
- 1% rule +9.0/10.0
- Cash flow +5.2/30.0
- Livability +3.7/5.0
- Schools +2.7/10.0
- Condition / age +2.5/5.0
- Rent growth +2.1/5.0
- DSCR +0.0/10.0
- Appreciation +0.0/10.0
$89,900
🖨 Deal sheet (PDF) 📄 Offer letter ✓ Due diligence
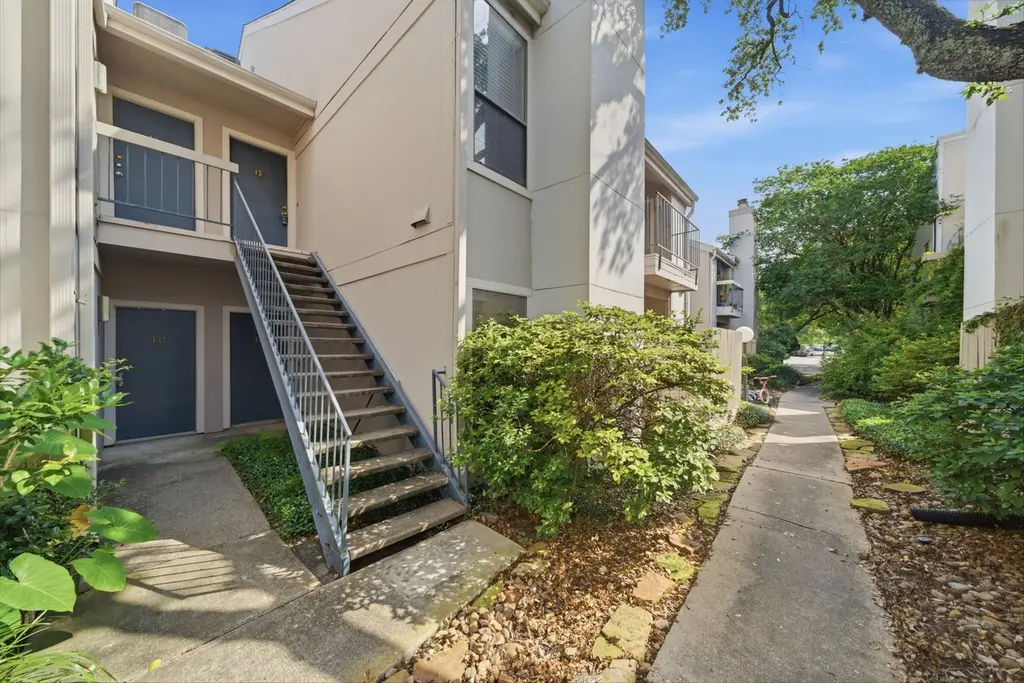
Listing remarks
Welcome to tranquility in the city! This beautiful condo is located in a central location with amenities. The condo features high ceilings, a spacious living area with a wood-burning fireplace, a kitchen with plenty of counterspace and storage, and an abundance of natural light throughout the condo. All appliances included! Briar Green Condos feature a sparkling pool, tennis courts, well-maintained landscaping throughout the complex, gated entry, plus guest parking. Conveniently located near the Houston Medical Center, NRG Stadium and Rice University.
Key facts
- Natural light
- Tennis courts
- Gated entry
Tags
Property features AI
Finance
- Financial info: Lease not considered
- HOA & community: Managed by SBB Community Management; Monthly association fee; Association amenities include clubhouse, picnic area, pool, tennis courts, gated access; Association fee covers clubhouse, common area maintenance, structure maintenance, recreation facilities, sewer and water
Exterior
- Parking: Carport
- Security: Gated community with security gate
- Utilities: Public water; Public sewer
- Home design: Residential property; Single-story building; Built in 1980; Slab foundation; Composition roof; Concrete road frontage
- Construction: Stucco exterior
- Exterior features: Balcony; Exterior storage; Tennis courts; Association pool
Interior
- Kitchen: Dishwasher; Microwave; Refrigerator; Granite counters
- Bedrooms: One bedroom on the second level (13 x 12)
- Flooring: Engineered hardwood; Tile
- Bathrooms: 1 full bathroom
- Heating & cooling: Central heating (gas); Central air conditioning (electric)
- Interior features: Granite counters; Tub with shower; Ceiling fan(s); Wood-burning fireplace (1)
- Laundry & utility: Stacked washer and dryer; Washer; Dryer
Neighborhood map
What this means for you Summary
Snapshot
- This is a 1-bed/1.0-bath condo listed at $90k.
Deal economics
- At list price, monthly cash flow is $-204 ($-2k/yr) — negative.
- To cash-flow at today's rent, offer at most $54k (40.1% below list).
- Meets the 1% rule at list price ($1k rent vs $90k).
- Recommended offer: $54k (40.1% below list) — sets the bar for cash-flow.
Location & tenants
- Location reads 74/100 on livability (#184 in TX, #4,771 nationally) — a middle-class / working-renter tenant base. Strengths: amenities A+, cost of living A+, housing A+; Watch: crime F.
- Houston ISD (urban): math 27% / reading 35% proficiency, ranked #593 of 826 in TX (top 72%) — families likely to look elsewhere, expect single-tenant / working-renter base with shorter leases; 71% free/reduced lunch — lower-income household profile, screen leases tightly.
- Zoned schools: Cullen Middle (math 6% / reading 14%, grade F, #1,641 of 1,662 statewide, top 99%, 324 students, 100% FRL); Bellaire H S (math 45% / reading 62%, grade C-, #428 of 1,632 statewide, top 27%, 3,170 students, 48% FRL) — zoned schools at 74% FRL track the district average.
- Market conditions: Rents soft (-1.6%/yr); 145 active listings in the ZIP; 40 comparable units currently listed for rent nearby; rentals leasing fast (median 8d on market — plan ~1-2 weeks tenant-placement turnaround); solid renter incomes; 29,883 units permitted in Harris County in 2024 (8,621 in 5+ unit buildings).
Forward outlook
- Local home prices are declining (-3.0%/yr); year-one equity from $622 of loan paydown is wiped out by about $3k of value loss. Plan a longer hold.
- Harris County population projected at +47% by 2050 — long-run rental-demand tailwind backs the buy-and-hold thesis.
Negotiation context
- It's been on market 49 days — a 3% lower offer ($87k) is reasonable based on typical stale-listing flexibility.
- 8 sale attempts since 11y ago with the ask held roughly flat each time — persistent listings suggest the price (not the market) is what's stuck; bring a comps-based counter.
- Current owner paid $28k; list at $90k implies a 215% gain — meaningful room to come down on a strong offer.
Risks & watch-outs
- Watch-outs: HOA is 40% of rent.
- Climate carrying-cost: severe wind risk, 99% chance of damaging wind over 30y; extreme-heat days projected 7→24/yr by 2055 (HVAC capex compounding) — expect insurance premiums to compound above CPI over the hold.
Questions for the listing agent
- What do current leases actually rent for vs. the listed asking? Can we see a recent rent roll and the last 12 months of T-12 income?
- It's been on market 49 days. Have you received any prior offers? Is the seller open to a 40% concession, seller financing, or rate buy-down credit?
- What does the HOA fee cover, when was the last increase, and are there any pending special assessments or reserve-fund shortfalls?
- Any open or pending special assessments — roof, HVAC, plumbing, elevator, façade? What's the per-unit balance and payoff schedule, and is the seller paying it off at close or rolling it to the buyer?
- Is there a deadline driving the sale (1031 exchange, divorce, estate, relocation)? That informs how much negotiation room exists.
- Schools are D-rated, which usually means shorter tenancies and higher turnover. Who's the typical renter profile here, and what's been the actual vacancy rate?
- Crime grade is F in this area — have there been break-ins, vandalism, or insurance claims at this property in the last 3 years? What carrier currently insures it and at what premium?
- The area grade is low — what's the realistic commute time and amenity access for the typical tenant pool here? Any planned neighborhood developments (good or bad) we should know about?
- What's the average days-on-market for RENTAL listings here right now (not sales)? A rising rental-DOM trend means longer vacancies and softer asking-rent achievability than the comps imply.
- What's the recent tenant-quality profile in this submarket — average credit score on applications, eviction rate, late-payment / NSF rate, and stable-employment percentage? A property-management company in the area should have these aggregated.
- How much new apartment / multifamily construction is in the pipeline within 1–3 miles? Heavy new supply (>2% of stock underway) typically softens rents 12–24 months out; light construction supports rent growth.
Investment metrics
- 1% rule
- 1.40% ✓
- Cap rate
- 3.57%
- Cash-on-cash
- -9.73%
- DSCR
- 0.57
- GRM
- 6.0
CMA / ARV
- ARV (median comp)
- $108,186
- List price
- $89,900
- Delta
- -16.90%
- Verdict
- UNDERPRICED
- Comps
- 20 within 1.0 mi
Projected returns pro-forma
-3.0% appreciation · 0.0% rent growth · sell at horizon
- IRR
- -41.3%
- Equity multiple
- -0.23×
- Total profit
- $-30,882
- Equity at exit
- $13,404
- IRR
- —
- Equity multiple
- -1.24×
- Total profit
- $-56,363
- Equity at exit
- $7,773
Cash invested: $25,172 (down + closing). Projections, not guarantees.
Landlord ↔ Tenant lean methodology
- Overall (STATE)
- 87 Strongly Landlord-Friendly
- State Texas
- 87 Strongly Landlord-Friendly · R+5
- County
- — inherits STATE
- City
- — inherits STATE
ZIP-level market 77030
- Rents YoY
- -1.6%
- Active inventory
- 145
- Price-to-rent
- 6.0×
Monthly cashflow live
- Estimated rent
- $1,258 high interval (Pro) →
- Mortgage (P&I)
- −$471
- Tax from tax record
- −$187 /mo · $2,245/yr
- Insurance
- −$37
- HOA
- −$502
- Vacancy / Maint / Mgmt
- −$264
- Net cashflow
- $-204
Break-even live
Sensitivity live
| Price | -10% $-153 | -5% $-179 | +0% $-204 | +5% $-230 | +10% $-255 |
|---|---|---|---|---|---|
| Rent | -10% $-304 | -5% $-254 | +0% $-204 | +5% $-154 | +10% $-105 |
| Rate | -1.0pp $-159 | -0.5pp $-181 | base $-204 | +0.5pp $-227 | +1.0pp $-251 |
UW: 25.0% down · 7.5% · 30yr · 1.5% tax · 5.0% vac · 8.0% maint · 8.0% mgmt
Financing live
Cash to close
- Down payment
- $22,475
- Closing costs
- $2,697
- Reserves months
- —
- Total cash needed
- —
Loan-product check · same deal, 3 products live
Conventional
25% down · 7.5% · 30yr
- Down + closing
- —
- Monthly P&I
- —
- Monthly cashflow
- —
- DSCR
- —
- Eligible?
- —
Personal DTI + credit; lowest rate.
DSCR
20% down · 8.5% · 30yr
- Down + closing
- —
- Monthly P&I
- —
- Monthly cashflow
- —
- DSCR
- —
- Eligible?
- —
No personal income docs; deal must DSCR.
Hard money
10% down · 12.0% · 12mo
- Down + closing
- —
- Monthly P&I
- —
- Monthly cashflow
- —
- DSCR
- —
- Eligible?
- —
Short-term bridge; refi at stabilization.
Rent comps 40 comps
| Address | Beds | Baths | Sqft | Rent | $/sqft | DOM | Units | Dist |
|---|---|---|---|---|---|---|---|---|
| 7950 N Stadium Dr Houston, TX | 1.0–2.0 | 1.0 | 696 | $1,100 | $1.58 | 8d | 3 | 0.04mi |
| 1330 Old Spanish Trl Houston, TX | 1.0–2.0 | 1.0 | 726 | $1,050 | $1.45 | 0d | 7 | 0.09mi |
| 1339 Old Spanish Trl Houston, TX | 1.0 | 1.0 | 725 | $1,680 | $2.32 | 44d | 1 | 0.12mi |
| 1333 Old Spanish Trl Unit 1148 Houston, TX | 1.0 | 1.0 | 725 | $1,320 | $1.82 | 0d | 1 | 0.13mi |
| 7900 N Stadium Dr Houston, TX | 1.0 | 1.0 | 696 | $1,250 | $1.80 | 44d | 1 | 0.14mi |
| 1333 Old Spanish Trl Houston, TX | 1.0 | 1.0 | 725 | $1,274 | $1.76 | 13d | 1 | 0.17mi |
| 1333 Old Spanish Trl Unit 324 Houston, TX | 1.0 | 1.0 | 725 | $1,285 | $1.77 | 8d | 1 | 0.19mi |
| 1333 Old Spanish Trl Unit 1354 Houston, TX | 1.0 | 1.0 | 725 | $1,335 | $1.84 | 14d | 1 | 0.19mi |
| 1333 Old Spanish Trl Unit 1348 Houston, TX | 1.0 | 1.0 | 725 | $1,324 | $1.83 | 11d | 1 | 0.19mi |
| 7710 S Main St Unit 7752 Houston, TX | 1.0 | 1.0 | 580 | $769 | $1.33 | 0d | 1 | 0.29mi |
| 7710 S Main St Unit 147 Houston, TX | 1.0 | 1.0 | 580 | $774 | $1.33 | 11d | 1 | 0.33mi |
| 1711 Old Spanish Trl Houston, TX | 1.0–2.0 | 1.0–2.0 | 1078 | $1,500 | $1.39 | 20d | 10 | 0.35mi |
| 7682 Phoenix Dr Houston, TX | 1.0 | 1.0 | 702 | $1,214 | $1.73 | 44d | 1 | 0.44mi |
| 7777 Greenbriar Houston, TX | 1.0–2.0 | 1.0–2.0 | 879 | $1,333 | $1.52 | 0d | 18 | 0.48mi |
| 7600 Kirby Dr Houston, TX | 3.0 | 1.0–2.0 | 931 | $1,576 | $1.69 | 0d | 29 | 0.49mi |
| 8333 Braesmain Dr Houston, TX | 1.0–2.0 | 1.0–2.0 | 1086 | $1,457 | $1.34 | 0d | 29 | 0.49mi |
| 1199 McNee Rd Houston, TX | 1.0 | 1.0 | 643 | $1,100 | $1.71 | 25d | 1 | 0.49mi |
| 8600 Main St Houston, TX | 1.0 | 1.0 | 634 | $1,080 | $1.70 | 44d | 1 | 0.52mi |
| 1819 S Braeswood Blvd Houston, TX | 1.0–2.0 | 1.0–2.0 | 971 | $1,115 | $1.15 | 0d | 28 | 0.54mi |
| 7892 Knight Rd Houston, TX | 3.0 | 1.0–3.0 | 920 | $1,818 | $1.98 | 0d | 14 | 0.55mi |
| 7556 Kirby Dr Houston, TX | 1.0 | 1.0 | 715 | $1,339 | $1.87 | 44d | 1 | 0.57mi |
| 8181 Fannin St Houston, TX | 3.0 | 1.0–2.0 | 802 | $1,327 | $1.65 | 2d | 33 | 0.59mi |
| 1025 Swanson St Unit 211 Houston, TX | 1.0 | 1.0 | 406 | $925 | $2.28 | 25d | 1 | 0.61mi |
| 8700 Main St Houston, TX | 1.0–2.0 | 1.0–2.0 | 954 | $1,401 | $1.47 | 0d | 5 | 0.65mi |
| 7550 Kirby Dr Houston, TX | 1.0–3.0 | 1.0–2.0 | 947 | $1,437 | $1.52 | 0d | 30 | 0.67mi |
| 2222 Maroneal St Houston, TX | 1.0–3.0 | 1.0–2.0 | 951 | $1,303 | $1.37 | 0d | 37 | 0.68mi |
| 2228 Maroneal St Houston, TX | 1.0 | 1.0 | 610 | $1,324 | $2.17 | 44d | 1 | 0.70mi |
| 7000 Greenbriar Dr Houston, TX | 1.0–2.0 | 1.0–2.0 | 829 | $1,200 | $1.45 | 8d | 4 | 0.74mi |
| 1800 El Paseo St Houston, TX | 1.0–2.0 | 1.0–2.0 | 750 | $802 | $1.07 | 0d | 37 | 0.77mi |
| 2111 Holly Hall St Houston, TX | 1.0–3.0 | 1.0–3.0 | 974 | $699 | $0.72 | 0d | 30 | 0.81mi |
| 8282 Cambridge St Houston, TX | 1.0 | 1.0 | 602 | $810 | $1.35 | 14d | 1 | 0.84mi |
| 8282 Cambridge St Unit 8356 Houston, TX | 1.0 | 1.0 | 602 | $810 | $1.35 | 0d | 1 | 0.85mi |
| 8282 Cambridge St Unit 8333 Houston, TX | 1.0 | 1.0 | 602 | $764 | $1.27 | 13d | 1 | 0.85mi |
| 8282 Cambridge St Unit 1162 Houston, TX | 1.0 | 1.0 | 602 | $775 | $1.29 | 8d | 1 | 0.85mi |
| 8282 Cambridge St Unit 8303 Houston, TX | 1.0 | 1.0 | 602 | $815 | $1.35 | 14d | 1 | 0.85mi |
| 2900 N Braeswood Blvd Houston, TX | 1.0–3.0 | 1.0–2.0 | 1193 | $1,301 | $1.09 | 0d | 30 | 0.86mi |
| 2801 Broadmead Dr Unit 321 Houston, TX | 1.0 | 1.0 | 635 | $1,010 | $1.59 | 8d | 1 | 0.88mi |
| 2801 Broadmead Dr Unit 102 Houston, TX | 1.0 | 1.0 | 635 | $1,080 | $1.70 | 44d | 1 | 0.88mi |
| 2801 Broadmead Dr Unit 102 Houston, TX | 1.0 | 1.0 | 632 | $1,077 | $1.70 | 5d | 1 | 0.88mi |
| 2801 Broadmead Dr Unit 2852 Houston, TX | 1.0 | 1.0 | 635 | $1,040 | $1.64 | 44d | 1 | 0.88mi |
HOA detail condo
- Monthly dues
- $502 · $6,024/yr
- Likely covers
- landscapingpoolsecurity
- Assessments
- None detected in remarks — confirm with the listing agent.
Listing history 41 events
-
2026-06-18days on market $89,900 Active 49 DOM
-
2026-06-17days on market $89,900 Active 48 DOM
-
2026-06-16days on market $89,900 Active 47 DOM
-
2026-06-15days on market $89,900 Active 46 DOM
-
2026-06-13pricedays on market $89,900 Active 44 DOM
-
2026-06-10days on market $94,500 Active 40 DOM
-
2026-06-08days on market $94,500 Active 39 DOM
-
2026-06-07days on market $94,500 Active 38 DOM
-
2026-06-04days on market $94,500 Active 35 DOM
-
2026-06-01days on market $94,500 Active 32 DOM
-
2026-05-31days on market $94,500 Active 31 DOM
-
2026-05-01$94,500 Active 557-char remark
-
2026-03-04status Pending
-
2026-02-24status Pending
-
2026-02-23historical
-
2026-02-06price $97,500
-
2026-01-12$99,000 Active
-
2026-01-12historical
-
2026-01-06price $99,000
-
2025-11-17status Active
-
2025-11-07status Pending
-
2025-10-24$106,000 Active
-
2025-10-24historical
-
2025-09-16status Active
-
2025-09-10status Pending
-
2025-08-18price $109,000
-
2025-07-17$113,500 Active
-
2025-07-17historical
-
2025-05-14price $119,500
-
2025-03-27$123,000 Active
-
2025-03-25historical
-
2025-03-24historical
-
2025-03-24historical
-
2015-09-14soldstatus
-
2015-08-25soldstatus Sold
-
2015-08-05status Pending
-
2015-07-30status Option Pending
-
2015-07-04$108,000 Active
-
2007-06-29soldstatus
-
1999-09-10soldstatus $28,500
-
1993-03-01soldstatus $26,000
ⓘ Source: listings_history table (triggers on properties + properties_extension) + one-shot
backfill from property_details.listing_events for pre-trigger history.
Tax reassessment forecast TX · Resets to sale price
- Current annual tax
- $2,245 · $187/mo
- Projected year-2 tax
- $2,245 · $187/mo
- Expected delta
- $0/yr ($0/mo · 0.0%)
ⓘ Screening estimate from a state-policy table — verify with the county assessor before closing.
Climate risk First Street
- Flood 1/10 Low FEMA zone X (shaded) · 0% chance over 30 yrs
- Wildfire 1/10 Low
- Heat 9/10 Extreme 7 d/yr ≥109°F today · 24 d/yr by 30 yrs out
- Wind 9/10 Extreme 99% chance of damaging wind over 30 yrs
- Air quality 2/10 Low 2 unhealthy d/yr today · 2 by 30 yrs out
Nearby sold comps map
Loading sold comps map…
Walkable amenities ~0.75 mi
Loading nearby amenities…
Taxation est. · year 1
- Rental income
- $15,097
- − Mortgage interest
- −$5,036
- − Property taxes
- −$2,245
- − Insurance
- −$450
- − Repairs & maintenance
- −$1,208
- − Management
- −$1,208
- − HOA
- −$6,024
- − Depreciation
- −$2,615
- Taxable loss
- −$3,688
- Est. tax savings @ 24.0%
- +$885
- After-tax cash flow
- $-1,564/yr
For passive investors: Depreciation is non-cash, so a rental often shows a tax loss while cash-flowing — sheltering income. Rental losses are passive: they offset passive income freely, and up to $25,000/yr can offset ordinary (W-2) income if you actively participate and your MAGI is under $100k (phasing out to $0 by $150k); unused losses carry forward. On sale, claimed depreciation is recaptured at up to 25%, and gains may owe capital-gains tax (a 1031 exchange can defer both). Figures are a year-1 estimate at your 24.0% rate — not tax advice; consult a CPA.
Schools (NCES district)
- District
- Houston ISD
- NCES district ID
- 4823640
- Math proficiency
- 27% ▼ -18.00%
- Reading proficiency
- 35% ▼ -6.00%
- Median HH income
- $46,054
- Composite
- 26.63/100
- National rank
- #7173
- State rank
- #593 of 826 in TX
Livability — Houston
- Score
- 74/100
- State rank
- #184
- US rank
- #4771
Category grades
Schools grade is shown separately in the Schools card above.
Census & demographics
- Census place
- Houston, TX
- County
- Harris County · 4,702,590 people
- City population
- 3,226,434
- Metro
- Houston-The Woodlands-Sugar Land, TX
- Population (ZIP)
- 13,380
- Household income
- $77,336
- Rent vs Own
- Severe rent burden
- 1067.0
Population outlook (Harris County) Hauer SSP2
- Today (2025)
- 5,571,493 people
- By 2030
- 6,089,821 · +9.3%
- By 2040
- 7,142,806 · +28.2%
- By 2050
- 8,185,864 · +46.9%
- By 2075
- 10,574,329 · +89.8%
- By 2100
- 12,109,958 · +117.4%
Race, ethnicity, and origin ACS 2023
- Neighborhood character
- Diverse neighborhood (Simpson 0.67)
- Race & ethnicity
- White 50% Asian 23% Black 13% Hispanic / Latino 11% Two or more races 9%
- Hispanic origin (detail)
- Mexican 5%
- Common ancestry
- Romanian 2% Scotch-Irish 2% Italian 2%
- Foreign-born
- 29% · China, Canada, Vietnam
- Languages at home
- 64% English-only · Spanish 11% Chinese 9% Other Indo-European 5%
Political lean MEDSL · Harris
- 2024 margin
- Lean D (+5.5) · D 52.0% · R 46.4% · Other 1.6%
- 2008→2024 swing
- +3.9pp toward D · 2008: 1.6pp · 2024: 5.5pp
- All cycles
- 2024: D+5.5 2020: D+13.3 2016: D+12.4 2012: D+0.1 2008: D+1.6
Not yet ingested
- Civics
- —
Market trends
- HPI YoY
- ▼ -182.09%
- Current HPI
- 196.3094
- Rent YoY
- ▼ -1.62%
- Metro
- Houston-The Woodlands-Sugar Land, TX
- State GDP YoY
- ▲ 3.95%
- F500 in state
- 110
Industry mix (Fortune 500 HQ in TX)
| Industry | F500 HQs | Revenue |
|---|---|---|
| Energy | 16 | $1,198B |
|
||
| Technology | 5 | $198B |
|
||
| Engineering / Construction | 4 | $72B |
|
||
| Energy Services | 3 | $60B |
|
||
| Utilities | 3 | $41B |
|
||
| Healthcare | 2 | $330B |
|
||
Price history
+245.8% since first listed31 events — show timeline
- 2026-06-13 Price Changed $89,900 HARMLS
- 2026-05-01 Listed $94,500 HARMLS
- 2026-03-04 Pending — HARMLS
- 2026-02-24 Pending — HARMLS
- 2026-02-23 Listing Removed — HARMLS
- 2026-02-06 Price Changed $97,500 HARMLS
- 2026-01-12 Listing Removed — HARMLS
- 2026-01-12 Listed $99,000 HARMLS
- 2026-01-06 Price Changed $99,000 HARMLS
- 2025-11-17 Relisted — HARMLS
- 2025-11-07 Pending — HARMLS
- 2025-10-24 Listing Removed — HARMLS
- 2025-10-24 Listed $106,000 HARMLS
- 2025-09-16 Relisted — HARMLS
- 2025-09-10 Pending — HARMLS
- 2025-08-18 Price Changed $109,000 HARMLS
- 2025-07-17 Listing Removed — HARMLS
- 2025-07-17 Listed $113,500 HARMLS
- 2025-05-14 Price Changed $119,500 HARMLS
- 2025-03-27 Listed $123,000 HARMLS
- 2025-03-25 Coming Soon — HARMLS
- 2025-03-24 Coming Soon — HARMLS
- 2025-03-24 Listing Removed — HARMLS
- 2015-09-14 Sold (Public Records) — Public Records
- 2015-08-25 Sold (MLS) — HARMLS
- 2015-08-05 Pending — HARMLS
- 2015-07-30 Pending — HARMLS
- 2015-07-04 Listed $108,000 HARMLS
- 2007-06-29 Sold (Public Records) — Public Records
- 1999-09-10 Sold (Public Records) $28,500 Public Records
- 1993-03-01 Sold (Public Records) $26,000 Public Records
Property tax history
+1.2%/yrLatest (2025): $2,245 · +1.6% YoY. Source: county tax records.
Cash-flow waterfall
monthlySold comps — $/sqft
last 12 mo · ≤1 miLoading sold comps…