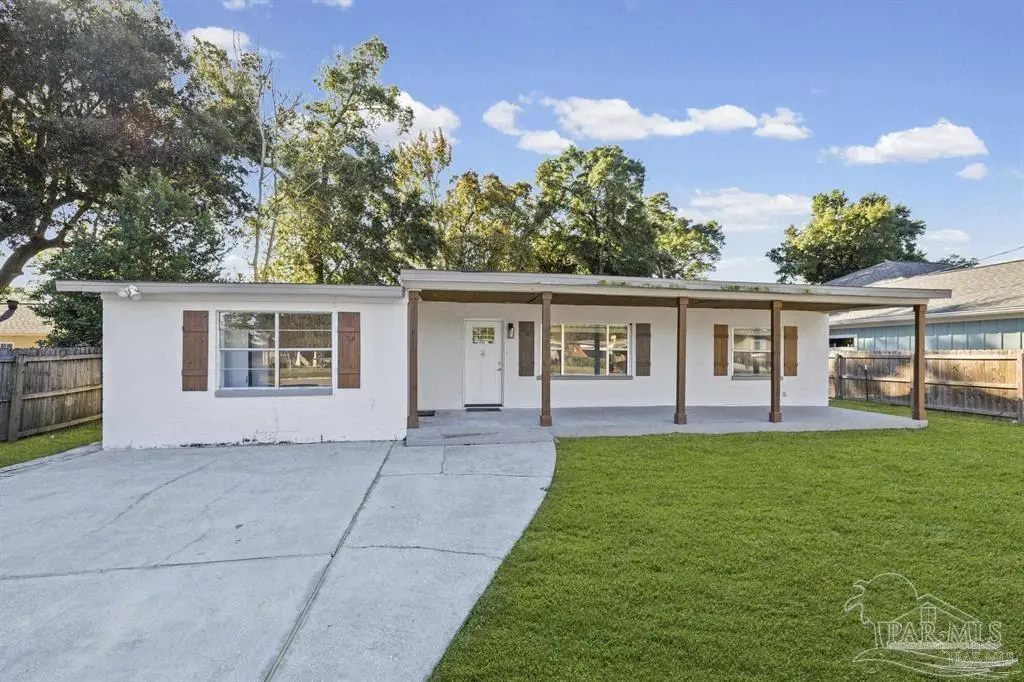
1631 E Hayes St · Pensacola, FL
Flood risk 1/10 · Minimal
- FEMA flood zone
- X (unshaded)
- Chance of flooding over 30 yrs
- 0.0%
- Est. flood insurance / yr
- $507 – $1,088
Fire risk 1/10 · Minimal
- Est. fire insurance / yr
- $947 – $1,759
Heat risk 10/10 · Severe
- Hot days now (above 105°F)
- 7 days/yr
- Hot days in 30 yrs
- 22 days/yr
Wind risk 9/10 · Severe
- Chance of severe wind over 30 yrs
- 99.0%
Air-quality risk 2/10 · Minimal
- Unhealthy air days now
- 0 days/yr
- Unhealthy air days in 30 yrs
- 1 days/yr
Risk factors via First Street. Map © Google.
Why this score? — see what drove the C grade
The composite is a weighted blend of 9 inputs, each scored 0–100. Each bar is that input's sub-score; the figure is the points it added to the 100-point composite (weight × sub-score).
- Cash flow +18.4/30.0
- ARV discount +15.0/15.0
- DSCR +5.8/10.0
- 1% rule +4.8/10.0
- Livability +4.2/5.0
- Schools +3.6/10.0
- Rent growth +3.3/5.0
- Condition / age +2.5/5.0
- Appreciation +0.0/10.0
$299,900
🖨 Deal sheet (PDF) 📄 Offer letter ✓ Due diligence
Listing remarks
Experience the best of Pensacola living at 1631 E Hayes St, a charming 4-bedroom, 2-bathroom brick ranch that perfectly balances classic Southern character with modern versatility. Spanning over 1,780 square feet, this home greets you with a deep, welcoming front porch—the ideal spot for morning coffee or enjoying the coastal breeze. Inside, the spacious floor plan is anchored by a massive 21-foot living room and a bright kitchen-dining combo featuring beautiful original hardwood flooring. While the home is full of character and ready for immediate use, it is a property that invites a little extra love and cosmetic updating to truly shine and reach its full potential. This property of
Key facts
- Front porch
- Private entrance
- Fully fenced lot
Tags
Property features AI
Finance
- Other: Publicly maintained road access
- HOA & community: No homeowners association
Exterior
- Parking: Front entrance parking; Guest parking; Parking lot
- Utilities: Public water; Public sewer; Circuit breakers and copper wiring; Cable available
- Home design: One-story brick residence; Resale property; Not attached to another property; Homesteaded
- Construction: Brick construction; Slab foundation; Built as a one-level home
- Exterior features: Back yard fencing; Front porch; Shingle roof; Central access lot feature
Interior
- Kitchen: Granite counters; Dishwasher; Microwave
- Bedrooms: Master bedroom on the first level, approx. 16.3' x 16.5'; Bedroom on the first level, approx. 9.5' x 13.2'; Bedroom on the first level, approx. 11.7' x 9.6'; Bedroom on the first level, approx. 11.5' x 9.8'
- Flooring: Hardwood flooring
- Bathrooms: 2 full bathrooms
- Heating & cooling: Heat pump heating; Heat pump cooling; Ceiling fans for additional cooling
- Interior features: Baseboards; Ceiling fans; High-speed internet
- Laundry & utility: Washer and dryer included; Washer/Dryer hookups; Electric water heater
Neighborhood map
What this means for you Summary
Snapshot
- This is a 4-bed/1.0-bath single-family listed at $300k.
Deal economics
- At list price, monthly cash flow is $281 ($3k/yr) — positive.
- The deal already cash-flows at list — no discount required.
- To meet the 1% rule (rent ≥ 1% of price), the offer needs to be $295k (1.6% below list).
- Recommended offer: $291k (3.0% below list) — sets the bar for market timing.
- Cap rate 7.4% vs local median 3.6% in Pensacola — top-decile yield for the area; either an underpriced asset or a hidden risk that comps aren't pricing in. Stress-test before assuming the spread holds.
Location & tenants
- Location reads 83/100 on livability (#53 in FL, #924 nationally) — a professional / high-income tenant draw. Strengths: commute A+, cost of living A+, housing A+.
- Escambia (suburban): math 40% / reading 45% proficiency, ranked #56 of 73 in FL (top 77%) — families likely to look elsewhere, expect single-tenant / working-renter base with shorter leases.
- Market conditions: Rents rising (+3.4%/yr); 240 active listings in the ZIP; 12 comparable units currently listed for rent nearby; rentals at typical pace (median 24d on market — plan ~3-4 weeks tenant-placement turnaround); 1,479 units permitted in Escambia County in 2024 (0 in 5+ unit buildings).
- At $2,952/mo this rent would consume 50% of the median local household income ($71k/yr) (locally 948% of renters already pay >50% of income on rent) — very limited rent-growth headroom before tenants either downsize or default.
Forward outlook
- Local home prices are declining (-3.0%/yr); year-one equity from $2k of loan paydown is wiped out by about $9k of value loss. Plan a longer hold.
- Escambia County population projected at +13% by 2050 — modest demand growth; plan on rents tracking national, not racing it.
Negotiation context
- It's been on market 55 days — a 3% lower offer ($291k) is reasonable based on typical stale-listing flexibility.
- 9 sale attempts since 5y ago; this cycle's ask has dropped $30k (9%) from the opening price — seller is motivated, your offer sets the floor, not the list.
- Current owner paid $235k; 28% above their basis — modest negotiation headroom, anchor on the comps not their cost.
Risks & watch-outs
- Watch-outs: built in 1952 — expect roof / HVAC / electrical / plumbing capex.
- Climate carrying-cost: severe wind risk, 99% chance of damaging wind over 30y; extreme-heat days projected 7→22/yr by 2055 (HVAC capex compounding) — expect insurance premiums to compound above CPI over the hold.
Questions for the listing agent
- It's been on market 55 days. Have you received any prior offers? Is the seller open to a 3% concession, seller financing, or rate buy-down credit?
- Built in 1952 — when were the roof, HVAC, electrical panel, plumbing, and water heater last replaced?
- Is there a deadline driving the sale (1031 exchange, divorce, estate, relocation)? That informs how much negotiation room exists.
- What's the average days-on-market for RENTAL listings here right now (not sales)? A rising rental-DOM trend means longer vacancies and softer asking-rent achievability than the comps imply.
- What's the recent tenant-quality profile in this submarket — average credit score on applications, eviction rate, late-payment / NSF rate, and stable-employment percentage? A property-management company in the area should have these aggregated.
- How much new for-sale + rental construction is in the pipeline within 1–3 miles? Heavy new supply typically softens prices + rents 12–24 months out; constrained supply supports both.
Investment metrics
- 1% rule
- 0.98% ✗
- Cap rate
- 7.42%
- Cash-on-cash
- 4.02%
- DSCR
- 1.18
- GRM
- 8.5
CMA / ARV
- ARV (median comp)
- $369,204
- List price
- $299,900
- Delta
- -18.77%
- Verdict
- UNDERPRICED
- Comps
- 20 within 1.0 mi
Show comp detail 12 sales within ~0.75 mi
| Address | Dist | Beds/Ba | Sqft | Sold | Price | $/sf | Match |
|---|---|---|---|---|---|---|---|
| 1631 E Maura St | 0.13mi | 3/2.0 (-1) | 1,642 (-8%) | 1mo | $153,000 | $93 | 71 |
| 1402 E Leonard St | 0.23mi | 3/2.5 (-1) | 1,917 (+8%) | 1mo | $255,000 | $133 | 65 |
| 1149 E Hayes St | 0.46mi | 3/2.5 (-1) | 1,848 (+4%) | 1mo | $475,000 | $257 | 61 |
| 1421 E Texar Dr | 0.31mi | 3/2.5 (-1) | 1,938 (+9%) | 0mo | $544,000 | $281 | 60 |
| 3705 N 12th Ave | 0.66mi | 3/1.0 (-1) | 1,852 (+4%) | 1mo | $335,000 | $181 | 57 |
| 444 Woodbine Dr | 0.57mi | 3/2.0 (-1) | 1,860 (+4%) | 2mo | $475,000 | $255 | 56 |
| 1918 N 17th Ave | 0.74mi | 3/2.0 (-1) | 1,800 (+1%) | 1mo | $275,000 | $153 | 54 |
| 1714 E Hatton St | 0.31mi | 3/2.0 (-1) | 1,555 (-13%) | 2mo | $540,000 | $347 | 54 |
| 1350 E Scott St | 0.44mi | 3/2.5 (-1) | 1,950 (+9%) | 1mo | $625,000 | $321 | 52 |
| 1613 E Yonge St | 0.46mi | 3/2.0 (-1) | 1,579 (-11%) | 3mo | $575,000 | $364 | 48 |
| 1121 E Maxwell St | 0.73mi | 3/2.5 (-1) | 1,716 (-4%) | 4mo | $492,000 | $287 | 46 |
| 1412 E Bobe St | 0.52mi | 3/2.5 (-1) | 2,015 (+13%) | 4mo | $725,000 | $360 | 39 |
Match score weights: distance 35% · size 25% · config 20% · recency 20%. Top-matched comps best support the ARV.
Projected returns pro-forma
-3.0% appreciation · 3.39% rent growth · sell at horizon
- IRR
- -9.6%
- Equity multiple
- 0.65×
- Total profit
- $-29,508
- Equity at exit
- $44,716
- IRR
- 0.4%
- Equity multiple
- 1.03×
- Total profit
- $2,285
- Equity at exit
- $25,930
Cash invested: $83,972 (down + closing). Projections, not guarantees.
Landlord ↔ Tenant lean methodology
- Overall (STATE)
- 87 Strongly Landlord-Friendly
- State Florida
- 87 Strongly Landlord-Friendly · R+3
- County
- — inherits STATE
- City
- — inherits STATE
ZIP-level market 32503
- Rents YoY
- 3.4%
- Active inventory
- 240
- Price-to-rent
- 8.5×
Monthly cashflow live
- Estimated rent
- $2,952 high interval (Pro) →
- Mortgage (P&I)
- −$1,573
- Tax from tax record
- −$353 /mo · $4,241/yr
- Insurance
- −$125
- HOA
- −$0
- Vacancy / Maint / Mgmt
- −$620
- Net cashflow
- $281
Break-even live
Sensitivity live
| Price | -10% $451 | -5% $366 | +0% $281 | +5% $196 | +10% $111 |
|---|---|---|---|---|---|
| Rent | -10% $48 | -5% $164 | +0% $281 | +5% $398 | +10% $514 |
| Rate | -1.0pp $432 | -0.5pp $357 | base $281 | +0.5pp $203 | +1.0pp $124 |
UW: 25.0% down · 7.5% · 30yr · 1.5% tax · 5.0% vac · 8.0% maint · 8.0% mgmt
Financing live
Cash to close
- Down payment
- $74,975
- Closing costs
- $8,997
- Reserves months
- —
- Total cash needed
- —
Loan-product check · same deal, 3 products live
Conventional
25% down · 7.5% · 30yr
- Down + closing
- —
- Monthly P&I
- —
- Monthly cashflow
- —
- DSCR
- —
- Eligible?
- —
Personal DTI + credit; lowest rate.
DSCR
20% down · 8.5% · 30yr
- Down + closing
- —
- Monthly P&I
- —
- Monthly cashflow
- —
- DSCR
- —
- Eligible?
- —
No personal income docs; deal must DSCR.
Hard money
10% down · 12.0% · 12mo
- Down + closing
- —
- Monthly P&I
- —
- Monthly cashflow
- —
- DSCR
- —
- Eligible?
- —
Short-term bridge; refi at stabilization.
Rent comps 12 comps
| Address | Beds | Baths | Sqft | Rent | $/sqft | DOM | Units | Dist |
|---|---|---|---|---|---|---|---|---|
| 3014 Magnolia Ave Pensacola, FL | 3.0 | 2.0 | 1650 | $2,750 | $1.67 | 24d | 1 | 0.23mi |
| 1501 E Cross St Pensacola, FL | 4.0 | 2.0 | 1920 | $3,200 | $1.67 | 24d | 1 | 0.26mi |
| 1501 E Cross St Pensacola, FL | 4.0 | 2.0 | 1920 | $3,000 | $1.56 | 14d | 1 | 0.26mi |
| 1301 E Cross St Pensacola, FL | 3.0 | 2.0 | 2200 | $3,900 | $1.77 | 14d | 1 | 0.38mi |
| 1121 E Maxwell St Pensacola, FL | 3.0 | 2.5 | 1716 | $3,550 | $2.07 | 24d | 1 | 0.70mi |
| 1414 E Mallory St Pensacola, FL | 3.0 | 2.0 | 1323 | $3,400 | $2.57 | 24d | 1 | 0.88mi |
| 3547 Firestone Blvd Pensacola, FL | 4.0 | 2.0 | 2000 | $2,695 | $1.35 | 24d | 1 | 0.92mi |
| 3545 Hopestill Rd Pensacola, FL | 4.0 | 2.0 | 1984 | $2,400 | $1.21 | 24d | 1 | 0.97mi |
| 3791 Maule Rd Pensacola, FL | 4.0 | 3.0 | 2000 | $3,250 | $1.62 | 24d | 1 | 0.98mi |
| 1704 E Lee St Pensacola, FL | 3.0 | 2.0 | 1226 | $2,295 | $1.87 | 24d | 1 | 1.07mi |
| 3019 Keats Dr Pensacola, FL | 4.0 | 2.5 | 2484 | $4,400 | $1.77 | 24d | 1 | 1.25mi |
| 4400 N 9th Ave Pensacola, FL | 3.0 | 1.5 | 1713 | $2,000 | $1.17 | 24d | 1 | 1.36mi |
Listing history 48 events
-
2026-06-18days on market $299,900 Active 55 DOM
-
2026-06-17days on market $299,900 Active 54 DOM
-
2026-06-16days on market $299,900 Active 53 DOM
-
2026-06-15days on market $299,900 Active 52 DOM
-
2026-06-14pricedays on market $299,900 Active 50 DOM
-
2026-06-10days on market $300,000 Active 47 DOM
-
2026-06-09days on market $300,000 Active 46 DOM
-
2026-06-08days on market $300,000 Active 45 DOM
-
2026-06-07days on market $300,000 Active 44 DOM
-
2026-06-03days on market $300,000 Active 40 DOM
-
2026-06-02days on market $300,000 Active 39 DOM
-
2026-06-01days on market $300,000 Active 38 DOM
-
2026-05-31days on market $300,000 Active 37 DOM
-
2026-05-31days on market $300,000 Active 36 DOM
-
2026-05-03price $320,000 1790-char remark
-
2026-04-24$330,000 Active 1790-char remark
-
2026-04-17historical
-
2026-03-15price $330,000
-
2026-02-04price $334,000
-
2026-01-16price $344,000
-
2025-11-14$349,000 Active
-
2023-10-04historical
-
2023-09-12status Active
-
2023-09-12price $325,000
-
2023-08-17status Pending
-
2023-08-07historical Contingent
-
2023-07-20price $347,000
-
2023-06-02status Active
-
2023-06-01historical Contingent
-
2023-05-18price $349,000
-
2023-05-17status Active
-
2023-05-15historical Contingent
-
2023-04-07$359,000 Active
-
2022-10-18historical
-
2022-09-24price $379,000
-
2022-08-31$389,000 Active
-
2021-12-21soldstatus $235,000
-
2021-12-21status Pending
-
2021-12-20soldstatus $235,000 Sold
-
2021-11-25historical Contingent
-
2021-11-04price $230,000
-
2021-10-27price $235,000
-
2021-10-12status Active
-
2021-10-05status Pending
-
2021-09-09$249,000 Active
-
1988-06-01soldstatus $25,000
-
1987-08-01soldstatus $22,400
-
1986-12-01soldstatus $30,100
ⓘ Source: listings_history table (triggers on properties + properties_extension) + one-shot
backfill from property_details.listing_events for pre-trigger history.
Tax reassessment forecast FL · Resets to sale price
- Current annual tax
- $4,241 · $353/mo
- Projected year-2 tax
- $4,241 · $353/mo
- Expected delta
- $0/yr ($0/mo · 0.0%)
ⓘ Screening estimate from a state-policy table — verify with the county assessor before closing.
Climate risk First Street
- Flood 1/10 Low FEMA zone X (unshaded) · 0% chance over 30 yrs
- Wildfire 1/10 Low
- Heat 10/10 Extreme 7 d/yr ≥105°F today · 22 d/yr by 30 yrs out
- Wind 9/10 Extreme 99% chance of damaging wind over 30 yrs
- Air quality 2/10 Low 0 unhealthy d/yr today · 1 by 30 yrs out
Nearby sold comps map
Loading sold comps map…
Walkable amenities ~0.75 mi
Loading nearby amenities…
Taxation est. · year 1
- Rental income
- $35,424
- − Mortgage interest
- −$16,799
- − Property taxes
- −$4,241
- − Insurance
- −$1,500
- − Repairs & maintenance
- −$2,834
- − Management
- −$2,834
- − Depreciation
- −$8,724
- Taxable loss
- −$1,508
- Est. tax savings @ 24.0%
- +$362
- After-tax cash flow
- $3,734/yr
For passive investors: Depreciation is non-cash, so a rental often shows a tax loss while cash-flowing — sheltering income. Rental losses are passive: they offset passive income freely, and up to $25,000/yr can offset ordinary (W-2) income if you actively participate and your MAGI is under $100k (phasing out to $0 by $150k); unused losses carry forward. On sale, claimed depreciation is recaptured at up to 25%, and gains may owe capital-gains tax (a 1031 exchange can defer both). Figures are a year-1 estimate at your 24.0% rate — not tax advice; consult a CPA.
Schools (NCES district)
- District
- Escambia
- NCES district ID
- 1200510
- Math proficiency
- 40% ▼ -9.00%
- Reading proficiency
- 45% ▼ -4.00%
- Median HH income
- $44,649
- Composite
- 36.04/100
- National rank
- #4773
- State rank
- #56 of 73 in FL
Livability — Pensacola
- Score
- 83/100
- State rank
- #53
- US rank
- #924
Category grades
Schools grade is shown separately in the Schools card above.
Census & demographics
- Census place
- Pensacola, FL
- County
- Escambia County · 301,722 people
- City population
- 237,636
- Metro
- Pensacola-Ferry Pass-Brent, FL
- Population (ZIP)
- 33,559
- Household income
- $71,411
- Rent vs Own
- Severe rent burden
- 948.0
Population outlook (Escambia County) Hauer SSP2
- Today (2025)
- 334,637 people
- By 2030
- 345,779 · +3.3%
- By 2040
- 364,828 · +9.0%
- By 2050
- 378,514 · +13.1%
- By 2075
- 403,220 · +20.5%
- By 2100
- 386,125 · +15.4%
Race, ethnicity, and origin ACS 2023
- Neighborhood character
- Predominantly White (68%)
- Race & ethnicity
- White 68% Black 20% Two or more races 6% Hispanic / Latino 5% Asian 2%
- Common ancestry
- Lithuanian 3% Italian 2% Romanian 2%
- Foreign-born
- 5% · Canada, China
- Languages at home
- 93% English-only · Spanish 3% Arabic 1% Tagalog/Filipino 1%
Political lean MEDSL · Escambia
- 2024 margin
- R (+19.5) · D 39.7% · R 59.2% · Other 1.1%
- 2008→2024 swing
- -0.2pp no change · 2008: -19.3pp · 2024: -19.5pp
- All cycles
- 2024: R+19.5 2020: R+15.1 2016: R+20.6 2012: R+20.6 2008: R+19.3
Not yet ingested
- Civics
- —
Market trends
- HPI YoY
- ▼ -300.02%
- Current HPI
- 294.4873
- Rent YoY
- ▲ 3.39%
- Metro
- Pensacola-Ferry Pass-Brent, FL
- State GDP YoY
- ▲ 3.28%
- F500 in state
- 36
Industry mix (Fortune 500 HQ in FL)
| Industry | F500 HQs | Revenue |
|---|---|---|
| Industrial Technology | 2 | $29B |
|
||
| Insurance | 2 | $17B |
|
||
| Retail | 1 | $60B |
|
||
| Technology Distribution | 1 | $58B |
|
||
| Homebuilding | 1 | $35B |
|
||
| Technology Manufacturing | 1 | $35B |
|
||
Price history
+896.3% since first listed36 events — show timeline
- 2026-06-10 Price Changed $299,900 PARMLS
- 2026-05-26 Price Changed $300,000 PARMLS
- 2026-05-03 Price Changed $320,000 PARMLS
- 2026-04-24 Listed $330,000 PARMLS
- 2026-04-17 Listing Removed — PARMLS
- 2026-03-15 Price Changed $330,000 PARMLS
- 2026-02-04 Price Changed $334,000 PARMLS
- 2026-01-16 Price Changed $344,000 PARMLS
- 2025-11-14 Listed $349,000 PARMLS
- 2023-10-04 Listing Removed — PARMLS
- 2023-09-12 Relisted — PARMLS
- 2023-09-12 Price Changed $325,000 PARMLS
- 2023-08-17 Pending — PARMLS
- 2023-08-07 Contingent — PARMLS
- 2023-07-20 Price Changed $347,000 PARMLS
- 2023-06-02 Relisted — PARMLS
- 2023-06-01 Contingent — PARMLS
- 2023-05-18 Price Changed $349,000 PARMLS
- 2023-05-17 Relisted — PARMLS
- 2023-05-15 Contingent — PARMLS
- 2023-04-07 Listed $359,000 PARMLS
- 2022-10-18 Listing Removed — PARMLS
- 2022-09-24 Price Changed $379,000 PARMLS
- 2022-08-31 Listed $389,000 PARMLS
- 2021-12-21 Sold (Public Records) $235,000 Public Records
- 2021-12-21 Pending — PARMLS
- 2021-12-20 Sold (MLS) $235,000 PARMLS
- 2021-11-25 Contingent — PARMLS
- 2021-11-04 Price Changed $230,000 PARMLS
- 2021-10-27 Price Changed $235,000 PARMLS
- 2021-10-12 Relisted — PARMLS
- 2021-10-05 Pending — PARMLS
- 2021-09-09 Listed $249,000 PARMLS
- 1988-06-01 Sold (Public Records) $25,000 Public Records
- 1987-08-01 Sold (Public Records) $22,400 Public Records
- 1986-12-01 Sold (Public Records) $30,100 Public Records
Property tax history
+24.7%/yrLatest (2025): $4,241 · +15.9% YoY. Source: county tax records.
Cash-flow waterfall
monthlySold comps — $/sqft
last 12 mo · ≤1 miLoading sold comps…