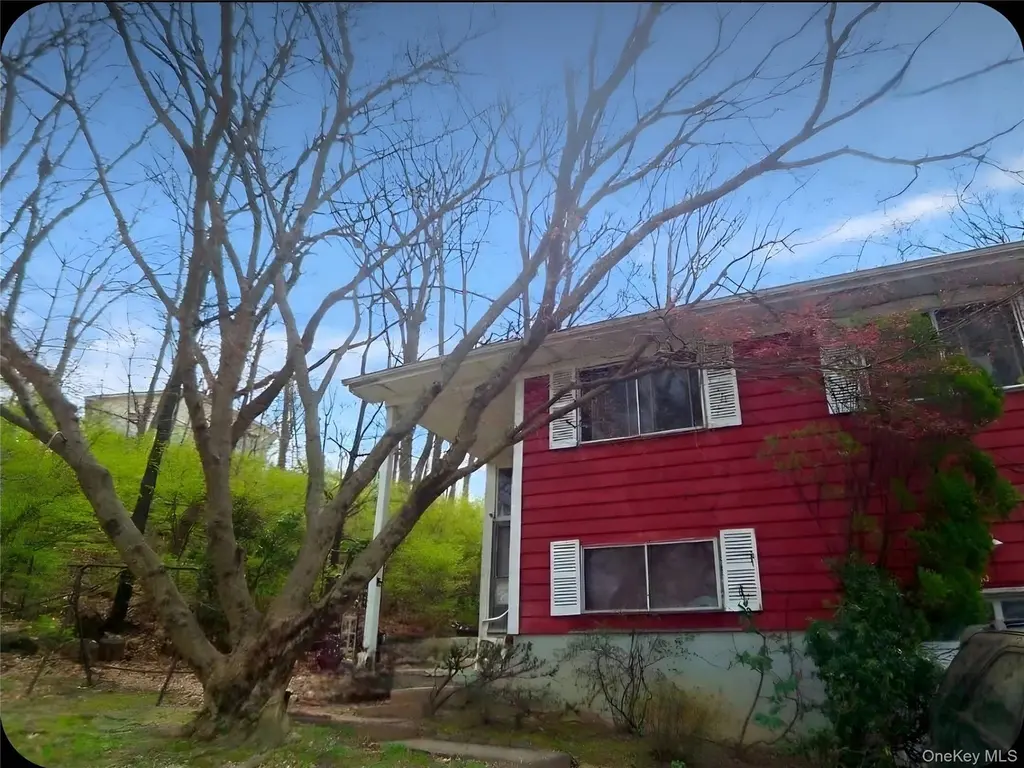
10 Teramar Way · Fairview, NY
Flood risk 1/10 · Minimal
- FEMA flood zone
- X (unshaded)
- Chance of flooding over 30 yrs
- 0.0%
- Est. flood insurance / yr
- $473 – $860
Fire risk 2/10 · Minimal
- Est. fire insurance / yr
- $691 – $1,283
Heat risk 5/10 · Moderate
- Hot days now (above 98°F)
- 7 days/yr
- Hot days in 30 yrs
- 15 days/yr
Wind risk 6/10 · Moderate
- Chance of severe wind over 30 yrs
- 27.0%
Air-quality risk 4/10 · Minor
- Unhealthy air days now
- 3 days/yr
- Unhealthy air days in 30 yrs
- 5 days/yr
Risk factors via First Street. Map © Google.
Why this score? — see what drove the C+ grade
The composite is a weighted blend of 9 inputs, each scored 0–100. Each bar is that input's sub-score; the figure is the points it added to the 100-point composite (weight × sub-score).
- Cash flow +21.8/30.0
- ARV discount +15.0/15.0
- DSCR +7.0/10.0
- 1% rule +6.8/10.0
- Schools +4.9/10.0
- Livability +4.0/5.0
- Rent growth +2.5/5.0
- Condition / age +2.5/5.0
- Appreciation +0.0/10.0
$549,900
🖨 Deal sheet 📄 Offer letter ✓ Due diligence
Listing remarks MLS
Live triumphant at the top of the hill.* This 5 bedroom, 2 bathroom split-level on a quiet White Plains cul-de-sac is a blank canvas ready for your vision and your special touches. Park in the garage, step inside, and feel the calm take over as light fills the spacious living room made for real life, from slow mornings to big celebrations. Upstairs, three bedrooms give you room to rest and reset, while the lower level flexes into the guest suite or rec space you have been wanting. Take the quiet to the yard or keep it inside. Either way, this is serenity you can feel. This home seeks the right visionary to bring it to life. Come explore it, picture your life here, and just live.
Key facts
- 0.46 acre lot
- Garage
- Built 1950
Neighborhood map
What this means for you Summary
Snapshot
- This is a 5-bed/2.0-bath single-family listed at $550k.
Deal economics
- At list price, monthly cash flow is $853 ($10k/yr) — positive.
- The deal already cash-flows at list — no discount required.
- Meets the 1% rule at list price ($7k rent vs $550k).
- Recommended offer: $517k (6.0% below list) — sets the bar for market timing.
- Cap rate 8.2% vs local median 3.7% in Fairview — top-decile yield for the area; either an underpriced asset or a hidden risk that comps aren't pricing in. Stress-test before assuming the spread holds.
Location & tenants
- Location reads 79/100 on livability (#149 in NY, #2,302 nationally) — a middle-class / working-renter tenant base. Strengths: commute A+, employment A+, housing A+; Watch: cost of living C-, schools F, amenities F.
- Greenburgh Central School District (suburban): math 51% / reading 55% proficiency, ranked #267 of 590 in NY (top 45%) — acceptable for families but not a draw, mixed tenant base, ~2y average lease.
- Market conditions: 40 active listings in the ZIP; 2 comparable units currently listed for rent nearby; 954 units permitted in Westchester County in 2024 (649 in 5+ unit buildings).
Forward outlook
- Local home prices are declining (-3.0%/yr); year-one equity from $4k of loan paydown is wiped out by about $16k of value loss. Plan a longer hold.
- Westchester County population projected at +10% by 2050 — modest demand growth; plan on rents tracking national, not racing it.
Negotiation context
- It's been on market 64 days — a 6% lower offer ($517k) is reasonable based on typical stale-listing flexibility.
Risks & watch-outs
- Watch-outs: property tax is 2.6% of price; built in 1950 — expect roof / HVAC / electrical / plumbing capex.
- Climate carrying-cost: major wind risk, 27% chance of damaging wind over 30y; extreme-heat days projected 7→15/yr by 2055 (HVAC capex compounding) — expect insurance premiums to compound above CPI over the hold.
Questions for the listing agent
- It's been on market 64 days. Have you received any prior offers? Is the seller open to a 6% concession, seller financing, or rate buy-down credit?
- Built in 1950 — when were the roof, HVAC, electrical panel, plumbing, and water heater last replaced?
- Property tax is high relative to price — has the assessment been appealed recently, and will the sale trigger a re-assessment?
- Why hasn't it sold? Are there any deal-killer items the seller is aware of (foundation, flood, title, zoning, code violations)?
- Is there a deadline driving the sale (1031 exchange, divorce, estate, relocation)? That informs how much negotiation room exists.
- Schools are F-rated, which usually means shorter tenancies and higher turnover. Who's the typical renter profile here, and what's been the actual vacancy rate?
- What's the average days-on-market for RENTAL listings here right now (not sales)? A rising rental-DOM trend means longer vacancies and softer asking-rent achievability than the comps imply.
- What's the recent tenant-quality profile in this submarket — average credit score on applications, eviction rate, late-payment / NSF rate, and stable-employment percentage? A property-management company in the area should have these aggregated.
- How much new for-sale + rental construction is in the pipeline within 1–3 miles? Heavy new supply typically softens prices + rents 12–24 months out; constrained supply supports both.
Investment metrics
- 1% rule
- 1.18% ✓
- Cap rate
- 8.15%
- Cash-on-cash
- 6.65%
- DSCR
- 1.30
- GRM
- 7.0
CMA / ARV
- ARV (median comp)
- $800,131
- List price
- $549,900
- Delta
- -31.27%
- Verdict
- UNDERPRICED
- Comps
- 20 within 1.0 mi
Show comp detail 10 sales within ~0.75 mi
| Address | Dist | Beds/Ba | Sqft | Sold | Price | $/sf | Match |
|---|---|---|---|---|---|---|---|
| 25 Midway Rd | 0.14mi | 4/2.5 (-1) | 1,689 (-6%) | 5mo | $755,000 | $447 | 72 |
| 110 Mclean Ave | 0.43mi | 4/2.0 (-1) | 1,800 (0%) | 10mo | $663,000 | $368 | 67 |
| 252 County Center Rd | 0.72mi | 5/3.5 | 1,822 (+1%) | 1mo | $810,000 | $445 | 58 |
| 106 Robertson Ave | 0.56mi | 4/2.5 (-1) | 1,745 (-3%) | 17mo | $745,000 | $427 | 48 |
| 262 Battle Ave | 0.68mi | 5/2.0 | 1,931 (+7%) | 12mo | $730,000 | $378 | 46 |
| 60 County Center Rd | 0.53mi | 4/3.0 (-1) | 1,768 (-2%) | 22mo | $690,000 | $390 | 45 |
| 97 Trenton Ave | 0.75mi | 4/1.5 (-1) | 1,813 (+1%) | 19mo | $720,000 | $397 | 41 |
| 183 Pinewood Rd | 0.71mi | 4/2.0 (-1) | 1,899 (+6%) | 18mo | $871,000 | $459 | 38 |
| 61 Primrose St | 0.65mi | 6/2.0 (+1) | 1,601 (-11%) | 12mo | $674,650 | $421 | 36 |
| 217 Warren Ave | 0.74mi | 4/2.0 (-1) | 2,000 (+11%) | 12mo | $685,000 | $343 | 32 |
Match score weights: distance 35% · size 25% · config 20% · recency 20%. Top-matched comps best support the ARV.
Projected returns pro-forma
-3.0% appreciation · 3.0% rent growth · sell at horizon
- IRR
- -6.0%
- Equity multiple
- 0.78×
- Total profit
- $-34,366
- Equity at exit
- $81,992
- IRR
- 3.7%
- Equity multiple
- 1.27×
- Total profit
- $41,667
- Equity at exit
- $47,545
Cash invested: $153,972 (down + closing). Projections, not guarantees.
Landlord ↔ Tenant lean methodology
- Overall (STATE)
- 15 Strongly Tenant-Friendly
- State New York
- 15 Strongly Tenant-Friendly · D+10
- County
- — inherits STATE
- City
- — inherits STATE
ZIP-level market 10607
- Active inventory
- 40
- Price-to-rent
- 7.0×
Monthly cashflow live
- Estimated rent
- $6,508 medium interval (Pro) →
- Mortgage (P&I)
- −$2,884
- Tax from tax record
- −$1,175 /mo · $14,099/yr
- Insurance
- −$229
- HOA
- −$0
- Vacancy / Maint / Mgmt
- −$1,367
- Net cashflow
- $853
Break-even live
UW: 25.0% down · 7.5% · 30yr · 1.5% tax · 5.0% vac · 8.0% maint · 8.0% mgmt
Financing live
Cash to close
- Down payment
- $137,475
- Closing costs
- $16,497
- Reserves months
- —
- Total cash needed
- —
Loan-product check · same deal, 3 products live
Conventional
25% down · 7.5% · 30yr
- Down + closing
- —
- Monthly P&I
- —
- Monthly cashflow
- —
- DSCR
- —
- Eligible?
- —
Personal DTI + credit; lowest rate.
DSCR
20% down · 8.5% · 30yr
- Down + closing
- —
- Monthly P&I
- —
- Monthly cashflow
- —
- DSCR
- —
- Eligible?
- —
No personal income docs; deal must DSCR.
Hard money
10% down · 12.0% · 12mo
- Down + closing
- —
- Monthly P&I
- —
- Monthly cashflow
- —
- DSCR
- —
- Eligible?
- —
Short-term bridge; refi at stabilization.
Rent comps 2 comps
| Address | Beds | Baths | Sqft | Rent | $/sqft | DOM | Units | Dist |
|---|---|---|---|---|---|---|---|---|
| 12 Francine Ct White Plains, NY | 4.0 | 2.5 | 2000 | $6,800 | $3.40 | 15d | 1 | 0.95mi |
| 82 Quinby Ave White Plains, NY | 4.0 | 1.5 | 2350 | $6,000 | $2.55 | 1d | 1 | 1.41mi |
Listing history 15 events
-
2026-06-18days on market $549,900 Active 64 DOM
-
2026-06-17days on market $549,900 Active 63 DOM
-
2026-06-16days on market $549,900 Active 62 DOM
-
2026-06-15days on market $549,900 Active 61 DOM
-
2026-06-13days on market $549,900 Active 59 DOM
-
2026-06-13days on market $549,900 Active 58 DOM
-
2026-06-09days on market $549,900 Active 55 DOM
-
2026-06-08days on market $549,900 Active 54 DOM
-
2026-06-07days on market $549,900 Active 53 DOM
-
2026-06-04days on market $549,900 Active 50 DOM
-
2026-06-03days on market $549,900 Active 49 DOM
-
2026-06-02days on market $549,900 Active 48 DOM
-
2026-06-01days on market $549,900 Active 47 DOM
-
2026-05-31days on market $549,900 Active 46 DOM
-
2026-04-15$549,900 Active 687-char remark
Show marketing remark (687 chars)
Live triumphant at the top of the hill.* This 5 bedroom, 2 bathroom split-level on a quiet White Plains cul-de-sac is a blank canvas ready for your vision and your special touches. Park in the garage, step inside, and feel the calm take over as light fills the spacious living room made for real life, from slow mornings to big celebrations. Upstairs, three bedrooms give you room to rest and reset, while the lower level flexes into the guest suite or rec space you have been wanting. Take the quiet to the yard or keep it inside. Either way, this is serenity you can feel. This home seeks the right visionary to bring it to life. Come explore it, picture your life here, and just live.
ⓘ Source: listings_history table (triggers on properties + properties_extension) + one-shot
backfill from property_details.listing_events for pre-trigger history.
Tax reassessment forecast NY · Partial reset (capped growth)
- Current annual tax
- $14,099 · $1,175/mo
- Projected year-2 tax
- $14,099 · $1,175/mo
- Expected delta
- $0/yr ($0/mo · 0.0%)
ⓘ Screening estimate from a state-policy table — verify with the county assessor before closing.
Climate risk First Street
- Flood 1/10 Low FEMA zone X (unshaded) · 0% chance over 30 yrs
- Wildfire 2/10 Low
- Heat 5/10 Major 7 d/yr ≥98°F today · 15 d/yr by 30 yrs out
- Wind 6/10 Major 27% chance of damaging wind over 30 yrs
- Air quality 4/10 Moderate 3 unhealthy d/yr today · 5 by 30 yrs out
Nearby sold comps map
Loading sold comps map…
Walkable amenities ~0.75 mi
Loading nearby amenities…
Taxation est. · year 1
- Rental income
- $78,091
- − Mortgage interest
- −$30,803
- − Property taxes
- −$14,099
- − Insurance
- −$2,750
- − Repairs & maintenance
- −$6,247
- − Management
- −$6,247
- − Depreciation
- −$15,997
- Taxable income
- $1,948
- Est. tax owed @ 24.0%
- −$468
- After-tax cash flow
- $9,771/yr
For passive investors: Depreciation is non-cash, so a rental often shows a tax loss while cash-flowing — sheltering income. Rental losses are passive: they offset passive income freely, and up to $25,000/yr can offset ordinary (W-2) income if you actively participate and your MAGI is under $100k (phasing out to $0 by $150k); unused losses carry forward. On sale, claimed depreciation is recaptured at up to 25%, and gains may owe capital-gains tax (a 1031 exchange can defer both). Figures are a year-1 estimate at your 24.0% rate — not tax advice; consult a CPA.
Schools (NCES district)
- District
- Greenburgh Central School District
- NCES district ID
- 3612720
- Math proficiency
- 51% ▲ 4.00%
- Reading proficiency
- 55% ▲ 5.00%
- Median HH income
- $93,626
- Composite
- 49.43/100
- National rank
- #2005
- State rank
- #267 of 590 in NY
Livability — Fairview
- Score
- 79/100
- State rank
- #149
- US rank
- #2302
Category grades
Schools grade is shown separately in the Schools card above.
Census & demographics
- Population (ZIP)
- 6,222
Population outlook (Westchester County) Hauer SSP2
- Today (2025)
- 1,028,035 people
- By 2030
- 1,051,636 · +2.3%
- By 2040
- 1,098,520 · +6.9%
- By 2050
- 1,136,044 · +10.5%
- By 2075
- 1,196,925 · +16.4%
- By 2100
- 1,175,147 · +14.3%
Race, ethnicity, and origin ACS 2023
- Neighborhood character
- Highly diverse neighborhood (Simpson 0.74)
- Race & ethnicity
- Black 30% White 29% Hispanic / Latino 27% Asian 12% Two or more races 7%
- Hispanic origin (detail)
- Mexican 4% Puerto Rican 8% Dominican 2%
- Common ancestry
- Romanian 3% Scotch-Irish 3% Hispanic 2%
- Foreign-born
- 30% · Canada, South Korea, Jamaica
- Languages at home
- 60% English-only · Spanish 23% Other Indo-European 6% Korean 3%
Political lean MEDSL · Westchester
- 2024 margin
- Strong D (+26.3) · D 63.1% · R 36.9%
- 2008→2024 swing
- -1.3pp toward R · 2008: 27.6pp · 2024: 26.3pp
- All cycles
- 2024: D+26.3 2020: D+36.3 2016: D+32.8 2012: D+22.2 2008: D+27.6
Not yet ingested
- Civics
- —
Market trends
- HPI YoY
- ▼ -357.34%
- Current HPI
- 344.8189
- Rent YoY
- —
- Metro
- —
- State GDP YoY
- ▲ 2.60%
- F500 in state
- 92
Industry mix (Fortune 500 HQ in NY)
| Industry | F500 HQs | Revenue |
|---|---|---|
| Financial Services | 10 | $950B |
|
||
| Consumer Goods | 9 | $162B |
|
||
| Insurance | 4 | $225B |
|
||
| Telecommunications | 2 | $144B |
|
||
| Pharmaceuticals | 2 | $112B |
|
||
| Media / Entertainment | 2 | $69B |
|
||
Price history
1 event — show timeline
- 2026-04-15 Listed $549,900 OneKey® MLS as Distributed by MLS Grid
Property tax history
+8.8%/yrLatest (2025): $14,099 · +11.4% YoY. Source: county tax records.
Cash-flow waterfall
monthlySold comps — $/sqft
last 12 mo · ≤1 miLoading sold comps…