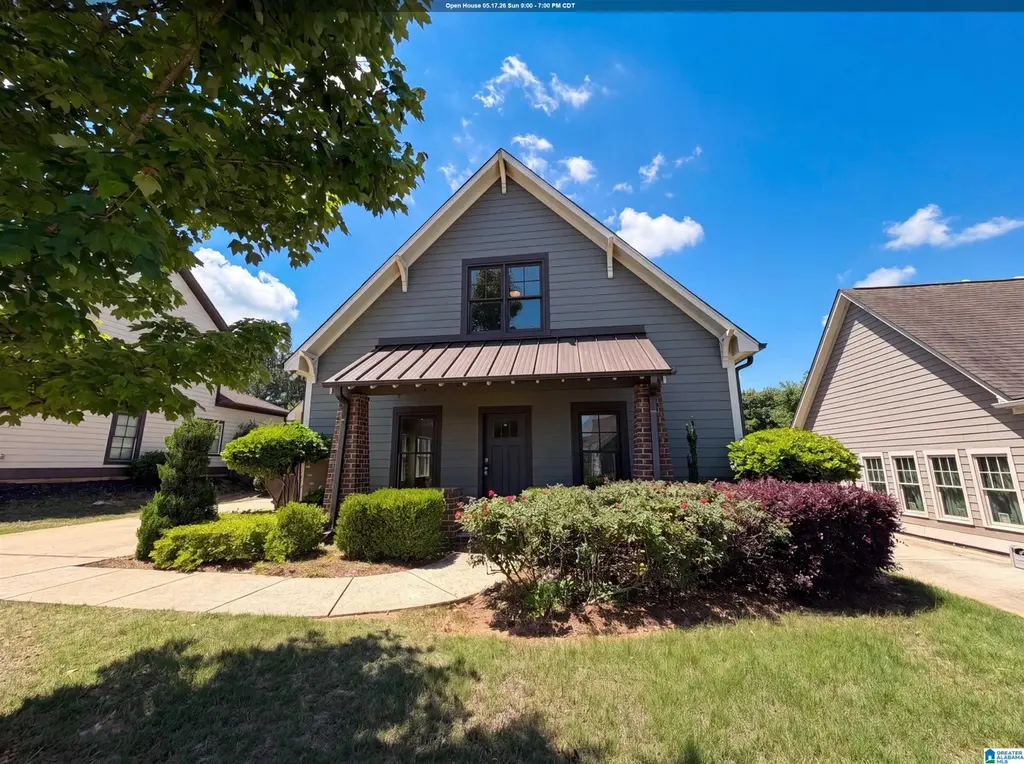
5257 Meadow Ridge Trl · McCalla, AL
Flood risk 1/10 · Minimal
- FEMA flood zone
- X (unshaded)
- Chance of flooding over 30 yrs
- 0.0%
- Est. flood insurance / yr
- $507 – $1,088
Fire risk 4/10 · Minor
- Est. fire insurance / yr
- $916 – $1,700
Heat risk 7/10 · Major
- Hot days now (above 108°F)
- 7 days/yr
- Hot days in 30 yrs
- 19 days/yr
Wind risk 6/10 · Moderate
- Chance of severe wind over 30 yrs
- 43.0%
Air-quality risk 2/10 · Minimal
- Unhealthy air days now
- 2 days/yr
- Unhealthy air days in 30 yrs
- 2 days/yr
Risk factors via First Street. Map © Google.
Why this score? — see what drove the F grade
The composite is a weighted blend of 9 inputs, each scored 0–100. Each bar is that input's sub-score; the figure is the points it added to the 100-point composite (weight × sub-score).
- ARV discount +11.7/15.0
- Cash flow +7.8/30.0
- Rent growth +5.0/5.0
- Livability +2.5/5.0
- Condition / age +2.5/5.0
- DSCR +1.9/10.0
- Schools +1.8/10.0
- 1% rule +1.5/10.0
- Appreciation +0.0/10.0
$320,000
🖨 Deal sheet (PDF) 📄 Offer letter ✓ Due diligence
Listing remarks
Meet 5257 Meadow Ridge Trl, a residence built for everyday comfort and functional use. The kitchen features all stainless steel appliances, an accent backsplash, and a central island. A central fireplace establishes a welcoming ambiance. The primary bathroom includes double sinks, plus a separate tub and shower. A covered patio leads to a fully fenced in backyard. Discover modern ease and outdoor tranquility in this property. Included 100-Day Home Warranty with buyer activation
Key facts
- Central island
- Double sinks
- Central fireplace
Tags
Property features AI
Finance
- Other: Subdivision: Rosser Farms
- HOA & community: Annual association fee of $525 (fees include: other)
Exterior
- Parking: Attached front-entry 2-car garage
- Utilities: Public water; Connected sewer; Gas water heater; Underground utilities; Internet availability unknown
- Home design: Existing single-family residence; Slab foundation
- Construction: Brick over foundation and other siding
- Exterior features: Community in-ground pool; No waterfront, no deck, no patio, no garden/patio
Interior
- Kitchen: Dishwasher (built-in); Built-in microwave; Electric stove; Stone countertops
- Bedrooms: Main level bedrooms and upstairs bedrooms (multiple bedrooms across levels)
- Flooring: Hardwood; Carpet; Tile
- Bathrooms: Two full bathrooms; One half bathroom; Separate shower
- Heating & cooling: Gas heating; Central electric air conditioning
- Interior features: 9-foot-plus ceilings with crown molding and smooth finish; One gas fireplace in the den with tile surround; Stone kitchen countertops; Has a walk-in attic
- Laundry & utility: Main-level laundry; Washer hookup; Electric dryer hookup
Neighborhood map
What this means for you Summary
Snapshot
- This is a 4-bed/2.0-bath single-family listed at $320k.
Deal economics
- At list price, monthly cash flow is $-353 ($-4k/yr) — negative.
- To cash-flow at today's rent, offer at most $258k (19.5% below list).
- To meet the 1% rule (rent ≥ 1% of price), the offer needs to be $208k (35.0% below list).
- Recommended offer: $208k (35.0% below list) — sets the bar for 1% rule.
Location & tenants
- Location reads: area grade F — affects rentability + tenant quality, not the cash-flow math above.
- Jefferson County (suburban): math 9% / reading 32% proficiency, ranked #104 of 129 in AL (top 81%) — low school quality limits family demand, transient renter base, plan for 1-2y turnover.
- Zoned schools: Mcadory Elementary School (math 14% / reading 40%, grade F, #392 of 627 statewide, top 65%, 667 students, 61% FRL); Mcadory Middle School (math 2% / reading 33%, grade F, #199 of 257 statewide, top 77%, 854 students, 74% FRL); Mcadory High School (math 8% / reading 17%, grade F, #237 of 305 statewide, top 78%, 1,162 students, 72% FRL) — zoned schools average 69% FRL vs 49% district-wide (21 pts higher); higher-poverty schools than district average — tighter screening recommended.
- Market conditions: Rents rising fast (+14.8%/yr); 312 active listings in the ZIP; 1 comparable units currently listed for rent nearby; solid renter incomes; 2,114 units permitted in Jefferson County in 2024 (556 in 5+ unit buildings).
- This rent runs 31% of the median local income ($82k/yr) — at the standard rent-burdened threshold; future hikes will face affordability resistance.
Forward outlook
- Local home prices are declining (-3.0%/yr); year-one equity from $2k of loan paydown is wiped out by about $10k of value loss. Plan a longer hold.
- Jefferson County population projected to shrink 4% by 2050 — rents likely to lag national; underwrite the cash flow, not the appreciation.
Negotiation context
- Only 11 days on market — expect competitive offers; lowballing is unlikely to land.
Risks & watch-outs
- Climate carrying-cost: major wind risk, 43% chance of damaging wind over 30y; extreme-heat days projected 7→19/yr by 2055 (HVAC capex compounding) — expect insurance premiums to compound above CPI over the hold.
Questions for the listing agent
- What do current leases actually rent for vs. the listed asking? Can we see a recent rent roll and the last 12 months of T-12 income?
- What does the HOA fee cover, when was the last increase, and are there any pending special assessments or reserve-fund shortfalls?
- Is there a deadline driving the sale (1031 exchange, divorce, estate, relocation)? That informs how much negotiation room exists.
- The area grade is low — what's the realistic commute time and amenity access for the typical tenant pool here? Any planned neighborhood developments (good or bad) we should know about?
- What's the average days-on-market for RENTAL listings here right now (not sales)? A rising rental-DOM trend means longer vacancies and softer asking-rent achievability than the comps imply.
- What's the recent tenant-quality profile in this submarket — average credit score on applications, eviction rate, late-payment / NSF rate, and stable-employment percentage? A property-management company in the area should have these aggregated.
- How much new for-sale + rental construction is in the pipeline within 1–3 miles? Heavy new supply typically softens prices + rents 12–24 months out; constrained supply supports both.
Investment metrics
- 1% rule
- 0.65% ✗
- Cap rate
- 4.97%
- Cash-on-cash
- -4.72%
- DSCR
- 0.79
- GRM
- 12.8
CMA / ARV
- ARV (median comp)
- $352,626
- List price
- $320,000
- Delta
- -9.25%
- Verdict
- FAIR
- Comps
- 20 within 1.0 mi
Show comp detail 9 sales within ~0.75 mi
| Address | Dist | Beds/Ba | Sqft | Sold | Price | $/sf | Match |
|---|---|---|---|---|---|---|---|
| 5709 Rockdale Rd | 0.49mi | 3/1.0 (-1) | 1,184 (-0%) | 1mo | $125,000 | $106 | 66 |
| 1633 Eastern Valley Rd | 0.57mi | 3/2.0 (-1) | 1,176 (-1%) | 8mo | $182,500 | $155 | 60 |
| 1834 Brandon Way | 0.58mi | 3/2.0 (-1) | 1,290 (+9%) | 11mo | $230,000 | $178 | 44 |
| 5644 Rockdale Ct | 0.51mi | 3/1.0 (-1) | 1,276 (+7%) | 19mo | $120,000 | $94 | 39 |
| 1636 Eastern Valley Rd | 0.47mi | 3/2.0 (-1) | 1,362 (+15%) | 13mo | $249,900 | $183 | 38 |
| 1782 Bradford Ln | 0.41mi | 3/2.0 (-1) | 1,363 (+15%) | 20mo | $248,000 | $182 | 35 |
| 4503 Rosser Loop Dr | 0.38mi | 3/2.0 (-1) | 1,363 (+15%) | 23mo | $218,000 | $160 | 34 |
| 4762 Rosser Loop Dr | 0.65mi | 3/2.0 (-1) | 1,365 (+15%) | 11mo | $260,000 | $190 | 31 |
| 5153 Candle Brook Ter | 0.68mi | 3/2.0 (-1) | 1,313 (+10%) | 22mo | $225,000 | $171 | 28 |
Match score weights: distance 35% · size 25% · config 20% · recency 20%. Top-matched comps best support the ARV.
Projected returns pro-forma
-3.0% appreciation · 8.0% rent growth · sell at horizon
- IRR
- -19.5%
- Equity multiple
- 0.29×
- Total profit
- $-63,418
- Equity at exit
- $47,713
- IRR
- -4.9%
- Equity multiple
- 0.61×
- Total profit
- $-34,498
- Equity at exit
- $27,668
Cash invested: $89,600 (down + closing). Projections, not guarantees.
Landlord ↔ Tenant lean methodology
- Overall (STATE)
- 90 Strongly Landlord-Friendly
- State Alabama
- 90 Strongly Landlord-Friendly · R+15
- County
- — inherits STATE
- City
- — inherits STATE
ZIP-level market 35022
- Home prices YoY
- -20.2%
- Rents YoY
- 14.8%
- Active inventory
- 312
- Price-to-rent
- 12.8×
Monthly cashflow live
- Estimated rent
- $2,081 medium interval (Pro) →
- Mortgage (P&I)
- −$1,678
- Tax from tax record
- −$141 /mo · $1,695/yr
- Insurance
- −$133
- HOA
- −$44
- Lot rent
- −$0
- Vacancy / Maint / Mgmt
- −$437
- Net cashflow
- $-353
Break-even live
Sensitivity live
| Price | -10% $-172 | -5% $-262 | +0% $-353 | +5% $-443 | +10% $-534 |
|---|---|---|---|---|---|
| Rent | -10% $-517 | -5% $-435 | +0% $-353 | +5% $-270 | +10% $-188 |
| Rate | -1.0pp $-192 | -0.5pp $-271 | base $-353 | +0.5pp $-436 | +1.0pp $-520 |
UW: 25.0% down · 7.5% · 30yr · 1.5% tax · 5.0% vac · 8.0% maint · 8.0% mgmt
Financing live
Cash to close
- Down payment
- $80,000
- Closing costs
- $9,600
- Reserves months
- —
- Total cash needed
- —
Loan-product check · same deal, 3 products live
Conventional
25% down · 7.5% · 30yr
- Down + closing
- —
- Monthly P&I
- —
- Monthly cashflow
- —
- DSCR
- —
- Eligible?
- —
Personal DTI + credit; lowest rate.
DSCR
20% down · 8.5% · 30yr
- Down + closing
- —
- Monthly P&I
- —
- Monthly cashflow
- —
- DSCR
- —
- Eligible?
- —
No personal income docs; deal must DSCR.
Hard money
10% down · 12.0% · 12mo
- Down + closing
- —
- Monthly P&I
- —
- Monthly cashflow
- —
- DSCR
- —
- Eligible?
- —
Short-term bridge; refi at stabilization.
Rent comps 1 comps
| Address | Beds | Baths | Sqft | Rent | $/sqft | DOM | Units | Dist |
|---|---|---|---|---|---|---|---|---|
| 4737 Longmeadow Dr Bessemer, AL | 3.0 | 2.0 | 1356 | $1,815 | $1.34 | 12d | 1 | 1.17mi |
HOA detail
- Monthly dues
- $44 · $528/yr
Listing history 1 events
-
2026-05-15$320,000 Active 482-char remark
ⓘ Source: listings_history table (triggers on properties + properties_extension) + one-shot
backfill from property_details.listing_events for pre-trigger history.
Tax reassessment forecast AL · Resets to sale price
- Current annual tax
- $1,695 · $141/mo
- Projected year-2 tax
- $1,695 · $141/mo
- Expected delta
- $0/yr ($0/mo · 0.0%)
ⓘ Screening estimate from a state-policy table — verify with the county assessor before closing.
Climate risk First Street
- Flood 1/10 Low FEMA zone X (unshaded) · 0% chance over 30 yrs
- Wildfire 4/10 Moderate
- Heat 7/10 Severe 7 d/yr ≥108°F today · 19 d/yr by 30 yrs out
- Wind 6/10 Major 43% chance of damaging wind over 30 yrs
- Air quality 2/10 Low 2 unhealthy d/yr today · 2 by 30 yrs out
Nearby sold comps map
Loading sold comps map…
Walkable amenities ~0.75 mi
Loading nearby amenities…
Taxation est. · year 1
- Rental income
- $24,973
- − Mortgage interest
- −$17,925
- − Property taxes
- −$1,695
- − Insurance
- −$1,600
- − Repairs & maintenance
- −$1,998
- − Management
- −$1,998
- − HOA
- −$528
- − Depreciation
- −$9,309
- Taxable loss
- −$10,080
- Est. tax savings @ 24.0%
- +$2,419
- After-tax cash flow
- $-1,813/yr
For passive investors: Depreciation is non-cash, so a rental often shows a tax loss while cash-flowing — sheltering income. Rental losses are passive: they offset passive income freely, and up to $25,000/yr can offset ordinary (W-2) income if you actively participate and your MAGI is under $100k (phasing out to $0 by $150k); unused losses carry forward. On sale, claimed depreciation is recaptured at up to 25%, and gains may owe capital-gains tax (a 1031 exchange can defer both). Figures are a year-1 estimate at your 24.0% rate — not tax advice; consult a CPA.
Schools (NCES district)
- District
- Jefferson County
- NCES district ID
- 0101920
- Math proficiency
- 9% ▼ -24.00%
- Reading proficiency
- 32% ▼ -5.00%
- Median HH income
- $51,712
- Composite
- 18.4/100
- National rank
- #8937
- State rank
- #104 of 129 in AL
Livability — McCalla
No livability data for this city. (Only ~50 U.S. cities are tracked.)
Census & demographics
- Census place
- McCalla, AL
- County
- Jefferson County · 527,445 people
- Metro
- Birmingham-Hoover, AL
- Population (ZIP)
- 23,126
- Household income
- $81,846
- Rent vs Own
- Severe rent burden
- 554.0
Population outlook (Jefferson County) Hauer SSP2
- Today (2025)
- 669,185 people
- By 2030
- 669,694 · +0.1%
- By 2040
- 661,388 · -1.2%
- By 2050
- 643,086 · -3.9%
- By 2075
- 577,267 · -13.7%
- By 2100
- 474,758 · -29.1%
Race, ethnicity, and origin ACS 2023
- Neighborhood character
- Diverse neighborhood (Simpson 0.56)
- Race & ethnicity
- Black 53% White 41% Hispanic / Latino 3% Two or more races 2% Asian 1%
- Common ancestry
- Italian 1% Slovak 1% Iranian 1%
- Foreign-born
- 4% · Canada, China
- Languages at home
- 96% English-only · Spanish 3% Chinese 1%
Political lean MEDSL · Jefferson
- 2024 margin
- D (+10.4) · D 54.6% · R 44.2% · Other 1.2%
- 2008→2024 swing
- +5.4pp toward D · 2008: 5.1pp · 2024: 10.4pp
- All cycles
- 2024: D+10.4 2020: D+13.2 2016: D+7.2 2012: D+6.0 2008: D+5.1
Not yet ingested
- Civics
- —
Market trends
- HPI YoY
- ▼ -55.40%
- Current HPI
- 219.3839
- Rent YoY
- ▲ 14.80%
- Metro
- Birmingham-Hoover, AL
- State GDP YoY
- ▲ 2.94%
- F500 in state
- 4
Industry mix (Fortune 500 HQ in AL)
| Industry | F500 HQs | Revenue |
|---|---|---|
| Financial Services | 1 | $8B |
|
||
| Healthcare | 1 | $5B |
|
||
Price history
+0.0% since first listed3 events — show timeline
- 2026-05-26 Pending — Greater Alabama MLS
- 2026-05-15 Listed $320,000 Greater Alabama MLS
- 2026-05-04 Sold (Public Records) $320,000 Public Records
Property tax history
+25.4%/yrLatest (2025): $1,695 · -0.9% YoY. Source: county tax records.
Cash-flow waterfall
monthlySold comps — $/sqft
last 12 mo · ≤1 miLoading sold comps…