 🏷️ Likely Rental
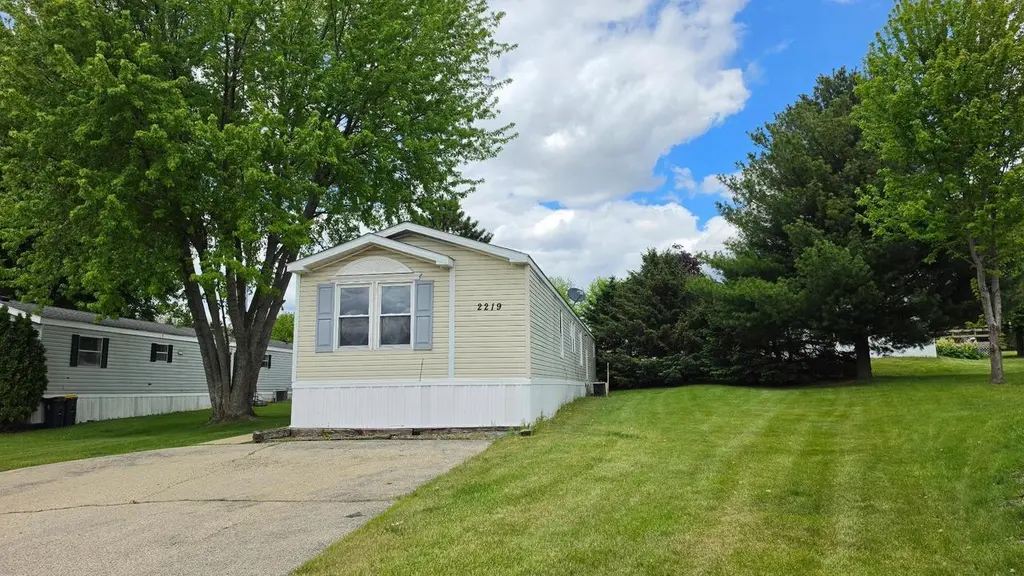
2219 Haven Ln · Monroe, WI
Flood risk No data
- FEMA flood zone
- —
- Chance of flooding over 30 yrs
- —
- Est. flood insurance / yr
- —
Fire risk No data
- Est. fire insurance / yr
- —
Heat risk No data
- Hot days now (above threshold)
- —
- Hot days in 30 yrs
- —
Wind risk No data
- Chance of severe wind over 30 yrs
- —
Air-quality risk No data
- Unhealthy air days now
- —
- Unhealthy air days in 30 yrs
- —
Risk factors via First Street. Map © Google.
Why this score? — see what drove the B grade
The composite is a weighted blend of 9 inputs, each scored 0–100. Each bar is that input's sub-score; the figure is the points it added to the 100-point composite (weight × sub-score).
- Cash flow +30.0/30.0
- 1% rule +10.0/10.0
- DSCR +10.0/10.0
- ARV discount +7.5/15.0
- Livability +4.2/5.0
- Schools +3.1/10.0
- Condition / age +2.8/5.0
- Rent growth +2.5/5.0
- Appreciation +0.0/10.0
$70,000
🖨 Deal sheet 📄 Offer letter ✓ Due diligence
Listing remarks
Affordable in Monroe. Well cared home with 3 bedrooms 2 bath home in a great location. Easy access right off Hwy 11 and 18th Ave. This home has a primary bedroom with double closets, and it's own bath. 2 more bedrooms and full bath. A nice open layout and a spacious lot. Roof is 2 years old, windows are newer in last few years. Furnace regularly serviced, and yes it has central air! Water heater approx 3 yrs old. Park approval applies, lot rent is $440 per month. Nice location within park and ample parking.
Key facts
- Built 1993
- Listed 45 days
Property features AI
Finance
- Other: Lot about 0.01 acre
Exterior
- Utilities: Municipal water; Municipal sewer; Natural gas service available
- Home design: Single-family home; Approximately 1,216 finished above-grade square feet; Estimated size range 1,001–1,250 sq ft; Zoned residential; Located in the city of Monroe
- Construction: Built/record reported by owner
- Exterior features: Vinyl exterior
Interior
- Kitchen: Range/oven; Refrigerator
- Bedrooms: Main-level master bedroom, about 12 x 14; Main-level bedroom, about 8 x 11; Main-level bedroom, about 13 x 10
- Bathrooms: Two full bathrooms, including a full master bath
- Heating & cooling: Forced-air heating; Central air conditioning; Natural gas heating
- Interior features: Cable/satellite available
Neighborhood map
What this means for you Summary
Snapshot
- This is a 3-bed/2.0-bath single-family listed at $70k. Condition is rated fair.
Deal economics
- At list price, monthly cash flow is $599 ($7k/yr) — positive.
- The deal already cash-flows at list — no discount required.
- Meets the 1% rule at list price ($1k rent vs $70k).
- Recommended offer: $68k (3.0% below list) — sets the bar for market timing.
- Cap rate 16.6% vs local median 2.7% in Monroe — top-decile yield for the area; either an underpriced asset or a hidden risk that comps aren't pricing in. Stress-test before assuming the spread holds.
Location & tenants
- Location reads 84/100 on livability (#32 in WI, #627 nationally) — a professional / high-income tenant draw. Strengths: crime A+, cost of living A+, housing A+; Watch: commute F.
- Monroe School District (town): math 36% / reading 36% proficiency, ranked #215 of 342 in WI (top 63%) — families likely to look elsewhere, expect single-tenant / working-renter base with shorter leases.
- Zoned schools: Monroe High (math 27% / reading 32%, grade F, #228 of 483 statewide, top 52%, 729 students, 37% FRL) — zoned schools at 37% FRL track the district average.
- Market conditions: 132 active listings in the ZIP; 4 comparable units currently listed for rent nearby; rentals at typical pace (median 21d on market — plan ~3-4 weeks tenant-placement turnaround); 62 units permitted in Green County in 2024 (0 in 5+ unit buildings).
Forward outlook
- Local home prices are declining (-3.0%/yr); year-one equity from $484 of loan paydown is wiped out by about $2k of value loss. Plan a longer hold.
- Green County population projected to shrink 6% by 2050 — rents likely to lag national; underwrite the cash flow, not the appreciation.
- At projected returns (-3.0% appreciation + 3.0% rent growth), your $20k cash investment doubles in ~4 years — after that, you're playing with house money.
Negotiation context
- It's been on market 45 days — a 3% lower offer ($68k) is reasonable based on typical stale-listing flexibility.
Questions for the listing agent
- It's been on market 45 days. Have you received any prior offers? Is the seller open to a 3% concession, seller financing, or rate buy-down credit?
- Have any recent inspections been done? Can we get a copy of the seller's disclosures and any deferred-maintenance estimates?
- Is there a deadline driving the sale (1031 exchange, divorce, estate, relocation)? That informs how much negotiation room exists.
- What's the average days-on-market for RENTAL listings here right now (not sales)? A rising rental-DOM trend means longer vacancies and softer asking-rent achievability than the comps imply.
- What's the recent tenant-quality profile in this submarket — average credit score on applications, eviction rate, late-payment / NSF rate, and stable-employment percentage? A property-management company in the area should have these aggregated.
- How much new for-sale + rental construction is in the pipeline within 1–3 miles? Heavy new supply typically softens prices + rents 12–24 months out; constrained supply supports both.
Investment metrics
- 1% rule
- 1.96% ✓
- Cap rate
- 16.57%
- Cash-on-cash
- 36.69%
- DSCR
- 2.63
- GRM
- 4.3
CMA / ARV
- ARV (on-the-fly)
- $227,392
- Comps found
- 12
Show comp detail 12 sales within ~0.75 mi
| Address | Dist | Beds/Ba | Sqft | Sold | Price | $/sf | Match |
|---|---|---|---|---|---|---|---|
| 2012 Edgeview Dr | 0.08mi | 2/1.0 (-1) | 1,184 (-3%) | 8mo | $95,000 | $80 | 77 |
| 2008 Ridgeway Rd | 0.21mi | 2/2.0 (-1) | 1,140 (-6%) | 5mo | $235,000 | $206 | 71 |
| 615 27th Ave | 0.64mi | 3/1.0 | 1,202 (-1%) | 14mo | $225,000 | $187 | 53 |
| 509 16th Ave | 0.57mi | 3/1.0 | 1,176 (-3%) | 14mo | $180,000 | $153 | 52 |
| 522 22nd Ave | 0.46mi | 2/1.5 (-1) | 1,135 (-7%) | 15mo | $185,250 | $163 | 48 |
| 119 N 12th Ave | 0.64mi | 3/2.0 | 1,316 (+8%) | 11mo | $288,500 | $219 | 47 |
| 512 27th Ave | 0.56mi | 2/2.0 (-1) | 1,133 (-7%) | 12mo | $232,500 | $205 | 47 |
| 610 18th Ave | 0.59mi | 3/2.0 | 1,144 (-6%) | 20mo | $195,500 | $171 | 46 |
| 708 19th Ave | 0.65mi | 3/1.0 | 1,352 (+11%) | 2mo | $215,000 | $159 | 46 |
| 2201 6th St | 0.51mi | 3/1.0 | 1,111 (-9%) | 17mo | $148,000 | $133 | 43 |
| 602 28th Ave | 0.68mi | 2/2.0 (-1) | 1,119 (-8%) | 13mo | $222,000 | $198 | 39 |
| 627 28th Ave | 0.70mi | 2/2.0 (-1) | 1,320 (+9%) | 11mo | $261,000 | $198 | 39 |
Match score weights: distance 35% · size 25% · config 20% · recency 20%. Top-matched comps best support the ARV.
Projected returns pro-forma
-3.0% appreciation · 3.0% rent growth · sell at horizon
- IRR
- 32.5%
- Equity multiple
- 2.37×
- Total profit
- $26,843
- Equity at exit
- $10,437
- IRR
- 39.6%
- Equity multiple
- 4.70×
- Total profit
- $72,602
- Equity at exit
- $6,052
Cash invested: $19,600 (down + closing). Projections, not guarantees.
Landlord ↔ Tenant lean methodology
- Overall (STATE)
- 73 Landlord-Friendly
- State Wisconsin
- 73 Landlord-Friendly · R+2
- County
- — inherits STATE
- City
- — inherits STATE
ZIP-level market 53566
- Home prices YoY
- -32.3%
- Active inventory
- 132
- Price-to-rent
- 4.3×
Monthly cashflow live
- Estimated rent
- $1,371 medium interval (Pro) →
- Mortgage (P&I)
- −$367
- Tax est. 1.5%
- −$88 /mo · $1,050/yr
- Insurance
- −$29
- HOA
- −$0
- Vacancy / Maint / Mgmt
- −$288
- Net cashflow
- $599
Break-even live
UW: 25.0% down · 7.5% · 30yr · 1.5% tax · 5.0% vac · 8.0% maint · 8.0% mgmt
Financing live
Cash to close
- Down payment
- $17,500
- Closing costs
- $2,100
- Reserves months
- —
- Total cash needed
- —
Loan-product check · same deal, 3 products live
Conventional
25% down · 7.5% · 30yr
- Down + closing
- —
- Monthly P&I
- —
- Monthly cashflow
- —
- DSCR
- —
- Eligible?
- —
Personal DTI + credit; lowest rate.
DSCR
20% down · 8.5% · 30yr
- Down + closing
- —
- Monthly P&I
- —
- Monthly cashflow
- —
- DSCR
- —
- Eligible?
- —
No personal income docs; deal must DSCR.
Hard money
10% down · 12.0% · 12mo
- Down + closing
- —
- Monthly P&I
- —
- Monthly cashflow
- —
- DSCR
- —
- Eligible?
- —
Short-term bridge; refi at stabilization.
Rent comps 4 comps
| Address | Beds | Baths | Sqft | Rent | $/sqft | DOM | Units | Dist |
|---|---|---|---|---|---|---|---|---|
| 2023 6th St Monroe, WI | 2.0 | 1.0 | 1050 | $1,300 | $1.24 | 21d | 1 | 0.52mi |
| 615 16th Ave Unit 615 Monroe, WI | 2.0 | 1.0 | 1250 | $1,400 | $1.12 | 43d | 1 | 0.67mi |
| 201 3rd Ave Apt 28 Monroe, WI | 2.0 | 2.0 | 1008 | $1,450 | $1.44 | 21d | 1 | 1.18mi |
| 207 3rd Ave Monroe, WI | 2.0 | 1.0–2.0 | 980 | $1,400 | $1.43 | 13d | 5 | 1.19mi |
Listing history 16 events
-
2026-06-18days on market $70,000 Active 45 DOM
-
2026-06-17days on market $70,000 Active 44 DOM
-
2026-06-16days on market $70,000 Active 43 DOM
-
2026-06-15days on market $70,000 Active 42 DOM
-
2026-06-15days on market $70,000 Active 41 DOM
-
2026-06-13days on market $70,000 Active 40 DOM
-
2026-06-12days on market $70,000 Active 39 DOM
-
2026-06-09days on market $70,000 Active 36 DOM
-
2026-06-08days on market $70,000 Active 35 DOM
-
2026-06-08pricedays on market $70,000 Active 34 DOM
-
2026-06-05days on market $75,000 Active 32 DOM
-
2026-06-04price $75,000 Active 30 DOM
-
2026-06-03days on market $79,000 Active 30 DOM
-
2026-06-01days on market $79,000 Active 28 DOM
-
2026-05-31days on market $79,000 Active 27 DOM
-
2026-05-04$79,000 Active
ⓘ Source: listings_history table (triggers on properties + properties_extension) + one-shot
backfill from property_details.listing_events for pre-trigger history.
Nearby sold comps map
Loading sold comps map…
Walkable amenities ~0.75 mi
Loading nearby amenities…
Taxation est. · year 1
- Rental income
- $16,450
- − Mortgage interest
- −$3,921
- − Property taxes
- −$1,050
- − Insurance
- −$350
- − Repairs & maintenance
- −$1,316
- − Management
- −$1,316
- − Depreciation
- −$2,036
- Taxable income
- $6,461
- Est. tax owed @ 24.0%
- −$1,551
- After-tax cash flow
- $5,640/yr
For passive investors: Depreciation is non-cash, so a rental often shows a tax loss while cash-flowing — sheltering income. Rental losses are passive: they offset passive income freely, and up to $25,000/yr can offset ordinary (W-2) income if you actively participate and your MAGI is under $100k (phasing out to $0 by $150k); unused losses carry forward. On sale, claimed depreciation is recaptured at up to 25%, and gains may owe capital-gains tax (a 1031 exchange can defer both). Figures are a year-1 estimate at your 24.0% rate — not tax advice; consult a CPA.
Condition & rehab AI · 12 photos
The home is in fair condition with moderate rehabilitation needed. The kitchen and bathroom cabinets are in poor condition and need to be replaced. The home has a good location and is well-maintained, but the dated cabinets and appliances need updating to increase its value.
Repairs flagged
- Major kitchen cabinets — dated and worn
- Major bathroom cabinets — dated and worn
- Minor kitchen appliances — functional but outdated
Value-add opportunities
- Resale new kitchen cabinets — modernizes the kitchen and adds value
- Resale new bathroom cabinets — modernizes the bathroom and adds value
- Both landscaping — enhances curb appeal and adds value
Renovation cost estimate screening
| Repair item | Severity | Est. cost |
|---|---|---|
| kitchen cabinets · dated and worn | Major | $15,000–50,000 |
| bathroom cabinets · dated and worn | Major | $15,000–50,000 |
| kitchen appliances · functional but outdated | Minor | $500–3,000 |
| Total estimated repair cost · 3 items | $30,500–103,000 |
Value-add ROI direction
- Resale new kitchen cabinets — modernizes the kitchen and adds value ↑
- Resale new bathroom cabinets — modernizes the bathroom and adds value ↑
- Both landscaping — enhances curb appeal and adds value ↑
ⓘ Cost ranges are severity-bucket heuristics (US national rule-of-thumb). Get contractor quotes + a written scope before underwriting a rehab budget.
Schools (NCES district)
- District
- Monroe School District
- NCES district ID
- 5509840
- Math proficiency
- 36% ▼ -14.00%
- Reading proficiency
- 36% ▼ -6.00%
- Median HH income
- $47,721
- Composite
- 30.97/100
- National rank
- #6102
- State rank
- #215 of 342 in WI
Livability — Monroe
- Score
- 84/100
- State rank
- #32
- US rank
- #627
Category grades
Schools grade is shown separately in the Schools card above.
Census & demographics
- Census place
- Monroe, WI
- City population
- 14,772
- Population (ZIP)
- 14,772
Population outlook (Green County) Hauer SSP2
- Today (2025)
- 37,753 people
- By 2030
- 37,767 · +0.0%
- By 2040
- 37,101 · -1.7%
- By 2050
- 35,339 · -6.4%
- By 2075
- 30,749 · -18.6%
- By 2100
- 23,786 · -37.0%
Race, ethnicity, and origin ACS 2023
- Neighborhood character
- Predominantly White (90%)
- Race & ethnicity
- White 90% Hispanic / Latino 6% Two or more races 4% Black 1%
- Hispanic origin (detail)
- Mexican 6%
- Common ancestry
- Portuguese 12% Romanian 3% Lithuanian 1%
- Foreign-born
- 2% · Canada
- Languages at home
- 95% English-only · Spanish 4%
Political lean MEDSL · Green
- 2024 margin
- Toss-up / Even · D 49.5% · R 49.2% · Other 1.3%
- 2008→2024 swing
- -25.5pp toward R · 2008: 25.8pp · 2024: 0.3pp
- All cycles
- 2024: D+0.3 2020: D+3.2 2016: D+2.3 2012: D+17.3 2008: D+25.8
Not yet ingested
- Civics
- —
Market trends
- HPI YoY
- ▼ -104.34%
- Current HPI
- 219.1142
- Rent YoY
- —
- Metro
- —
- State GDP YoY
- ▲ 2.10%
- F500 in state
- 20
Industry mix (Fortune 500 HQ in WI)
| Industry | F500 HQs | Revenue |
|---|---|---|
| Industrial Machinery | 4 | $23B |
|
||
| Industrial Technology | 2 | $36B |
|
||
| Insurance | 1 | $36B |
|
||
| Professional Services | 1 | $19B |
|
||
| Utilities | 1 | $9B |
|
||
| Consumer Goods | 1 | $3B |
|
||
Price history
1 event — show timeline
- 2026-05-04 Listed $79,000 SCWMLS
Cash-flow waterfall
monthlySold comps — $/sqft
last 12 mo · ≤1 miLoading sold comps…