 Multi-family
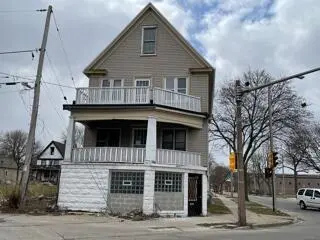
2475 W Hopkins St · Milwaukee, WI
Flood risk 6/10 · Moderate
- FEMA flood zone
- X (unshaded)
- Chance of flooding over 30 yrs
- 0.7%
- Est. flood insurance / yr
- $473 – $860
Fire risk 1/10 · Minimal
- Est. fire insurance / yr
- $636 – $1,182
Heat risk 2/10 · Minimal
- Hot days now (above 98°F)
- 7 days/yr
- Hot days in 30 yrs
- 13 days/yr
Wind risk 2/10 · Minimal
- Chance of severe wind over 30 yrs
- —
Air-quality risk 3/10 · Minor
- Unhealthy air days now
- 3 days/yr
- Unhealthy air days in 30 yrs
- 4 days/yr
Risk factors via First Street. Map © Google.
Why this score? — see what drove the B grade
The composite is a weighted blend of 9 inputs, each scored 0–100. Each bar is that input's sub-score; the figure is the points it added to the 100-point composite (weight × sub-score).
- Cash flow +30.0/30.0
- 1% rule +10.0/10.0
- DSCR +10.0/10.0
- Appreciation +10.0/10.0
- Rent growth +4.6/5.0
- Livability +4.0/5.0
- Schools +1.2/10.0
- Condition / age +1.0/5.0
- ARV discount +0.0/15.0
$95,000
🖨 Deal sheet 📄 Offer letter ✓ Due diligence
Multi-family units
County records classify this as Multi-Family (2-4 Unit). Listing-text estimate: 1 unit. estimate disagrees with records
Listing remarks MLS
Calling all current and future investors! This * Double Lot * is a great addition or start to your portfolio. Full of additional potential with already finished 3rd floor, and Commercial space available in the basement. Fully rented 2/1 lower unit and 3/1 upper.
Key facts
- Double lot
- Finished 3rd floor
- 3,484 sq ft lot
Tags
Neighborhood map
What this means for you Summary
Snapshot
- This is a 4-bed/2.0-bath multifamily listed at $95k. Condition is rated poor.
Deal economics
- At list price, monthly cash flow is $1k ($12k/yr) — positive.
- The deal already cash-flows at list — no discount required.
- Meets the 1% rule at list price ($2k rent vs $95k).
- Recommended offer: $89k (6.0% below list) — sets the bar for market timing.
- Cap rate 19.0% vs local median 5.1% in Milwaukee — top-decile yield for the area; either an underpriced asset or a hidden risk that comps aren't pricing in. Stress-test before assuming the spread holds.
Location & tenants
- Location reads 81/100 on livability (#55 in WI, #1,534 nationally) — a professional / high-income tenant draw. Strengths: amenities A+, commute A+, cost of living A+; Watch: employment D+, schools F, crime F.
- Milwaukee School District (urban): math 10% / reading 18% proficiency, ranked #337 of 342 in WI (top 98%) — low school quality limits family demand, transient renter base, plan for 1-2y turnover; 77% free/reduced lunch — lower-income household profile, screen leases tightly.
- Market conditions: Rents rising fast (+8.3%/yr); 150 active listings in the ZIP; 10 comparable units currently listed for rent nearby; rentals at typical pace (median 24d on market — plan ~3-4 weeks tenant-placement turnaround); lower-income renter base — watch delinquency; 1,017 units permitted in Milwaukee County in 2024 (803 in 5+ unit buildings).
Forward outlook
- In year one you build about $10k of equity ($657 loan paydown + $10k appreciation (10.0% local appreciation)).
- Milwaukee County population projected at +4% by 2050 — modest demand growth; plan on rents tracking national, not racing it.
- At projected returns (10.0% appreciation + 8.0% rent growth), your $27k cash investment doubles in ~2 years — after that, you're playing with house money.
- By year 4, paydown + projected appreciation supports a ~$36k cash-out refi (75% LTV) — recoverable capital for the next deal without selling this one.
Negotiation context
- It's been on market 90 days — a 6% lower offer ($89k) is reasonable based on typical stale-listing flexibility.
- 5 sale attempts since 14y ago; this cycle's ask has dropped $20k (17%) from the opening price — seller is motivated, your offer sets the floor, not the list.
- Current owner paid $69k; 38% above their basis — modest negotiation headroom, anchor on the comps not their cost.
Risks & watch-outs
- Watch-outs: built in 1900 — expect roof / HVAC / electrical / plumbing capex.
- Climate carrying-cost: major flood risk — expect insurance premiums to compound above CPI over the hold.
Questions for the listing agent
- It's been on market 90 days. Have you received any prior offers? Is the seller open to a 6% concession, seller financing, or rate buy-down credit?
- Have any recent inspections been done? Can we get a copy of the seller's disclosures and any deferred-maintenance estimates?
- Built in 1900 — when were the roof, HVAC, electrical panel, plumbing, and water heater last replaced?
- Why hasn't it sold? Are there any deal-killer items the seller is aware of (foundation, flood, title, zoning, code violations)?
- Is there a deadline driving the sale (1031 exchange, divorce, estate, relocation)? That informs how much negotiation room exists.
- Schools are F-rated, which usually means shorter tenancies and higher turnover. Who's the typical renter profile here, and what's been the actual vacancy rate?
- Crime grade is F in this area — have there been break-ins, vandalism, or insurance claims at this property in the last 3 years? What carrier currently insures it and at what premium?
- What's the average days-on-market for RENTAL listings here right now (not sales)? A rising rental-DOM trend means longer vacancies and softer asking-rent achievability than the comps imply.
- What's the recent tenant-quality profile in this submarket — average credit score on applications, eviction rate, late-payment / NSF rate, and stable-employment percentage? A property-management company in the area should have these aggregated.
- How much new apartment / multifamily construction is in the pipeline within 1–3 miles? Heavy new supply (>2% of stock underway) typically softens rents 12–24 months out; light construction supports rent growth.
Investment metrics
- 1% rule
- 2.18% ✓
- Cap rate
- 18.97%
- Cash-on-cash
- 45.28%
- DSCR
- 3.01
- GRM
- 3.8
CMA / ARV
- ARV (median comp)
- $75,858
- List price
- $95,000
- Delta
- 25.23%
- Verdict
- OVERPRICED
- Comps
- 20 within 1.0 mi
Show comp detail 12 sales within ~0.75 mi
| Address | Dist | Beds/Ba | Sqft | Sold | Price | $/sf | Match |
|---|---|---|---|---|---|---|---|
| 2022 W Keefe Ave Unit 2022A | 0.33mi | 4/2.0 | 1,914 (-1%) | 1mo | $55,000 | $29 | 82 |
| 2450 W Keefe Ave #2452 | 0.12mi | 3/2.0 (-1) | 1,831 (-5%) | 1mo | $35,000 | $19 | 79 |
| 3607 N 20th St | 0.39mi | 4/2.0 | 2,046 (+6%) | 2mo | $115,000 | $56 | 71 |
| 2020 W Hopkins St | 0.46mi | 4/2.0 | 2,050 (+6%) | 0mo | $105,000 | $51 | 68 |
| 3202 N 24th St #3204 | 0.29mi | 4/2.0 | 2,169 (+12%) | 2mo | $165,000 | $76 | 64 |
| 4045 N 26th St Unit 4045A | 0.69mi | 4/2.0 | 1,963 (+1%) | 2mo | $66,100 | $34 | 64 |
| 2847 N 26th St | 0.71mi | 4/2.0 | 1,863 (-4%) | 2mo | $70,000 | $38 | 58 |
| 2972 N 28th St | 0.58mi | 4/2.0 | 1,757 (-9%) | 0mo | $141,806 | $81 | 57 |
| 3260 N 34th St Unit 3260A | 0.61mi | 4/2.0 | 1,776 (-8%) | 2mo | $86,000 | $48 | 56 |
| 3068 N 34th St Unit 3068A | 0.73mi | 5/2.0 (+1) | 2,087 (+8%) | 0mo | $110,000 | $53 | 48 |
| 3233 W Auer Ave | 0.61mi | 4/2.0 | 1,657 (-14%) | 1mo | $78,500 | $47 | 47 |
| 3748 N 17th St | 0.71mi | 4/2.0 | 2,161 (+12%) | 2mo | $80,000 | $37 | 46 |
Match score weights: distance 35% · size 25% · config 20% · recency 20%. Top-matched comps best support the ARV.
Projected returns pro-forma
10.0% appreciation · 8.0% rent growth · sell at horizon
- IRR
- 63.2%
- Equity multiple
- 5.76×
- Total profit
- $126,624
- Equity at exit
- $85,584
- IRR
- 58.8%
- Equity multiple
- 14.15×
- Total profit
- $349,747
- Equity at exit
- $184,564
Cash invested: $26,600 (down + closing). Projections, not guarantees.
Landlord ↔ Tenant lean methodology
- Overall (STATE)
- 73 Landlord-Friendly
- State Wisconsin
- 73 Landlord-Friendly · R+2
- County
- — inherits STATE
- City
- — inherits STATE
ZIP-level market 53206
- Rents YoY
- 8.3%
- Active inventory
- 150
- Price-to-rent
- 8.1×
Monthly cashflow live
- Estimated rent
- $2,070 high interval (Pro) →
- Mortgage (P&I)
- −$498
- Tax from tax record
- −$94 /mo · $1,125/yr
- Insurance
- −$40
- HOA
- −$0
- Vacancy / Maint / Mgmt
- −$435
- Net cashflow
- $1,004
Break-even live
2-unit breakdown (identical units grouped — click to expand)
| Units | Beds | Baths | Est. rent |
|---|---|---|---|
| 1× unit | 2 | 1 | $981 |
| 1× unit | 3 | 1 | $1,088 |
| Total (2 units) | $2,070 | ||
UW: 25.0% down · 7.5% · 30yr · 1.5% tax · 5.0% vac · 8.0% maint · 8.0% mgmt
Financing live
Cash to close
- Down payment
- $23,750
- Closing costs
- $2,850
- Reserves months
- —
- Total cash needed
- —
Loan-product check · same deal, 3 products live
Conventional
25% down · 7.5% · 30yr
- Down + closing
- —
- Monthly P&I
- —
- Monthly cashflow
- —
- DSCR
- —
- Eligible?
- —
Personal DTI + credit; lowest rate.
DSCR
20% down · 8.5% · 30yr
- Down + closing
- —
- Monthly P&I
- —
- Monthly cashflow
- —
- DSCR
- —
- Eligible?
- —
No personal income docs; deal must DSCR.
Hard money
10% down · 12.0% · 12mo
- Down + closing
- —
- Monthly P&I
- —
- Monthly cashflow
- —
- DSCR
- —
- Eligible?
- —
Short-term bridge; refi at stabilization.
Rent comps 10 comps
| Address | Beds | Baths | Sqft | Rent | $/sqft | DOM | Units | Dist |
|---|---|---|---|---|---|---|---|---|
| 2704 W Concordia Ave Unit Na Milwaukee, WI | 5.0 | 2.0 | 1856 | $2,500 | $1.35 | 23d | 1 | 0.21mi |
| 2106A W Keefe Ave Unit 2106 Lower Milwaukee, WI | 3.0 | 1.0 | 1300 | $1,100 | $0.85 | 17d | 1 | 0.29mi |
| 2870 N 29th St #2872 Milwaukee, WI | 3.0 | 1.0 | 1300 | $1,250 | $0.96 | 43d | 1 | 0.73mi |
| 2116 W Atkinson Ave Unit A Milwaukee, WI | 4.0 | 1.0 | 1707 | $2,000 | $1.17 | 1d | 1 | 0.79mi |
| 2308 W Clarke St Milwaukee, WI | 4.0 | 2.0 | 1545 | $1,750 | $1.13 | 23d | 1 | 1.03mi |
| 2809 W Clarke St Unit 12811 Milwaukee, WI | 3.0 | 1.0 | 1400 | $1,200 | $0.86 | 17d | 1 | 1.08mi |
| 3122 N 42nd St Milwaukee, WI | 3.0 | 1.0 | 1323 | $1,495 | $1.13 | 4d | 1 | 1.14mi |
| 3123 N 42nd St Milwaukee, WI | 4.0 | 1.0 | 1500 | $1,700 | $1.13 | 23d | 1 | 1.17mi |
| 3925 N 42nd St Milwaukee, WI | 3.0 | 1.0 | 1300 | $1,675 | $1.29 | 43d | 1 | 1.21mi |
| 2432 N 28th St Milwaukee, WI | 5.0 | 1.5 | 1876 | $1,600 | $0.85 | 43d | 1 | 1.25mi |
Listing history 30 events
-
2026-06-18days on market $95,000 Active 90 DOM
-
2026-06-17days on market $95,000 Active 89 DOM
-
2026-06-16days on market $95,000 Active 88 DOM
-
2026-06-15days on market $95,000 Active 87 DOM
-
2026-06-13days on market $95,000 Active 85 DOM
-
2026-06-13pricedays on market $95,000 Active 84 DOM
-
2026-06-09days on market $115,000 Active 81 DOM
-
2026-06-08days on market $115,000 Active 80 DOM
-
2026-06-07days on market $115,000 Active 79 DOM
-
2026-06-05days on market $115,000 Active 76 DOM
-
2026-06-03days on market $115,000 Active 75 DOM
-
2026-06-02days on market $115,000 Active 74 DOM
-
2026-06-01days on market $115,000 Active 73 DOM
-
2026-05-31days on market $115,000 Active 72 DOM
-
2026-03-20$115,000 Active 264-char remark
Show marketing remark (264 chars)
Calling all current and future investors! This * Double Lot * is a great addition or start to your portfolio. Full of additional potential with already finished 3rd floor, and Commercial space available in the basement. Fully rented 2/1 lower unit and 3/1 upper.
-
2021-07-02soldstatus $69,000
-
2021-06-23soldstatus $69,000 Sold 451-char remark
Show marketing remark (451 chars)
ATTENTION INVESTORS . .. ADD THIS TWO FAMILY TO YOUR PORTFOLIO. THIS PROPERTY HAS NEW ROOF, NEW ELECTRICAL UPDATES AND PLUMBING (2020). THE LOWER UNIT HAS TENANTS WITH GUARANTEED AGENCY-PAID RENT OF $950 WITH A LEASE UNTIL THE END OF THE YEAR. 24HRS NOTICE TO VIEW LOWER UNIT. UPPER UNIT IS VACANT. POSSIBLE COMMERCIAL SPACE IN LOWER LEVEL OF PROPERTY. CASH DEAL ONLY THIS PROPERTY IS BEING SOLD AS IS. VACANT LOT LOCATED AT 3382-84 N 25TH ST INCLUDED
-
2021-05-29historical Contingent 451-char remark
Show marketing remark (451 chars)
ATTENTION INVESTORS . .. ADD THIS TWO FAMILY TO YOUR PORTFOLIO. THIS PROPERTY HAS NEW ROOF, NEW ELECTRICAL UPDATES AND PLUMBING (2020). THE LOWER UNIT HAS TENANTS WITH GUARANTEED AGENCY-PAID RENT OF $950 WITH A LEASE UNTIL THE END OF THE YEAR. 24HRS NOTICE TO VIEW LOWER UNIT. UPPER UNIT IS VACANT. POSSIBLE COMMERCIAL SPACE IN LOWER LEVEL OF PROPERTY. CASH DEAL ONLY THIS PROPERTY IS BEING SOLD AS IS. VACANT LOT LOCATED AT 3382-84 N 25TH ST INCLUDED
-
2021-05-17price $69,000 451-char remark
Show marketing remark (451 chars)
ATTENTION INVESTORS . .. ADD THIS TWO FAMILY TO YOUR PORTFOLIO. THIS PROPERTY HAS NEW ROOF, NEW ELECTRICAL UPDATES AND PLUMBING (2020). THE LOWER UNIT HAS TENANTS WITH GUARANTEED AGENCY-PAID RENT OF $950 WITH A LEASE UNTIL THE END OF THE YEAR. 24HRS NOTICE TO VIEW LOWER UNIT. UPPER UNIT IS VACANT. POSSIBLE COMMERCIAL SPACE IN LOWER LEVEL OF PROPERTY. CASH DEAL ONLY THIS PROPERTY IS BEING SOLD AS IS. VACANT LOT LOCATED AT 3382-84 N 25TH ST INCLUDED
-
2021-04-24$76,000 Active 451-char remark
Show marketing remark (451 chars)
ATTENTION INVESTORS . .. ADD THIS TWO FAMILY TO YOUR PORTFOLIO. THIS PROPERTY HAS NEW ROOF, NEW ELECTRICAL UPDATES AND PLUMBING (2020). THE LOWER UNIT HAS TENANTS WITH GUARANTEED AGENCY-PAID RENT OF $950 WITH A LEASE UNTIL THE END OF THE YEAR. 24HRS NOTICE TO VIEW LOWER UNIT. UPPER UNIT IS VACANT. POSSIBLE COMMERCIAL SPACE IN LOWER LEVEL OF PROPERTY. CASH DEAL ONLY THIS PROPERTY IS BEING SOLD AS IS. VACANT LOT LOCATED AT 3382-84 N 25TH ST INCLUDED
-
2018-10-01soldstatus $2,500 Sold
-
2018-09-19historical Contingent
-
2018-05-30$2,500 Active
-
2013-03-06historical
-
2013-03-06$14,900
-
2012-12-20soldstatus $4,309
-
2012-10-07$14,900
-
2012-10-07historical
-
1996-07-16soldstatus $14,000
-
1996-06-01soldstatus $14,000
ⓘ Source: listings_history table (triggers on properties + properties_extension) + one-shot
backfill from property_details.listing_events for pre-trigger history.
Tax reassessment forecast WI · Partial reset (capped growth)
- Current annual tax
- $1,125 · $94/mo
- Projected year-2 tax
- $1,441 · $120/mo
- Expected delta
- +$316/yr (+$26/mo · 28.1%)
ⓘ Screening estimate from a state-policy table — verify with the county assessor before closing.
Climate risk First Street
- Flood 6/10 Major FEMA zone X (unshaded) · 70% chance over 30 yrs
- Wildfire 1/10 Low
- Heat 2/10 Low 7 d/yr ≥98°F today · 13 d/yr by 30 yrs out
- Wind 2/10 Low
- Air quality 3/10 Moderate 3 unhealthy d/yr today · 4 by 30 yrs out
Nearby sold comps map
Loading sold comps map…
Walkable amenities ~0.75 mi
Loading nearby amenities…
Taxation est. · year 1
- Rental income
- $24,840
- − Mortgage interest
- −$5,321
- − Property taxes
- −$1,125
- − Insurance
- −$475
- − Repairs & maintenance
- −$1,987
- − Management
- −$1,987
- − Depreciation
- −$2,764
- Taxable income
- $11,180
- Est. tax owed @ 24.0%
- −$2,683
- After-tax cash flow
- $9,362/yr
For passive investors: Depreciation is non-cash, so a rental often shows a tax loss while cash-flowing — sheltering income. Rental losses are passive: they offset passive income freely, and up to $25,000/yr can offset ordinary (W-2) income if you actively participate and your MAGI is under $100k (phasing out to $0 by $150k); unused losses carry forward. On sale, claimed depreciation is recaptured at up to 25%, and gains may owe capital-gains tax (a 1031 exchange can defer both). Figures are a year-1 estimate at your 24.0% rate — not tax advice; consult a CPA.
Condition & rehab AI · 1 photo
This multi-family property requires extensive repairs and updates to its exterior, structure, HVAC, and landscaping, significantly impacting its current value.
Repairs flagged
- Major Exterior siding — Severe damage and peeling
- Major Foundation/structure — No photos of foundation/structure
- Major HVAC/mechanicals — No photos of HVAC/mechanicals
- Major Landscaping/curb appeal — No photos of landscaping/curb appeal
Value-add opportunities
- Both New exterior siding — Improves curb appeal and structural integrity
- Both New HVAC system — Enhances comfort and energy efficiency
- Both Landscaping and curb appeal improvements — Enhances property's visual appeal and marketability
Renovation cost estimate screening
| Repair item | Severity | Est. cost |
|---|---|---|
| Exterior siding · Severe damage and peeling | Major | $15,000–50,000 |
| Foundation/structure · No photos of foundation/structure | Major | $15,000–50,000 |
| HVAC/mechanicals · No photos of HVAC/mechanicals | Major | $15,000–50,000 |
| Landscaping/curb appeal · No photos of landscaping/curb appeal | Major | $15,000–50,000 |
| Total estimated repair cost · 4 items | $60,000–200,000 |
Value-add ROI direction
- Both New exterior siding — Improves curb appeal and structural integrity ↑
- Both New HVAC system — Enhances comfort and energy efficiency ↑
- Both Landscaping and curb appeal improvements — Enhances property's visual appeal and marketability ↑
ⓘ Cost ranges are severity-bucket heuristics (US national rule-of-thumb). Get contractor quotes + a written scope before underwriting a rehab budget.
Schools (NCES district)
- District
- Milwaukee School District
- NCES district ID
- 5509600
- Math proficiency
- 10% ▼ -5.00%
- Reading proficiency
- 18% ▬ 0.00%
- Median HH income
- $36,339
- Composite
- 11.61/100
- National rank
- #9696
- State rank
- #337 of 342 in WI
Livability — Milwaukee
- Score
- 81/100
- State rank
- #55
- US rank
- #1534
Category grades
Schools grade is shown separately in the Schools card above.
Census & demographics
- Census place
- Milwaukee, WI
- County
- Milwaukee County · 926,379 people
- City population
- 573,768
- Metro
- Milwaukee-Waukesha, WI
- Population (ZIP)
- 19,887
- Household income
- $29,336
- Rent vs Own
- Severe rent burden
- 2061.0
Population outlook (Milwaukee County) Hauer SSP2
- Today (2025)
- 995,758 people
- By 2030
- 1,009,124 · +1.3%
- By 2040
- 1,028,128 · +3.3%
- By 2050
- 1,040,066 · +4.4%
- By 2075
- 1,057,849 · +6.2%
- By 2100
- 1,039,774 · +4.4%
Race, ethnicity, and origin ACS 2023
- Neighborhood character
- Predominantly Black (91%)
- Race & ethnicity
- Black 91% Two or more races 3% White 3% Hispanic / Latino 3%
- Common ancestry
- Norwegian 1%
- Foreign-born
- 1% · Canada
- Languages at home
- 97% English-only · Spanish 2%
Political lean MEDSL · Milwaukee
- 2024 margin
- Solid D (+38.5) · D 68.3% · R 29.8% · Other 1.8%
- 2008→2024 swing
- +2.7pp toward D · 2008: 35.9pp · 2024: 38.5pp
- All cycles
- 2024: D+38.5 2020: D+39.9 2016: D+37.5 2012: D+34.6 2008: D+35.9
Not yet ingested
- Civics
- —
Market trends
- HPI YoY
- ▲ 133.03%
- Current HPI
- 397.7151
- Rent YoY
- ▲ 8.28%
- Metro
- Milwaukee-Waukesha, WI
- State GDP YoY
- ▲ 2.10%
- F500 in state
- 20
Industry mix (Fortune 500 HQ in WI)
| Industry | F500 HQs | Revenue |
|---|---|---|
| Industrial Machinery | 4 | $23B |
|
||
| Industrial Technology | 2 | $36B |
|
||
| Insurance | 1 | $36B |
|
||
| Professional Services | 1 | $19B |
|
||
| Utilities | 1 | $9B |
|
||
| Consumer Goods | 1 | $3B |
|
||
Price history
+721.4% since first listed16 events — show timeline
- 2026-03-20 Listed $115,000 METROMLS
- 2021-07-02 Sold (Public Records) $69,000 Public Records
- 2021-06-23 Sold (MLS) $69,000 METROMLS
- 2021-05-29 Contingent — METROMLS
- 2021-05-17 Price Changed $69,000 METROMLS
- 2021-04-24 Listed $76,000 METROMLS
- 2018-10-01 Sold (MLS) $2,500 METROMLS
- 2018-09-19 Contingent — METROMLS
- 2018-05-30 Listed $2,500 METROMLS
- 2013-03-06 Listed $14,900 METROMLS
- 2013-03-06 Listing Removed — METROMLS
- 2012-12-20 Sold (MLS) $4,309 METROMLS
- 2012-10-07 Listing Removed — METROMLS
- 2012-10-07 Listed $14,900 METROMLS
- 1996-07-16 Sold (Public Records) $14,000 Public Records
- 1996-06-01 Sold (Public Records) $14,000 Public Records
Property tax history
-12.4%/yrLatest (2024): $1,125 · -6.0% YoY. Source: county tax records.
Cash-flow waterfall
monthlySold comps — $/sqft
last 12 mo · ≤1 miLoading sold comps…