 🏷️ Likely Rental
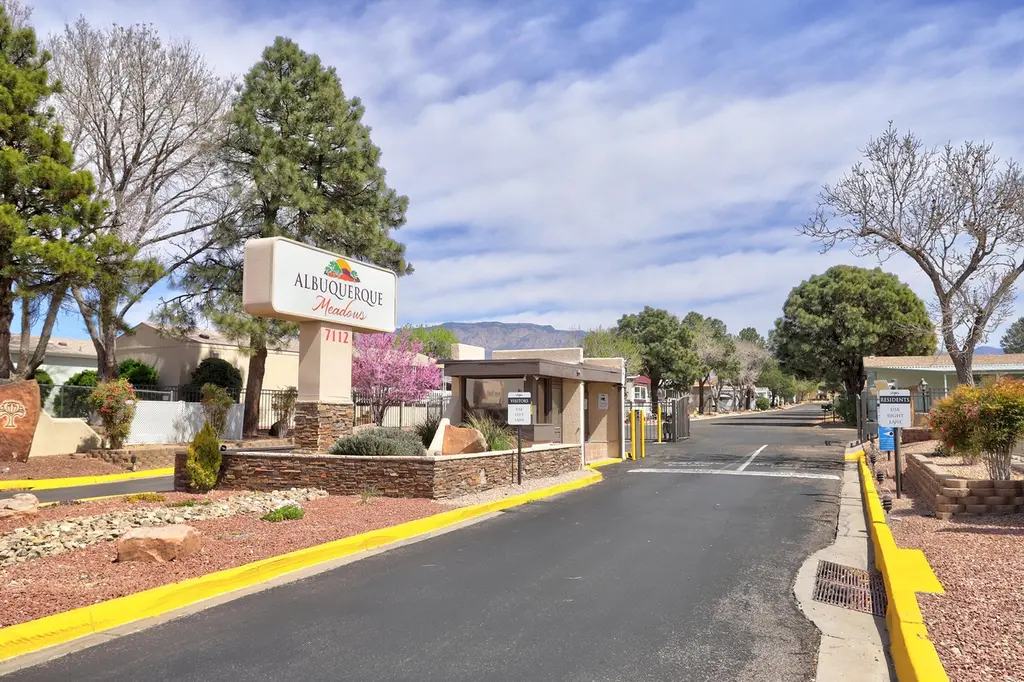
7112 Pan American NE #187 · Albuquerque, NM
Flood risk 4/10 · Minor
- FEMA flood zone
- X (unshaded)
- Chance of flooding over 30 yrs
- 0.22%
- Est. flood insurance / yr
- $507 – $1,088
Fire risk 1/10 · Minimal
- Est. fire insurance / yr
- $706 – $1,312
Heat risk 4/10 · Minor
- Hot days now (above 95°F)
- 3 days/yr
- Hot days in 30 yrs
- 7 days/yr
Wind risk 1/10 · Minimal
- Chance of severe wind over 30 yrs
- —
Air-quality risk 3/10 · Minor
- Unhealthy air days now
- 3 days/yr
- Unhealthy air days in 30 yrs
- 3 days/yr
Risk factors via First Street. Map © Google.
Why this score? — see what drove the A- grade
The composite is a weighted blend of 9 inputs, each scored 0–100. Each bar is that input's sub-score; the figure is the points it added to the 100-point composite (weight × sub-score).
- Cash flow +30.0/30.0
- ARV discount +15.0/15.0
- 1% rule +10.0/10.0
- DSCR +10.0/10.0
- Schools +5.3/10.0
- Condition / age +4.0/5.0
- Livability +3.6/5.0
- Rent growth +2.3/5.0
- Appreciation +0.0/10.0
$86,500
🖨 Deal sheet 📄 Offer letter ✓ Due diligence
Listing remarks MLS
This is a MUST SEE! 2 bedroom fully remodeled home! Bright new vinyl Low- E windows. New kitchen cabinets with granite countertops! Stainless steel appliances! Home has new interior doors and hardware. Bathrooms have been remodeled. Panels were removed and sheet rock was installed plus old exterior siding was remodeled and new siding was installed. Tankless water heater! New paint and LVP flooring. Home sits in the Albuquerque Meadows over 55 living community. Incredible amenities at the community center. Come see what they offer! All residents intending to purchase must be 55+ and meet a minimum of 650 credit score. Buyer must complete application and be approved through Albuquerque Meadows. Park rent is $1030/month plus utilities at $45 base price + usage
Key facts
- New siding
- New kitchen cabinets
- Granite countertops
Tags
Neighborhood map
What this means for you Summary
Snapshot
- This is a 2-bed/2.0-bath manufactured listed at $86k. Condition is rated good.
Deal economics
- At list price, monthly cash flow is $869 ($10k/yr) — positive.
- The deal already cash-flows at list — no discount required.
- Meets the 1% rule at list price ($2k rent vs $86k).
- Recommended offer: $81k (6.0% below list) — sets the bar for market timing.
- Cap rate 18.3% vs local median 3.7% in Albuquerque — top-decile yield for the area; either an underpriced asset or a hidden risk that comps aren't pricing in. Stress-test before assuming the spread holds.
Location & tenants
- Location reads 72/100 on livability (#13 in NM) — a middle-class / working-renter tenant base. Strengths: amenities A+, commute A+, cost of living A+; Watch: schools D-, crime F.
- Albuquerque Public Schools (urban): math 51% / reading 75% proficiency, ranked #3 of 29 in NM (top 10%) — acceptable for families but not a draw, mixed tenant base, ~2y average lease; 60% free/reduced lunch — lower-income household profile, screen leases tightly.
- Market conditions: Rents soft (-1.0%/yr); 148 active listings in the ZIP; 14 comparable units currently listed for rent nearby; rentals leasing fast (median 3d on market — plan ~1-2 weeks tenant-placement turnaround); 1,316 units permitted in Bernalillo County in 2024 (546 in 5+ unit buildings).
- This rent runs 38% of the median local income ($59k/yr) — at the standard rent-burdened threshold; future hikes will face affordability resistance.
Forward outlook
- Local home prices are declining (-3.0%/yr); year-one equity from $598 of loan paydown is wiped out by about $3k of value loss. Plan a longer hold.
- At projected returns (-3.0% appreciation + 0.0% rent growth), your $24k cash investment doubles in ~3 years — after that, you're playing with house money.
Negotiation context
- It's been on market 77 days — a 6% lower offer ($81k) is reasonable based on typical stale-listing flexibility.
Questions for the listing agent
- It's been on market 77 days. Have you received any prior offers? Is the seller open to a 6% concession, seller financing, or rate buy-down credit?
- Built in 1975 — when were the roof, HVAC, electrical panel, plumbing, and water heater last replaced?
- Why hasn't it sold? Are there any deal-killer items the seller is aware of (foundation, flood, title, zoning, code violations)?
- Is there a deadline driving the sale (1031 exchange, divorce, estate, relocation)? That informs how much negotiation room exists.
- Schools are D-rated, which usually means shorter tenancies and higher turnover. Who's the typical renter profile here, and what's been the actual vacancy rate?
- Crime grade is F in this area — have there been break-ins, vandalism, or insurance claims at this property in the last 3 years? What carrier currently insures it and at what premium?
- What's the average days-on-market for RENTAL listings here right now (not sales)? A rising rental-DOM trend means longer vacancies and softer asking-rent achievability than the comps imply.
- What's the recent tenant-quality profile in this submarket — average credit score on applications, eviction rate, late-payment / NSF rate, and stable-employment percentage? A property-management company in the area should have these aggregated.
- How much new for-sale + rental construction is in the pipeline within 1–3 miles? Heavy new supply typically softens prices + rents 12–24 months out; constrained supply supports both.
Investment metrics
- 1% rule
- 2.15% ✓
- Cap rate
- 18.34%
- Cash-on-cash
- 43.04%
- DSCR
- 2.91
- GRM
- 3.9
CMA / ARV
- ARV (median comp)
- $130,000
- List price
- $86,500
- Delta
- -33.46%
- Verdict
- UNDERPRICED
- Comps
- 5 within 1.0 mi
Show comp detail 4 sales within ~0.75 mi
| Address | Dist | Beds/Ba | Sqft | Sold | Price | $/sf | Match |
|---|---|---|---|---|---|---|---|
| 7112 Pan American East NE Unit 345 | 0.00mi | 3/2.0 (+1) | 1,060 (-5%) | 2mo | $130,000 | $123 | 85 |
| 7112 Pan American NE #230 | 0.00mi | 2/3.0 | 980 (-12%) | 3mo | $15,000 | $15 | 73 |
| 6516 Pino Ave NE | 0.56mi | 3/2.0 (+1) | 1,237 (+10%) | 4mo | $219,900 | $178 | 48 |
| 6835 Jade Park Ave NE | 0.67mi | 2/2.0 | 1,230 (+10%) | 21mo | $229,900 | $187 | 35 |
Match score weights: distance 35% · size 25% · config 20% · recency 20%. Top-matched comps best support the ARV.
Projected returns pro-forma
-3.0% appreciation · 0.0% rent growth · sell at horizon
- IRR
- 36.4%
- Equity multiple
- 2.48×
- Total profit
- $35,896
- Equity at exit
- $12,897
- IRR
- 41.5%
- Equity multiple
- 4.37×
- Total profit
- $81,587
- Equity at exit
- $7,479
Cash invested: $24,220 (down + closing). Projections, not guarantees.
Landlord ↔ Tenant lean methodology
- Overall (STATE)
- 55 Moderately Landlord-Leaning
- State New Mexico
- 55 Moderately Landlord-Leaning · D+3
- County
- — inherits STATE
- City
- — inherits STATE
ZIP-level market 87109
- Rents YoY
- -1.0%
- Active inventory
- 148
- Price-to-rent
- 3.9×
Monthly cashflow live
- Estimated rent
- $1,856 high interval (Pro) →
- Mortgage (P&I)
- −$454
- Tax est. 1.5%
- −$108 /mo · $1,298/yr
- Insurance
- −$36
- HOA
- −$0
- Vacancy / Maint / Mgmt
- −$390
- Net cashflow
- $869
Break-even live
UW: 25.0% down · 7.5% · 30yr · 1.5% tax · 5.0% vac · 8.0% maint · 8.0% mgmt
Financing live
Cash to close
- Down payment
- $21,625
- Closing costs
- $2,595
- Reserves months
- —
- Total cash needed
- —
Loan-product check · same deal, 3 products live
Conventional
25% down · 7.5% · 30yr
- Down + closing
- —
- Monthly P&I
- —
- Monthly cashflow
- —
- DSCR
- —
- Eligible?
- —
Personal DTI + credit; lowest rate.
DSCR
20% down · 8.5% · 30yr
- Down + closing
- —
- Monthly P&I
- —
- Monthly cashflow
- —
- DSCR
- —
- Eligible?
- —
No personal income docs; deal must DSCR.
Hard money
10% down · 12.0% · 12mo
- Down + closing
- —
- Monthly P&I
- —
- Monthly cashflow
- —
- DSCR
- —
- Eligible?
- —
Short-term bridge; refi at stabilization.
Rent comps 14 comps
| Address | Beds | Baths | Sqft | Rent | $/sqft | DOM | Units | Dist |
|---|---|---|---|---|---|---|---|---|
| 6401 Santa Monica Ave NE Albuquerque, NM | 1.0–2.0 | 1.0–2.0 | 1068 | $2,151 | $2.01 | 3d | 26 | 0.35mi |
| 6501 San Antonio Dr NE Albuquerque, NM | 2.0 | 2.0–2.5 | 1075 | $1,875 | $1.74 | 14d | 2 | 0.55mi |
| 7501 Jefferson St NE Albuquerque, NM | 2.0 | 1.0–2.0 | 887 | $2,291 | $2.58 | 3d | 38 | 0.73mi |
| 7000 Louisiana Blvd NE Albuquerque, NM | 1.0–2.0 | 1.0–2.0 | 840 | $1,709 | $2.03 | 3d | 25 | 0.79mi |
| 7100 Louisiana Blvd NE Albuquerque, NM | 1.0–2.0 | 1.0–2.0 | 763 | $1,790 | $2.35 | 3d | 15 | 0.80mi |
| 7800 Headline Blvd NE Albuquerque, NM | 2.0 | 1.0–2.0 | 961 | $2,343 | $2.44 | 3d | 16 | 0.81mi |
| 6441 Palomas Ave NE Albuquerque, NM | 1.0 | 1.0–1.5 | 758 | $2,088 | $2.75 | 3d | 2 | 0.92mi |
| 6401 Academy Rd NE Albuquerque, NM | 3.0 | 1.0–2.0 | 808 | $1,560 | $1.93 | 3d | 16 | 0.97mi |
| 5741 Osuna Rd NE Albuquerque, NM | 1.0–2.0 | 1.0–2.0 | 769 | $1,565 | $2.03 | 3d | 17 | 1.01mi |
| 6500 Martin Ct NE Albuquerque, NM | 3.0 | 2.0 | 1376 | $2,850 | $2.07 | 43d | 1 | 1.05mi |
| 5828 Elmwood Dr NE Albuquerque, NM | 2.0 | 2.0 | 1236 | $1,790 | $1.45 | 23d | 1 | 1.11mi |
| 5800 Osuna Rd NE Albuquerque, NM | 1.0–2.0 | 1.0–2.0 | 820 | $1,555 | $1.90 | 3d | 23 | 1.20mi |
| 4949 San Pedro Dr NE Albuquerque, NM | 1.0–2.0 | 1.0–2.0 | 900 | $1,495 | $1.66 | 3d | 9 | 1.35mi |
| 5324 San Mateo Blvd NE Albuquerque, NM | 1.0–2.0 | 1.0–2.0 | 748 | $1,691 | $2.26 | 3d | 27 | 1.41mi |
Listing history 15 events
-
2026-06-18days on market $86,500 Active 77 DOM
-
2026-06-17days on market $86,500 Active 76 DOM
-
2026-06-16days on market $86,500 Active 75 DOM
-
2026-06-15days on market $86,500 Active 74 DOM
-
2026-06-13pricedays on market $86,500 Active 72 DOM
-
2026-06-10days on market $87,500 Active 69 DOM
-
2026-06-09days on market $87,500 Active 68 DOM
-
2026-06-08days on market $87,500 Active 67 DOM
-
2026-06-07days on market $87,500 Active 66 DOM
-
2026-06-05days on market $87,500 Active 63 DOM
-
2026-06-03days on market $87,500 Active 62 DOM
-
2026-06-02days on market $87,500 Active 61 DOM
-
2026-06-01days on market $87,500 Active 60 DOM
-
2026-05-31days on market $87,500 Active 59 DOM
-
2026-04-02$89,000 Active 767-char remark
Show marketing remark (767 chars)
This is a MUST SEE! 2 bedroom fully remodeled home! Bright new vinyl Low- E windows. New kitchen cabinets with granite countertops! Stainless steel appliances! Home has new interior doors and hardware. Bathrooms have been remodeled. Panels were removed and sheet rock was installed plus old exterior siding was remodeled and new siding was installed. Tankless water heater! New paint and LVP flooring. Home sits in the Albuquerque Meadows over 55 living community. Incredible amenities at the community center. Come see what they offer! All residents intending to purchase must be 55+ and meet a minimum of 650 credit score. Buyer must complete application and be approved through Albuquerque Meadows. Park rent is $1030/month plus utilities at $45 base price + usage
ⓘ Source: listings_history table (triggers on properties + properties_extension) + one-shot
backfill from property_details.listing_events for pre-trigger history.
Climate risk First Street
- Flood 4/10 Moderate FEMA zone X (unshaded) · 22% chance over 30 yrs
- Wildfire 1/10 Low
- Heat 4/10 Moderate 3 d/yr ≥95°F today · 7 d/yr by 30 yrs out
- Wind 1/10 Low
- Air quality 3/10 Moderate 3 unhealthy d/yr today · 3 by 30 yrs out
Nearby sold comps map
Loading sold comps map…
Walkable amenities ~0.75 mi
Loading nearby amenities…
Taxation est. · year 1
- Rental income
- $22,275
- − Mortgage interest
- −$4,845
- − Property taxes
- −$1,298
- − Insurance
- −$432
- − Repairs & maintenance
- −$1,782
- − Management
- −$1,782
- − Depreciation
- −$2,516
- Taxable income
- $9,619
- Est. tax owed @ 24.0%
- −$2,309
- After-tax cash flow
- $8,115/yr
For passive investors: Depreciation is non-cash, so a rental often shows a tax loss while cash-flowing — sheltering income. Rental losses are passive: they offset passive income freely, and up to $25,000/yr can offset ordinary (W-2) income if you actively participate and your MAGI is under $100k (phasing out to $0 by $150k); unused losses carry forward. On sale, claimed depreciation is recaptured at up to 25%, and gains may owe capital-gains tax (a 1031 exchange can defer both). Figures are a year-1 estimate at your 24.0% rate — not tax advice; consult a CPA.
Condition & rehab AI · 12 photos
This remodeled 2-bedroom, 2-bath manufactured home in Albuquerque Meadows is in good condition with fresh paint and new flooring, making it move-in ready for both resale and rental.
Value-add opportunities
- Resale Paint exterior trim — Enhances curb appeal
- Rental Replace outdoor light fixtures — Improves property presentation
Renovation cost estimate screening
Value-add ROI direction
- Resale Paint exterior trim — Enhances curb appeal ↑
- Rental Replace outdoor light fixtures — Improves property presentation ↑
ⓘ Cost ranges are severity-bucket heuristics (US national rule-of-thumb). Get contractor quotes + a written scope before underwriting a rehab budget.
Schools (NCES district)
- District
- Albuquerque Public Schools
- NCES district ID
- 3500060
- Math proficiency
- 51% ▲ 30.00%
- Reading proficiency
- 75% ▲ 45.00%
- Median HH income
- $48,151
- Composite
- 53.29/100
- National rank
- #1487
- State rank
- #3 of 29 in NM
Livability — Albuquerque
- Score
- 72/100
- State rank
- #13
- US rank
- #6219
Category grades
Schools grade is shown separately in the Schools card above.
Census & demographics
- Census place
- Albuquerque, NM
- County
- Bernalillo County · 647,165 people
- City population
- 647,165
- Metro
- Albuquerque, NM
- Population (ZIP)
- 39,324
- Household income
- $58,900
- Rent vs Own
- Severe rent burden
- 2187.0
Population outlook (Bernalillo County) Hauer SSP2
- Today (2025)
- 704,528 people
- By 2030
- 711,723 · +1.0%
- By 2040
- 714,522 · +1.4%
- By 2050
- 709,274 · +0.7%
- By 2075
- 680,015 · -3.5%
- By 2100
- 619,879 · -12.0%
Race, ethnicity, and origin ACS 2023
- Neighborhood character
- Diverse neighborhood (Simpson 0.64)
- Race & ethnicity
- White 47% Hispanic / Latino 36% Two or more races 17% Native American 9% Black 3% Asian 3%
- Hispanic origin (detail)
- Mexican 19%
- Common ancestry
- Lithuanian 2% Slovak 2% Portuguese 2%
- Foreign-born
- 7% · Canada, China
- Languages at home
- 84% English-only · Spanish 11% Other Indo-European 1%
Political lean MEDSL · Bernalillo
- 2024 margin
- Strong D (+21.0) · D 59.2% · R 38.2% · Other 2.6%
- 2008→2024 swing
- -0.3pp no change · 2008: 21.4pp · 2024: 21.0pp
- All cycles
- 2024: D+21.0 2020: D+24.4 2016: D+17.8 2012: D+16.2 2008: D+21.4
Not yet ingested
- Civics
- —
Market trends
- HPI YoY
- ▼ -303.11%
- Current HPI
- 250.5034
- Rent YoY
- ▼ -0.97%
- Metro
- Albuquerque, NM
- State GDP YoY
- —
- F500 in state
- 0
Price history
1 event — show timeline
- 2026-04-02 Listed $89,000 Southwest MLS
Cash-flow waterfall
monthlySold comps — $/sqft
last 12 mo · ≤1 miLoading sold comps…