1305 W Villa Maria Rd Unit B101 · Bryan, TX
Flood risk No data
- FEMA flood zone
- —
- Chance of flooding over 30 yrs
- —
- Est. flood insurance / yr
- —
Fire risk No data
- Est. fire insurance / yr
- —
Heat risk No data
- Hot days now (above threshold)
- —
- Hot days in 30 yrs
- —
Wind risk No data
- Chance of severe wind over 30 yrs
- —
Air-quality risk No data
- Unhealthy air days now
- —
- Unhealthy air days in 30 yrs
- —
Risk factors via First Street. Map © Google.
Why this score? — see what drove the C+ grade
The composite is a weighted blend of 9 inputs, each scored 0–100. Each bar is that input's sub-score; the figure is the points it added to the 100-point composite (weight × sub-score).
- Cash flow +23.4/30.0
- 1% rule +10.0/10.0
- DSCR +7.5/10.0
- ARV discount +7.5/15.0
- Livability +3.8/5.0
- Rent growth +2.7/5.0
- Schools +2.6/10.0
- Condition / age +2.5/5.0
- Appreciation +0.0/10.0
$90,000
🖨 Deal sheet 📄 Offer letter ✓ Due diligence
Listing remarks MLS
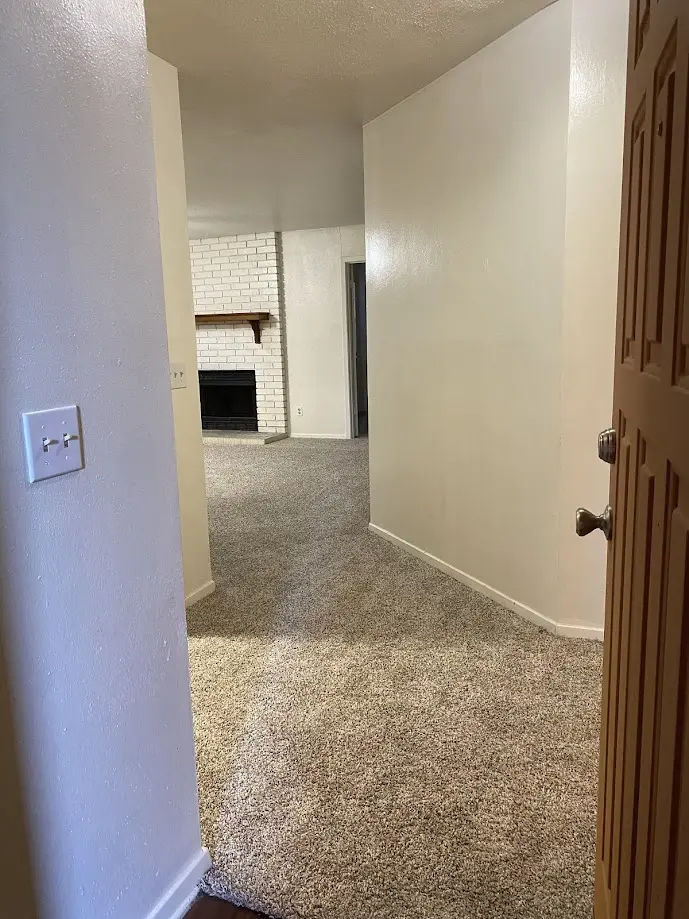
This condo is a 2 Bedroom/2 bath! Centrally located in the Bryan/College Station Area. The condos are located in the Oaks of Villa Maria, surrounded by large oak trees. The condos are near restaurants, shopping centers, and grocery stores.
Key facts
- Mature oak trees
- Centrally located
- Convenient access
Tags
Neighborhood map
What this means for you Summary
Snapshot
- This is a 2-bed/2.0-bath condo listed at $90k.
Deal economics
- At list price, monthly cash flow is $166 ($2k/yr) — positive.
- The deal already cash-flows at list — no discount required.
- Meets the 1% rule at list price ($2k rent vs $90k).
- Cap rate 8.5% vs local median 4.0% in Bryan — top-decile yield for the area; either an underpriced asset or a hidden risk that comps aren't pricing in. Stress-test before assuming the spread holds.
Location & tenants
- Location reads 76/100 on livability (#99 in TX, #3,341 nationally) — a middle-class / working-renter tenant base. Strengths: cost of living A+, housing A+, health & safety A+; Watch: schools C-, crime C-, amenities C-.
- Bryan ISD (urban): math 30% / reading 32% proficiency, ranked #608 of 826 in TX (top 74%) — families likely to look elsewhere, expect single-tenant / working-renter base with shorter leases; 68% free/reduced lunch — lower-income household profile, screen leases tightly.
- Market conditions: Rents flat; 122 active listings in the ZIP; 35 comparable units currently listed for rent nearby; rentals at typical pace (median 21d on market — plan ~3-4 weeks tenant-placement turnaround); 49% of comp listings sitting > 30 days — soft ceiling on asking rent; lower-income renter base — watch delinquency; 2,211 units permitted in Brazos County in 2024 (768 in 5+ unit buildings).
- At $1,511/mo this rent would consume 46% of the median local household income ($40k/yr) (locally 1465% of renters already pay >50% of income on rent) — very limited rent-growth headroom before tenants either downsize or default.
Forward outlook
- Local home prices are declining (-3.0%/yr); year-one equity from $622 of loan paydown is wiped out by about $3k of value loss. Plan a longer hold.
- Brazos County population projected at +55% by 2050 — long-run rental-demand tailwind backs the buy-and-hold thesis.
Negotiation context
- Only 9 days on market — expect competitive offers; lowballing is unlikely to land.
Risks & watch-outs
- Watch-outs: HOA is 26% of rent.
Questions for the listing agent
- What does the HOA fee cover, when was the last increase, and are there any pending special assessments or reserve-fund shortfalls?
- Any open or pending special assessments — roof, HVAC, plumbing, elevator, façade? What's the per-unit balance and payoff schedule, and is the seller paying it off at close or rolling it to the buyer?
- Is there a deadline driving the sale (1031 exchange, divorce, estate, relocation)? That informs how much negotiation room exists.
- What's the average days-on-market for RENTAL listings here right now (not sales)? A rising rental-DOM trend means longer vacancies and softer asking-rent achievability than the comps imply.
- What's the recent tenant-quality profile in this submarket — average credit score on applications, eviction rate, late-payment / NSF rate, and stable-employment percentage? A property-management company in the area should have these aggregated.
- How much new apartment / multifamily construction is in the pipeline within 1–3 miles? Heavy new supply (>2% of stock underway) typically softens rents 12–24 months out; light construction supports rent growth.
Investment metrics
- 1% rule
- 1.68% ✓
- Cap rate
- 8.50%
- Cash-on-cash
- 7.89%
- DSCR
- 1.35
- GRM
- 5.0
CMA / ARV
- ARV (median comp)
- $189,488
- List price
- $90,000
- Delta
- -50.92%
- Verdict
- UNDERPRICED
- Comps
- 4 within 1.0 mi
Projected returns pro-forma
-3.0% appreciation · 0.99% rent growth · sell at horizon
- IRR
- -7.5%
- Equity multiple
- 0.73×
- Total profit
- $-6,751
- Equity at exit
- $13,419
- IRR
- -2.0%
- Equity multiple
- 0.88×
- Total profit
- $-2,987
- Equity at exit
- $7,782
Cash invested: $25,200 (down + closing). Projections, not guarantees.
Landlord ↔ Tenant lean methodology
- Overall (STATE)
- 87 Strongly Landlord-Friendly
- State Texas
- 87 Strongly Landlord-Friendly · R+5
- County
- — inherits STATE
- City
- — inherits STATE
ZIP-level market 77801
- Home prices YoY
- -16.8%
- Rents YoY
- 1.0%
- Active inventory
- 122
- Price-to-rent
- 5.0×
Monthly cashflow live
- Estimated rent
- $1,511 high interval (Pro) →
- Mortgage (P&I)
- −$472
- Tax from tax record
- −$133 /mo · $1,592/yr
- Insurance
- −$38
- HOA
- −$386
- Vacancy / Maint / Mgmt
- −$317
- Net cashflow
- $166
Break-even live
UW: 25.0% down · 7.5% · 30yr · 1.5% tax · 5.0% vac · 8.0% maint · 8.0% mgmt
Financing live
Cash to close
- Down payment
- $22,500
- Closing costs
- $2,700
- Reserves months
- —
- Total cash needed
- —
Loan-product check · same deal, 3 products live
Conventional
25% down · 7.5% · 30yr
- Down + closing
- —
- Monthly P&I
- —
- Monthly cashflow
- —
- DSCR
- —
- Eligible?
- —
Personal DTI + credit; lowest rate.
DSCR
20% down · 8.5% · 30yr
- Down + closing
- —
- Monthly P&I
- —
- Monthly cashflow
- —
- DSCR
- —
- Eligible?
- —
No personal income docs; deal must DSCR.
Hard money
10% down · 12.0% · 12mo
- Down + closing
- —
- Monthly P&I
- —
- Monthly cashflow
- —
- DSCR
- —
- Eligible?
- —
Short-term bridge; refi at stabilization.
Rent comps 35 comps
| Address | Beds | Baths | Sqft | Rent | $/sqft | DOM | Units | Dist |
|---|---|---|---|---|---|---|---|---|
| 1437 Western Oaks Ct Bryan, TX | 3.0 | 3.0 | 1322 | $1,550 | $1.17 | 43d | 1 | 0.14mi |
| 1100 Verde Dr Unit 1100D Bryan, TX | 2.0 | 1.0 | 925 | $850 | $0.92 | 43d | 1 | 0.27mi |
| 1203 Webhollow Cir Bryan, TX | 3.0 | 2.0 | 1200 | $1,500 | $1.25 | 43d | 1 | 0.29mi |
| 941 Navidad St Unit 1328072P Bryan, TX | 2.0 | 2.0 | 1194 | $2,183 | $1.83 | 20d | 1 | 0.30mi |
| 2915 Forestwood Dr Bryan, TX | 3.0 | 2.0 | 1600 | $1,800 | $1.12 | 43d | 1 | 0.35mi |
| 3150 Finfeather Rd Bryan, TX | 1.0–2.0 | 1.0–2.0 | 917 | $1,490 | $1.62 | 13d | 9 | 0.40mi |
| 802 Frio Cir Bryan, TX | 2.0 | 1.0 | 900 | $1,275 | $1.42 | 44d | 1 | 0.43mi |
| 2406 Toro Ln Unit D Bryan, TX | 2.0 | 1.0 | 918 | $975 | $1.06 | 13d | 1 | 0.52mi |
| 1735 Rock Hollow Loop Bryan, TX | 3.0 | 2.0 | 1209 | $1,500 | $1.24 | 43d | 1 | 0.58mi |
| 1250 Croft Ln Unit 214 Bryan, TX | 3.0 | 2.0 | 1043 | $1,300 | $1.25 | 43d | 1 | 0.65mi |
| 1708 Beaver Pond Ct Unit 1328061P Bryan, TX | 3.0 | 2.0 | 1550 | $3,973 | $2.56 | 20d | 1 | 0.68mi |
| 3213 Link St Unit 112 Bryan, TX | 3.0 | 3.5 | 1854 | $2,400 | $1.29 | 43d | 1 | 0.73mi |
| 2511 Westwood Main Dr Bryan, TX | 3.0 | 2.0 | 1421 | $2,100 | $1.48 | 13d | 1 | 0.78mi |
| 2003 Rockwood Dr Bryan, TX | 3.0 | 2.0 | 1468 | $1,850 | $1.26 | 43d | 1 | 0.83mi |
| 138 Watson St Bryan, TX | 3.0 | 1.0 | 1104 | $1,200 | $1.09 | 20d | 1 | 0.98mi |
| 1114 Cottage Grove Cir Bryan, TX | 3.0 | 2.0 | 1061 | $1,750 | $1.65 | 43d | 1 | 1.02mi |
| 3921 Olive St Unit B Bryan, TX | 2.0 | 1.5 | 983 | $1,200 | $1.22 | 43d | 1 | 1.04mi |
| 852 N Harvey Mitchell Pkwy Bryan, TX | 1.0–2.0 | 1.0–2.0 | 857 | $1,555 | $1.81 | 13d | 1 | 1.08mi |
| 4312 Old College Rd Bryan, TX | 2.0 | 2.0 | 1180 | $1,250 | $1.06 | 43d | 1 | 1.16mi |
| 2707 Cliff St Bryan, TX | 2.0 | 1.0 | 940 | $1,200 | $1.28 | 43d | 1 | 1.17mi |
| 3105 Leonard Rd Bryan, TX | 1.0–2.0 | 1.0–2.0 | 857 | $1,555 | $1.81 | 13d | 1 | 1.18mi |
| 3802 College Main St #5 Bryan, TX | 2.0 | 1.0 | 1092 | $875 | $0.80 | 20d | 1 | 1.23mi |
| 4005 College Main St Bryan, TX | 3.0 | 2.0 | 1126 | $2,200 | $1.95 | 13d | 1 | 1.34mi |
| 411 Sulphur Springs Rd Bryan, TX | 2.0 | 1.0 | 936 | $900 | $0.96 | 43d | 1 | 1.34mi |
| 415 Sulphur Springs Rd Bryan, TX | 2.0 | 1.0 | 936 | $950 | $1.01 | 43d | 1 | 1.36mi |
| 2020 Turning Leaf Dr Bryan, TX | 3.0 | 2.0 | 1417 | $2,000 | $1.41 | 13d | 1 | 1.37mi |
| 501 Helena St Bryan, TX | 3.0 | 2.0 | 1424 | $2,200 | $1.54 | 20d | 1 | 1.39mi |
| 2010 Turning Leaf Dr Bryan, TX | 3.0 | 2.0 | 1423 | $2,000 | $1.41 | 13d | 1 | 1.40mi |
| 636 Clay St Unit 1328091P Bryan, TX | 3.0 | 3.0 | 1776 | $4,887 | $2.75 | 20d | 1 | 1.42mi |
| 632 Clay St Bryan, TX | 1.0 | 1.0 | 1758 | $700 | $0.40 | 43d | 1 | 1.42mi |
| 632 Clay St Unit B Bryan, TX | 1.0 | 1.0 | 1758 | $850 | $0.48 | 43d | 1 | 1.42mi |
| 632 Clay St Bryan, TX | 1.0 | 1.0 | 1758 | $700 | $0.40 | 13d | 1 | 1.42mi |
| 200 Rebecca St Bryan, TX | 2.0 | 1.0–2.0 | 950 | $830 | $0.87 | 13d | 8 | 1.43mi |
| 1803 S College Ave Bryan, TX | 3.0 | 3.0 | 1760 | $1,800 | $1.02 | 13d | 1 | 1.47mi |
| 502 Jefferson St Unit 1071602P Bryan, TX | 2.0 | 2.0 | 1614 | $3,228 | $2.00 | 13d | 1 | 1.47mi |
HOA detail condo
- Monthly dues
- $386 · $4,632/yr
- Assessments
- None detected in remarks — confirm with the listing agent.
Listing history 17 events
-
2026-06-18days on market $90,000 Active 9 DOM
-
2026-06-17days on market $90,000 Active 8 DOM
-
2026-06-16days on market $90,000 Active 7 DOM
-
2026-06-15days on market $90,000 Active 6 DOM
-
2026-06-14days on market $90,000 Active 4 DOM
-
2026-06-13days on market $90,000 Active 3 DOM
-
2026-06-10remarks 271-char remark
-
2026-06-10pricedays on market $90,000 Active 1 DOM
-
2026-06-09days on market $93,000 Active 130 DOM
-
2026-06-08days on market $93,000 Active 129 DOM
-
2026-06-07days on market $93,000 Active 128 DOM
-
2026-06-03days on market $93,000 Active 124 DOM
-
2026-06-02days on market $93,000 Active 123 DOM
-
2026-06-01days on market $93,000 Active 122 DOM
-
2026-05-31days on market $93,000 Active 121 DOM
-
2026-05-30days on market $93,000 Active 120 DOM
-
2026-01-30$93,000 Active 239-char remark
Show marketing remark (239 chars)
This condo is a 2 Bedroom/2 bath! Centrally located in the Bryan/College Station Area. The condos are located in the Oaks of Villa Maria, surrounded by large oak trees. The condos are near restaurants, shopping centers, and grocery stores.
ⓘ Source: listings_history table (triggers on properties + properties_extension) + one-shot
backfill from property_details.listing_events for pre-trigger history.
Tax reassessment forecast TX · Resets to sale price
- Current annual tax
- $1,592 · $133/mo
- Projected year-2 tax
- $1,647 · $137/mo
- Expected delta
- +$55/yr (+$5/mo · 3.4%)
ⓘ Screening estimate from a state-policy table — verify with the county assessor before closing.
Nearby sold comps map
Loading sold comps map…
Walkable amenities ~0.75 mi
Loading nearby amenities…
Taxation est. · year 1
- Rental income
- $18,136
- − Mortgage interest
- −$5,041
- − Property taxes
- −$1,592
- − Insurance
- −$450
- − Repairs & maintenance
- −$1,451
- − Management
- −$1,451
- − HOA
- −$4,632
- − Depreciation
- −$2,618
- Taxable income
- $900
- Est. tax owed @ 24.0%
- −$216
- After-tax cash flow
- $1,773/yr
For passive investors: Depreciation is non-cash, so a rental often shows a tax loss while cash-flowing — sheltering income. Rental losses are passive: they offset passive income freely, and up to $25,000/yr can offset ordinary (W-2) income if you actively participate and your MAGI is under $100k (phasing out to $0 by $150k); unused losses carry forward. On sale, claimed depreciation is recaptured at up to 25%, and gains may owe capital-gains tax (a 1031 exchange can defer both). Figures are a year-1 estimate at your 24.0% rate — not tax advice; consult a CPA.
Schools (NCES district)
- District
- Bryan ISD
- NCES district ID
- 4811790
- Math proficiency
- 30% ▼ -8.00%
- Reading proficiency
- 32% ▼ -3.00%
- Median HH income
- $41,895
- Composite
- 26.26/100
- National rank
- #7253
- State rank
- #608 of 826 in TX
Livability — Bryan
- Score
- 76/100
- State rank
- #99
- US rank
- #3341
Category grades
Schools grade is shown separately in the Schools card above.
Census & demographics
- Census place
- Bryan, TX
- County
- Brazos County · 233,400 people
- City population
- 101,772
- Metro
- College Station-Bryan, TX
- Population (ZIP)
- 15,461
- Household income
- $39,846
- Rent vs Own
- Severe rent burden
- 1465.0
Population outlook (Brazos County) Hauer SSP2
- Today (2025)
- 267,942 people
- By 2030
- 296,630 · +10.7%
- By 2040
- 354,560 · +32.3%
- By 2050
- 414,616 · +54.7%
- By 2075
- 562,158 · +109.8%
- By 2100
- 678,828 · +153.3%
Race, ethnicity, and origin ACS 2023
- Neighborhood character
- Diverse neighborhood (Simpson 0.68)
- Race & ethnicity
- Hispanic / Latino 41% White 34% Black 17% Two or more races 13% Asian 4% Native American 2%
- Hispanic origin (detail)
- Mexican 34%
- Common ancestry
- Slovak 2% Lithuanian 1% Italian 1%
- Foreign-born
- 16% · Canada
- Languages at home
- 68% English-only · Spanish 26% Other Indo-European 2% French/Haitian/Cajun 2%
Political lean MEDSL · Brazos
- 2024 margin
- Strong R (+24.9) · D 36.9% · R 61.7% · Other 1.4%
- 2008→2024 swing
- +4.1pp toward D · 2008: -28.9pp · 2024: -24.9pp
- All cycles
- 2024: R+24.9 2020: R+14.3 2016: R+23.7 2012: R+35.3 2008: R+28.9
Not yet ingested
- Civics
- —
Market trends
- HPI YoY
- ▼ -54.39%
- Current HPI
- 269.7483
- Rent YoY
- ▲ 0.99%
- Metro
- College Station-Bryan, TX
- State GDP YoY
- ▲ 3.95%
- F500 in state
- 110
Industry mix (Fortune 500 HQ in TX)
| Industry | F500 HQs | Revenue |
|---|---|---|
| Energy | 16 | $1,198B |
|
||
| Technology | 5 | $198B |
|
||
| Engineering / Construction | 4 | $72B |
|
||
| Energy Services | 3 | $60B |
|
||
| Utilities | 3 | $41B |
|
||
| Healthcare | 2 | $330B |
|
||
Price history
1 event — show timeline
- 2026-01-30 Listed $93,000 BCSRMLS
Property tax history
+0.9%/yrLatest (2025): $1,592 · -19.6% YoY. Source: county tax records.
Cash-flow waterfall
monthlySold comps — $/sqft
last 12 mo · ≤1 miLoading sold comps…