4640 E 68th St Unit 184 · Tulsa, OK
Flood risk No data
- FEMA flood zone
- —
- Chance of flooding over 30 yrs
- —
- Est. flood insurance / yr
- —
Fire risk No data
- Est. fire insurance / yr
- —
Heat risk No data
- Hot days now (above threshold)
- —
- Hot days in 30 yrs
- —
Wind risk No data
- Chance of severe wind over 30 yrs
- —
Air-quality risk No data
- Unhealthy air days now
- —
- Unhealthy air days in 30 yrs
- —
Risk factors via First Street. Map © Google.
Why this score? — see what drove the F grade
The composite is a weighted blend of 9 inputs, each scored 0–100. Each bar is that input's sub-score; the figure is the points it added to the 100-point composite (weight × sub-score).
- ARV discount +7.5/15.0
- 1% rule +6.6/10.0
- Cash flow +4.3/30.0
- Livability +3.8/5.0
- Schools +3.2/10.0
- Rent growth +2.7/5.0
- Condition / age +2.5/5.0
- DSCR +0.0/10.0
- Appreciation +0.0/10.0
$72,500
🖨 Deal sheet (PDF) 📄 Offer letter ✓ Due diligence
Listing remarks MLS
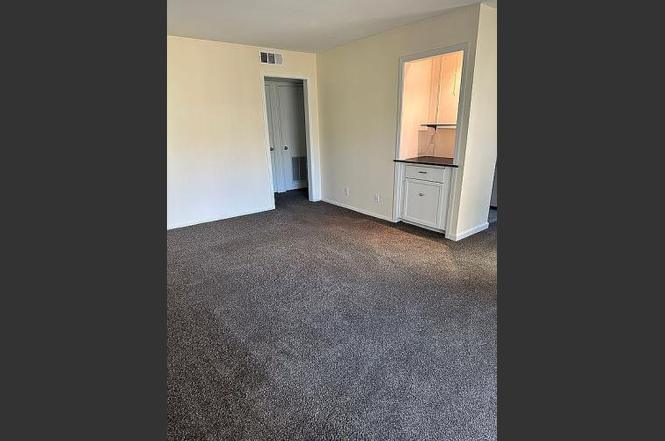
Updated first floor condo looking out at lovely courtyard on one side & swimming pool on other side. New: carpet, paint, step saver kitchen, W/ D & frig stay, ceiling fan, kitchen & bath flooring. Lots of light, huge closet. Stove & DW 2 yrs.
Key facts
- New furnace
- New hot water heater
- Updated kitchen
Tags
Neighborhood map
What this means for you Summary
Snapshot
- This is a 1-bed/1.0-bath condo listed at $72k.
Deal economics
- At list price, monthly cash flow is $-195 ($-2k/yr) — negative.
- The deal already cash-flows at list — no discount required.
- Meets the 1% rule at list price ($842 rent vs $72k).
- Recommended offer: $64k (12.0% below list) — sets the bar for market timing.
- Cap rate 3.1% vs local median 3.8% in Tulsa — below-typical yield; the buyer is paying a premium for something (appreciation thesis, condition, location) that the cap rate doesn't capture.
Location & tenants
- Location reads 75/100 on livability (#13 in OK, #4,058 nationally) — a middle-class / working-renter tenant base. Strengths: amenities A+, commute A+, cost of living A+; Watch: crime F, employment D-.
- Jenks (suburban): math 34% / reading 35% proficiency, ranked #27 of 270 in OK (top 10%) — families likely to look elsewhere, expect single-tenant / working-renter base with shorter leases.
- Zoned schools: Jenks East Es (math 29% / reading 20%, grade F, #354 of 845 statewide, top 47%, 1,443 students, 0% FRL); Jenks Ms (math 22% / reading 30%, grade F, #79 of 345 statewide, top 24%, 1,831 students, 0% FRL); Jenks Hs (math 40% / reading 49%, grade F, #15 of 447 statewide, top 4%, 3,547 students, 0% FRL) — zoned schools average 0% FRL vs 28% district-wide (28 pts lower); this property's tenant base skews higher-income than the district average.
- Market conditions: Rents flat; 173 active listings in the ZIP; 4 comparable units currently listed for rent nearby; rentals leasing fast (median 4d on market — plan ~1-2 weeks tenant-placement turnaround); 2,818 units permitted in Tulsa County in 2024 (518 in 5+ unit buildings).
Forward outlook
- Local home prices are declining (-3.0%/yr); year-one equity from $501 of loan paydown is wiped out by about $2k of value loss. Plan a longer hold.
- Tulsa County population projected at +30% by 2050 — long-run rental-demand tailwind backs the buy-and-hold thesis.
Negotiation context
- It's been on market 216 days — a 12% lower offer ($64k) is reasonable based on typical stale-listing flexibility.
- 2 sale attempts since 21y ago with the ask held roughly flat each time — persistent listings suggest the price (not the market) is what's stuck; bring a comps-based counter.
- Current owner paid $34k; list at $72k implies a 116% gain — meaningful room to come down on a strong offer.
Risks & watch-outs
- Watch-outs: HOA is 43% of rent.
Questions for the listing agent
- What do current leases actually rent for vs. the listed asking? Can we see a recent rent roll and the last 12 months of T-12 income?
- It's been on market 216 days. Have you received any prior offers? Is the seller open to a 12% concession, seller financing, or rate buy-down credit?
- Built in 1970 — when were the roof, HVAC, electrical panel, plumbing, and water heater last replaced?
- What does the HOA fee cover, when was the last increase, and are there any pending special assessments or reserve-fund shortfalls?
- Any open or pending special assessments — roof, HVAC, plumbing, elevator, façade? What's the per-unit balance and payoff schedule, and is the seller paying it off at close or rolling it to the buyer?
- Why hasn't it sold? Are there any deal-killer items the seller is aware of (foundation, flood, title, zoning, code violations)?
- Is there a deadline driving the sale (1031 exchange, divorce, estate, relocation)? That informs how much negotiation room exists.
- Schools are F-rated, which usually means shorter tenancies and higher turnover. Who's the typical renter profile here, and what's been the actual vacancy rate?
- Crime grade is F in this area — have there been break-ins, vandalism, or insurance claims at this property in the last 3 years? What carrier currently insures it and at what premium?
- The area grade is low — what's the realistic commute time and amenity access for the typical tenant pool here? Any planned neighborhood developments (good or bad) we should know about?
- What's the average days-on-market for RENTAL listings here right now (not sales)? A rising rental-DOM trend means longer vacancies and softer asking-rent achievability than the comps imply.
- What's the recent tenant-quality profile in this submarket — average credit score on applications, eviction rate, late-payment / NSF rate, and stable-employment percentage? A property-management company in the area should have these aggregated.
- How much new apartment / multifamily construction is in the pipeline within 1–3 miles? Heavy new supply (>2% of stock underway) typically softens rents 12–24 months out; light construction supports rent growth.
Investment metrics
- 1% rule
- 1.16% ✓
- Cap rate
- 3.07%
- Cash-on-cash
- -11.51%
- DSCR
- 0.49
- GRM
- 7.2
CMA / ARV
No comps found within radius.
Projected returns pro-forma
-3.0% appreciation · 0.74% rent growth · sell at horizon
- IRR
- -42.2%
- Equity multiple
- -0.27×
- Total profit
- $-25,789
- Equity at exit
- $10,810
- IRR
- —
- Equity multiple
- -1.21×
- Total profit
- $-44,823
- Equity at exit
- $6,268
Cash invested: $20,300 (down + closing). Projections, not guarantees.
Landlord ↔ Tenant lean methodology
- Overall (STATE)
- 83 Strongly Landlord-Friendly
- State Oklahoma
- 83 Strongly Landlord-Friendly · R+20
- County
- — inherits STATE
- City
- — inherits STATE
ZIP-level market 74136
- Home prices YoY
- -31.4%
- Rents YoY
- 0.7%
- Active inventory
- 173
- Price-to-rent
- 7.2×
Monthly cashflow live
- Estimated rent
- $842 medium interval (Pro) →
- Mortgage (P&I)
- −$380
- Tax est. 1.5%
- −$91 /mo · $1,088/yr
- Insurance
- −$30
- HOA est. from 7 same-building comps
- −$359
- Vacancy / Maint / Mgmt
- −$177
- Net cashflow
- $-195
Break-even live
Sensitivity live
| Price | -10% $-145 | -5% $-170 | +0% $-195 | +5% $-220 | +10% $-245 |
|---|---|---|---|---|---|
| Rent | -10% $-261 | -5% $-228 | +0% $-195 | +5% $-161 | +10% $-128 |
| Rate | -1.0pp $-158 | -0.5pp $-176 | base $-195 | +0.5pp $-214 | +1.0pp $-233 |
UW: 25.0% down · 7.5% · 30yr · 1.5% tax · 5.0% vac · 8.0% maint · 8.0% mgmt
Financing live
Cash to close
- Down payment
- $18,125
- Closing costs
- $2,175
- Reserves months
- —
- Total cash needed
- —
Loan-product check · same deal, 3 products live
Conventional
25% down · 7.5% · 30yr
- Down + closing
- —
- Monthly P&I
- —
- Monthly cashflow
- —
- DSCR
- —
- Eligible?
- —
Personal DTI + credit; lowest rate.
DSCR
20% down · 8.5% · 30yr
- Down + closing
- —
- Monthly P&I
- —
- Monthly cashflow
- —
- DSCR
- —
- Eligible?
- —
No personal income docs; deal must DSCR.
Hard money
10% down · 12.0% · 12mo
- Down + closing
- —
- Monthly P&I
- —
- Monthly cashflow
- —
- DSCR
- —
- Eligible?
- —
Short-term bridge; refi at stabilization.
Rent comps 4 comps
| Address | Beds | Baths | Sqft | Rent | $/sqft | DOM | Units | Dist |
|---|---|---|---|---|---|---|---|---|
| 7110 S Granite Ave Tulsa, OK | 2.0 | 1.0 | 675 | $949 | $1.41 | 3d | 21 | 0.66mi |
| 5808 E 71st St Tulsa, OK | 1.0–2.0 | 1.0–2.0 | 800 | $817 | $1.02 | 3d | 27 | 0.95mi |
| 5202 E 81st St Tulsa, OK | 1.0–3.0 | 1.0–2.0 | 1029 | $969 | $0.94 | 4d | 38 | 1.43mi |
| 5160 S Yale Ave Tulsa, OK | 1.0–2.0 | 1.0–2.0 | 925 | $775 | $0.84 | 5d | 6 | 1.47mi |
HOA detail condo
- Monthly dues
- $0 · $0/yr
- Likely covers
- pool
- Assessments
- None detected in remarks — confirm with the listing agent.
Listing history 20 events
-
2026-06-21days on market $72,500 Active 216 DOM
-
2026-06-18days on market $72,500 Active 213 DOM
-
2026-06-17days on market $72,500 Active 212 DOM
-
2026-06-16days on market $72,500 Active 211 DOM
-
2026-06-15days on market $72,500 Active 210 DOM
-
2026-06-13days on market $72,500 Active 208 DOM
-
2026-06-13days on market $72,500 Active 207 DOM
-
2026-06-10days on market $72,500 Active 205 DOM
-
2026-06-09days on market $72,500 Active 204 DOM
-
2026-06-08days on market $72,500 Active 203 DOM
-
2026-06-07days on market $72,500 Active 202 DOM
-
2026-06-05days on market $72,500 Active 199 DOM
-
2026-06-03days on market $72,500 Active 198 DOM
-
2026-06-02days on market $72,500 Active 197 DOM
-
2026-06-01days on market $72,500 Active 196 DOM
-
2026-05-31days on market $72,500 Active 195 DOM
-
2025-11-13$72,500 Active
-
2005-09-15soldstatus $33,500 266-char remark
Show marketing remark (266 chars)
Updated first floor condo looking out at lovely courtyard on one side & swimming pool on other side. New: carpet, paint, step saver kitchen, W/ D & frig stay, ceiling fan, kitchen & bath flooring. Lots of light, huge closet. Stove & DW 2 yrs.
-
2005-08-29historical 266-char remark
Show marketing remark (266 chars)
Updated first floor condo looking out at lovely courtyard on one side & swimming pool on other side. New: carpet, paint, step saver kitchen, W/ D & frig stay, ceiling fan, kitchen & bath flooring. Lots of light, huge closet. Stove & DW 2 yrs.
-
2005-06-16$35,000 266-char remark
Show marketing remark (266 chars)
Updated first floor condo looking out at lovely courtyard on one side & swimming pool on other side. New: carpet, paint, step saver kitchen, W/ D & frig stay, ceiling fan, kitchen & bath flooring. Lots of light, huge closet. Stove & DW 2 yrs.
ⓘ Source: listings_history table (triggers on properties + properties_extension) + one-shot
backfill from property_details.listing_events for pre-trigger history.
Nearby sold comps map
Loading sold comps map…
Walkable amenities ~0.75 mi
Loading nearby amenities…
Taxation est. · year 1
- Rental income
- $10,106
- − Mortgage interest
- −$4,061
- − Property taxes
- −$1,088
- − Insurance
- −$362
- − Repairs & maintenance
- −$808
- − Management
- −$808
- − HOA
- −$4,308
- − Depreciation
- −$2,109
- Taxable loss
- −$3,439
- Est. tax savings @ 24.0%
- +$825
- After-tax cash flow
- $-1,511/yr
For passive investors: Depreciation is non-cash, so a rental often shows a tax loss while cash-flowing — sheltering income. Rental losses are passive: they offset passive income freely, and up to $25,000/yr can offset ordinary (W-2) income if you actively participate and your MAGI is under $100k (phasing out to $0 by $150k); unused losses carry forward. On sale, claimed depreciation is recaptured at up to 25%, and gains may owe capital-gains tax (a 1031 exchange can defer both). Figures are a year-1 estimate at your 24.0% rate — not tax advice; consult a CPA.
Schools (NCES district)
- District
- Jenks
- NCES district ID
- 4015720
- Math proficiency
- 34% ▼ -9.00%
- Reading proficiency
- 35% ▼ -8.00%
- Median HH income
- $66,291
- Composite
- 31.5/100
- National rank
- #5973
- State rank
- #27 of 270 in OK
Livability — Tulsa
- Score
- 75/100
- State rank
- #13
- US rank
- #4058
Category grades
Schools grade is shown separately in the Schools card above.
Census & demographics
- Census place
- Tulsa, OK
- County
- Tulsa County · 640,811 people
- City population
- 389,418
- Metro
- Tulsa, OK
- Population (ZIP)
- 31,416
- Household income
- $51,820
- Rent vs Own
- Severe rent burden
- 2579.0
Population outlook (Tulsa County) Hauer SSP2
- Today (2025)
- 723,846 people
- By 2030
- 766,033 · +5.8%
- By 2040
- 851,386 · +17.6%
- By 2050
- 938,389 · +29.6%
- By 2075
- 1,166,011 · +61.1%
- By 2100
- 1,350,277 · +86.5%
Race, ethnicity, and origin ACS 2023
- Neighborhood character
- Diverse neighborhood (Simpson 0.66)
- Race & ethnicity
- White 55% Black 16% Two or more races 13% Hispanic / Latino 10% Asian 7% Native American 2%
- Hispanic origin (detail)
- Mexican 6%
- Common ancestry
- Slovak 2% Lithuanian 2% Italian 1%
- Foreign-born
- 14% · Canada, Philippines
- Languages at home
- 83% English-only · Spanish 8% Other Asian/Pacific 5% Other Indo-European 1%
Political lean MEDSL · Tulsa
- 2024 margin
- R (+15.2) · D 41.3% · R 56.5% · Other 2.2%
- 2008→2024 swing
- +9.2pp toward D · 2008: -24.5pp · 2024: -15.2pp
- All cycles
- 2024: R+15.2 2020: R+15.6 2016: R+22.9 2012: R+27.4 2008: R+24.5
Not yet ingested
- Civics
- —
Market trends
- HPI YoY
- ▼ -98.51%
- Current HPI
- 215.3642
- Rent YoY
- ▲ 0.74%
- Metro
- Tulsa, OK
- State GDP YoY
- ▲ 1.55%
- F500 in state
- 6
Industry mix (Fortune 500 HQ in OK)
| Industry | F500 HQs | Revenue |
|---|---|---|
| Energy | 3 | $48B |
|
||
Price history
+107.1% since first listed4 events — show timeline
- 2025-11-13 Listed $72,500 Fizber.com
- 2005-09-15 Sold (MLS) $33,500 MLS Technology, Inc.
- 2005-08-29 Listing Removed — MLS Technology, Inc.
- 2005-06-16 Listed $35,000 MLS Technology, Inc.
Cash-flow waterfall
monthlySold comps — $/sqft
last 12 mo · ≤1 miLoading sold comps…