120 Maple Crest Cir · Surgoinsville, TN
Flood risk 1/10 · Minimal
- FEMA flood zone
- X (unshaded)
- Chance of flooding over 30 yrs
- 0.0%
- Est. flood insurance / yr
- $473 – $860
Fire risk 7/10 · Major
- Est. fire insurance / yr
- $949 – $1,763
Heat risk 4/10 · Minor
- Hot days now (above 101°F)
- 6 days/yr
- Hot days in 30 yrs
- 16 days/yr
Wind risk 2/10 · Minimal
- Chance of severe wind over 30 yrs
- —
Air-quality risk 2/10 · Minimal
- Unhealthy air days now
- 2 days/yr
- Unhealthy air days in 30 yrs
- 2 days/yr
Risk factors via First Street. Map © Google.
Why this score? — see what drove the D+ grade
The composite is a weighted blend of 9 inputs, each scored 0–100. Each bar is that input's sub-score; the figure is the points it added to the 100-point composite (weight × sub-score).
- Cash flow +15.5/30.0
- Appreciation +7.7/10.0
- ARV discount +7.5/15.0
- DSCR +4.8/10.0
- 1% rule +3.0/10.0
- Livability +3.0/5.0
- Rent growth +2.5/5.0
- Condition / age +2.5/5.0
- Schools +2.0/10.0
$275,000
🖨 Deal sheet 📄 Offer letter ✓ Due diligence
Listing remarks
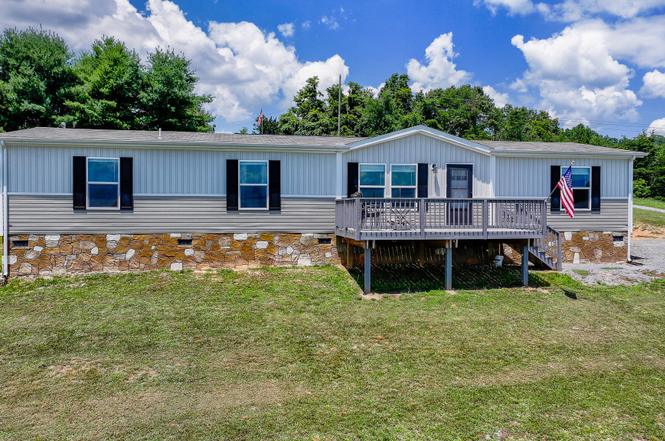
Welcome to this stunning, brand-new manufactured home, perfectly positioned on a sprawling 1.58-acre lot. This spacious residence features four generously sized bedrooms and two modern bathrooms, offering ample room for family and guests alike. Enjoy peace of mind with an active home warranty that remains in effect for another two years, ensuring comfort and security in your new abode. Step outside to take in breathtaking mountain views and savor the serene tranquility of the foothills. Whether you're relaxing indoors or embracing the beauty of your natural surroundings, this home promises a harmonious blend of comfort, privacy, and picturesque scenery. Experience the best of quiet country
Key facts
- 1.58-acre lot
- Mountain views
- 1.58 acre lot
Tags
Property features AI
Finance
- Other: Zoned residential; Lot approximately 1.58 acres
Exterior
- Utilities: Public water; Septic tank sewer
- Home design: Manufactured house; Single-family residence; One story
- Construction: Vinyl siding; Includes a home warranty; Built as a manufactured home
- Exterior features: Shingle roof; Rolling slope lot; Has a view
Interior
- Kitchen: Dishwasher; Microwave; Range; Refrigerator
- Bathrooms: 2 full bathrooms
- Interior features: Dishwasher; Microwave; Range; Refrigerator; Has central air conditioning; Heat pump heating; Total of 8 rooms
- Laundry & utility: Washer hookup; Electric dryer hookup
Neighborhood map
What this means for you Summary
Snapshot
- This is a 4-bed/2.0-bath manufactured listed at $275k.
Deal economics
- At list price, monthly cash flow is $109 ($1k/yr) — positive.
- The deal already cash-flows at list — no discount required.
- To meet the 1% rule (rent ≥ 1% of price), the offer needs to be $220k (20.1% below list).
- Recommended offer: $220k (20.1% below list) — sets the bar for 1% rule.
- Cap rate 6.8% vs local median 4.5% in Surgoinsville — top-decile yield for the area; either an underpriced asset or a hidden risk that comps aren't pricing in. Stress-test before assuming the spread holds.
Location & tenants
- Location reads 60/100 on livability (#270 in TN) — a middle-class / working-renter tenant base. Strengths: cost of living A+, housing A, crime B; Watch: amenities F, commute F, employment D-.
- Hawkins County (rural): math 23% / reading 26% proficiency, ranked #93 of 139 in TN (top 67%) — low school quality limits family demand, transient renter base, plan for 1-2y turnover.
- Zoned schools: Surgoinsville Elementary (math 27% / reading 37%, grade F, #369 of 952 statewide, top 42%, 328 students, 0% FRL); Surgoinsville Middle School (math 31% / reading 29%, grade F, #98 of 333 statewide, top 32%, 255 students, 0% FRL); Volunteer High School (math 19% / reading 37%, grade F, #101 of 332 statewide, top 30%, 1,045 students, 0% FRL) — zoned schools average 0% FRL vs 57% district-wide (57 pts lower); this property's tenant base skews higher-income than the district average.
- Market conditions: 26 active listings in the ZIP; 151 units permitted in Hawkins County in 2024 (0 in 5+ unit buildings).
Forward outlook
- In year one you build about $17k of equity ($2k loan paydown + $15k appreciation (5.3% local appreciation)).
- Hawkins County population projected at -17% by 2050 — secular population decline; favor cash flow + early exit over multi-decade hold.
- At projected returns (5.3% appreciation + 3.0% rent growth), your $77k cash investment doubles in ~4 years — after that, you're playing with house money.
- By year 3, paydown + projected appreciation supports a ~$41k cash-out refi (75% LTV) — recoverable capital for the next deal without selling this one.
Negotiation context
- It's been on market 346 days — a 12% lower offer ($242k) is reasonable based on typical stale-listing flexibility.
- 2 sale attempts; this cycle's ask has dropped $75k (21%) from the opening price — seller is motivated, your offer sets the floor, not the list.
Risks & watch-outs
- Climate carrying-cost: major wildfire risk — expect insurance premiums to compound above CPI over the hold.
Questions for the listing agent
- It's been on market 346 days. Have you received any prior offers? Is the seller open to a 20% concession, seller financing, or rate buy-down credit?
- Why hasn't it sold? Are there any deal-killer items the seller is aware of (foundation, flood, title, zoning, code violations)?
- Is there a deadline driving the sale (1031 exchange, divorce, estate, relocation)? That informs how much negotiation room exists.
- Schools are F-rated, which usually means shorter tenancies and higher turnover. Who's the typical renter profile here, and what's been the actual vacancy rate?
- The area grade is low — what's the realistic commute time and amenity access for the typical tenant pool here? Any planned neighborhood developments (good or bad) we should know about?
- What's the average days-on-market for RENTAL listings here right now (not sales)? A rising rental-DOM trend means longer vacancies and softer asking-rent achievability than the comps imply.
- What's the recent tenant-quality profile in this submarket — average credit score on applications, eviction rate, late-payment / NSF rate, and stable-employment percentage? A property-management company in the area should have these aggregated.
- How much new for-sale + rental construction is in the pipeline within 1–3 miles? Heavy new supply typically softens prices + rents 12–24 months out; constrained supply supports both.
Investment metrics
- 1% rule
- 0.80% ✗
- Cap rate
- 6.77%
- Cash-on-cash
- 1.70%
- DSCR
- 1.08
- GRM
- 10.4
CMA / ARV
No comps found within radius.
Projected returns pro-forma
5.35% appreciation · 3.0% rent growth · sell at horizon
- IRR
- 15.2%
- Equity multiple
- 1.98×
- Total profit
- $75,753
- Equity at exit
- $161,748
- IRR
- 15.5%
- Equity multiple
- 3.86×
- Total profit
- $220,299
- Equity at exit
- $284,168
Cash invested: $77,000 (down + closing). Projections, not guarantees.
Landlord ↔ Tenant lean methodology
- Overall (STATE)
- 87 Strongly Landlord-Friendly
- State Tennessee
- 87 Strongly Landlord-Friendly · R+13
- County
- — inherits STATE
- City
- — inherits STATE
ZIP-level market 37873
- Home prices YoY
- 1.6%
- Active inventory
- 26
- Price-to-rent
- 10.4×
Monthly cashflow live
- Estimated rent
- $2,197 medium interval (Pro) →
- Mortgage (P&I)
- −$1,442
- Tax from tax record
- −$70 /mo · $841/yr
- Insurance
- −$115
- HOA
- −$0
- Vacancy / Maint / Mgmt
- −$461
- Net cashflow
- $109
Break-even live
UW: 25.0% down · 7.5% · 30yr · 1.5% tax · 5.0% vac · 8.0% maint · 8.0% mgmt
Financing live
Cash to close
- Down payment
- $68,750
- Closing costs
- $8,250
- Reserves months
- —
- Total cash needed
- —
Loan-product check · same deal, 3 products live
Conventional
25% down · 7.5% · 30yr
- Down + closing
- —
- Monthly P&I
- —
- Monthly cashflow
- —
- DSCR
- —
- Eligible?
- —
Personal DTI + credit; lowest rate.
DSCR
20% down · 8.5% · 30yr
- Down + closing
- —
- Monthly P&I
- —
- Monthly cashflow
- —
- DSCR
- —
- Eligible?
- —
No personal income docs; deal must DSCR.
Hard money
10% down · 12.0% · 12mo
- Down + closing
- —
- Monthly P&I
- —
- Monthly cashflow
- —
- DSCR
- —
- Eligible?
- —
Short-term bridge; refi at stabilization.
Listing history 29 events
-
2026-06-19days on market $275,000 Active 346 DOM
-
2026-06-18days on market $275,000 Active 345 DOM
-
2026-06-17days on market $275,000 Active 344 DOM
-
2026-06-16days on market $275,000 Active 343 DOM
-
2026-06-15days on market $275,000 Active 342 DOM
-
2026-06-14days on market $275,000 Active 340 DOM
-
2026-06-13days on market $275,000 Active 339 DOM
-
2026-06-10days on market $275,000 Active 337 DOM
-
2026-06-09days on market $275,000 Active 336 DOM
-
2026-06-08days on market $275,000 Active 335 DOM
-
2026-06-07days on market $275,000 Active 334 DOM
-
2026-06-05days on market $275,000 Active 331 DOM
-
2026-06-02days on market $275,000 Active 329 DOM
-
2026-06-01days on market $275,000 Active 328 DOM
-
2026-05-31days on market $275,000 Active 327 DOM
-
2026-05-30days on market $275,000 Active 326 DOM
-
2026-05-19status Active
-
2026-04-27historical Active Under Contract
-
2026-03-30price $275,000
-
2026-03-21price $280,000
-
2026-02-18price $285,000
-
2026-02-10price $295,000
-
2026-01-05price $300,000
-
2025-10-13price $307,500
-
2025-09-27price $310,000
-
2025-09-09price $320,000
-
2025-08-26price $330,000
-
2025-07-31price $340,000
-
2025-07-08$350,000 Active
ⓘ Source: listings_history table (triggers on properties + properties_extension) + one-shot
backfill from property_details.listing_events for pre-trigger history.
Tax reassessment forecast TN · Resets to sale price
- Current annual tax
- $841 · $70/mo
- Projected year-2 tax
- $1,952 · $163/mo
- Expected delta
- +$1,112/yr (+$93/mo · 132.2%)
ⓘ Screening estimate from a state-policy table — verify with the county assessor before closing.
Climate risk First Street
- Flood 1/10 Low FEMA zone X (unshaded) · 0% chance over 30 yrs
- Wildfire 7/10 Severe
- Heat 4/10 Moderate 6 d/yr ≥101°F today · 16 d/yr by 30 yrs out
- Wind 2/10 Low
- Air quality 2/10 Low 2 unhealthy d/yr today · 2 by 30 yrs out
Nearby sold comps map
Loading sold comps map…
Walkable amenities ~0.75 mi
Loading nearby amenities…
Taxation est. · year 1
- Rental income
- $26,368
- − Mortgage interest
- −$15,404
- − Property taxes
- −$841
- − Insurance
- −$1,375
- − Repairs & maintenance
- −$2,109
- − Management
- −$2,109
- − Depreciation
- −$8,000
- Taxable loss
- −$3,471
- Est. tax savings @ 24.0%
- +$833
- After-tax cash flow
- $2,142/yr
For passive investors: Depreciation is non-cash, so a rental often shows a tax loss while cash-flowing — sheltering income. Rental losses are passive: they offset passive income freely, and up to $25,000/yr can offset ordinary (W-2) income if you actively participate and your MAGI is under $100k (phasing out to $0 by $150k); unused losses carry forward. On sale, claimed depreciation is recaptured at up to 25%, and gains may owe capital-gains tax (a 1031 exchange can defer both). Figures are a year-1 estimate at your 24.0% rate — not tax advice; consult a CPA.
Schools (NCES district)
- District
- Hawkins County
- NCES district ID
- 4701740
- Math proficiency
- 23% ▼ -9.00%
- Reading proficiency
- 26% ▼ -6.00%
- Median HH income
- $37,555
- Composite
- 20.45/100
- National rank
- #8581
- State rank
- #93 of 139 in TN
Livability — Surgoinsville
- Score
- 60/100
- State rank
- #270
- US rank
- #19003
Category grades
Schools grade is shown separately in the Schools card above.
Census & demographics
- Population (ZIP)
- 4,446
Population outlook (Hawkins County) Hauer SSP2
- Today (2025)
- 55,226 people
- By 2030
- 53,784 · -2.6%
- By 2040
- 50,015 · -9.4%
- By 2050
- 45,682 · -17.3%
- By 2075
- 36,211 · -34.4%
- By 2100
- 26,536 · -52.0%
Race, ethnicity, and origin ACS 2023
- Neighborhood character
- Predominantly White (94%)
- Race & ethnicity
- White 94% Two or more races 4% Hispanic / Latino 3%
- Common ancestry
- Lithuanian 1% Italian 1% Slovak 1%
- Foreign-born
- 1%
- Languages at home
- 99% English-only · Spanish 1%
Political lean MEDSL · Hawkins
- 2024 margin
- Solid R (+68.8) · D 15.2% · R 84.0%
- 2008→2024 swing
- -26.9pp toward R · 2008: -42.0pp · 2024: -68.8pp
- All cycles
- 2024: R+68.8 2020: R+65.8 2016: R+63.4 2012: R+47.0 2008: R+42.0
Not yet ingested
- Civics
- —
Market trends
- HPI YoY
- ▲ 5.35%
- Current HPI
- 345.0544
- Rent YoY
- —
- Metro
- —
- State GDP YoY
- ▲ 2.78%
- F500 in state
- 22
Industry mix (Fortune 500 HQ in TN)
| Industry | F500 HQs | Revenue |
|---|---|---|
| Healthcare | 3 | $91B |
|
||
| Retail | 3 | $72B |
|
||
| Transportation / Logistics | 1 | $88B |
|
||
| Paper / Packaging | 1 | $19B |
|
||
| Insurance | 1 | $13B |
|
||
| Energy | 1 | $12B |
|
||
Price history
-21.4% since first listed13 events — show timeline
- 2026-05-19 Relisted — TVRMLS
- 2026-04-27 Contingent — TVRMLS
- 2026-03-30 Price Changed $275,000 TVRMLS
- 2026-03-21 Price Changed $280,000 TVRMLS
- 2026-02-18 Price Changed $285,000 TVRMLS
- 2026-02-10 Price Changed $295,000 TVRMLS
- 2026-01-05 Price Changed $300,000 TVRMLS
- 2025-10-13 Price Changed $307,500 TVRMLS
- 2025-09-27 Price Changed $310,000 TVRMLS
- 2025-09-09 Price Changed $320,000 TVRMLS
- 2025-08-26 Price Changed $330,000 TVRMLS
- 2025-07-31 Price Changed $340,000 TVRMLS
- 2025-07-08 Listed $350,000 TVRMLS
Property tax history
+0.0%/yrLatest (2025): $841 · +0.0% YoY. Source: county tax records.
Cash-flow waterfall
monthlySold comps — $/sqft
last 12 mo · ≤1 miLoading sold comps…