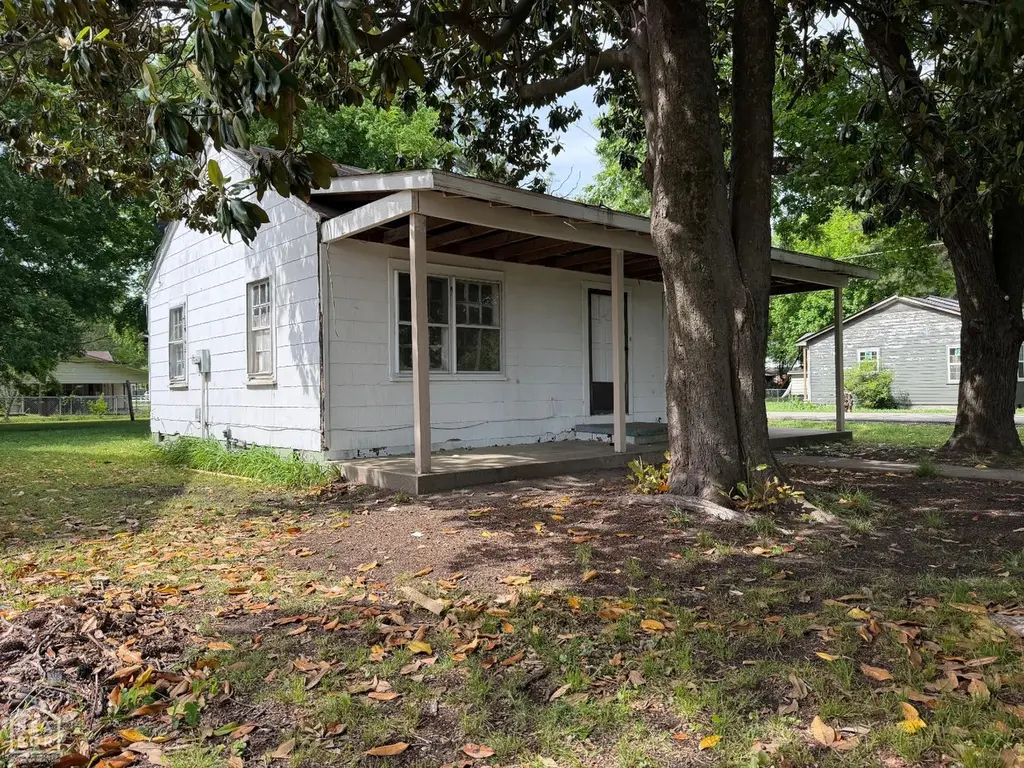
201 Haywood · Manila, AR
Flood risk 1/10 · Minimal
- FEMA flood zone
- X (shaded)
- Chance of flooding over 30 yrs
- 0.0%
- Est. flood insurance / yr
- $507 – $1,088
Fire risk 1/10 · Minimal
- Est. fire insurance / yr
- $1,499 – $2,785
Heat risk 6/10 · Moderate
- Hot days now (above 109°F)
- 7 days/yr
- Hot days in 30 yrs
- 20 days/yr
Wind risk 4/10 · Minor
- Chance of severe wind over 30 yrs
- 10.0%
Air-quality risk 1/10 · Minimal
- Unhealthy air days now
- 0 days/yr
- Unhealthy air days in 30 yrs
- 0 days/yr
Risk factors via First Street. Map © Google.
Why this score? — see what drove the B+ grade
The composite is a weighted blend of 9 inputs, each scored 0–100. Each bar is that input's sub-score; the figure is the points it added to the 100-point composite (weight × sub-score).
- Cash flow +30.0/30.0
- ARV discount +15.0/15.0
- 1% rule +10.0/10.0
- DSCR +10.0/10.0
- Livability +3.5/5.0
- Schools +3.2/10.0
- Rent growth +2.5/5.0
- Condition / age +2.5/5.0
- Appreciation +0.0/10.0
$45,000
🖨 Deal sheet 📄 Offer letter ✓ Due diligence
Listing remarks
Investor special in the heart of Manila! Located at 201 Haywood, Manila, AR, this 936 sq. ft. home offers 2 bedrooms, 1 bathroom, and LOADS of potential for the right buyer. Whether you're looking to add another project to your rental portfolio, tackle your next fix-and-flip, or scoop up an affordable property with upside, this one is worth a look. This home is ideal for an investor or cash buyer ready to roll up their sleeves and bring new life to it. Opportunities like this can be hard to find in this price range, especially with the potential to create value. Property is being sold AS-IS, WHERE-IS. No property disclosure will be provided. This property will NOT qualify for FHA, RD, or VA
Key facts
- 7,405 sq ft lot
- Garage
- Built 1962
Property features AI
Exterior
- Parking: 1-car garage
- Utilities: Public water; Public sewer
- Home design: Single-family residence
- Construction: Residential single family property
- Exterior features: 0.17-acre lot
Interior
- Bathrooms: 1 full bathroom
- Interior features: Living room fireplace
Neighborhood map
What this means for you Summary
Snapshot
- This is a 2-bed/1.0-bath single-family listed at $45k.
Deal economics
- At list price, monthly cash flow is $553 ($7k/yr) — positive.
- The deal already cash-flows at list — no discount required.
- Meets the 1% rule at list price ($1k rent vs $45k).
- Recommended offer: $44k (3.0% below list) — sets the bar for market timing.
- Cap rate 21.0% vs local median 2.9% in Manila — top-decile yield for the area; either an underpriced asset or a hidden risk that comps aren't pricing in. Stress-test before assuming the spread holds.
Location & tenants
- Location reads 69/100 on livability (#62 in AR) — a middle-class / working-renter tenant base. Strengths: cost of living A+, housing A+, health & safety A+; Watch: crime C-, schools D+, amenities F.
- Manila School District (rural): math 39% / reading 37% proficiency, ranked #94 of 238 in AR (top 40%) — families likely to look elsewhere, expect single-tenant / working-renter base with shorter leases.
- Market conditions: 61 active listings in the ZIP; 2 comparable units currently listed for rent nearby; 69 units permitted in Mississippi County in 2024 (0 in 5+ unit buildings).
Forward outlook
- Local home prices are declining (-3.0%/yr); year-one equity from $311 of loan paydown is wiped out by about $1k of value loss. Plan a longer hold.
- Mississippi County population projected at -30% by 2050 — secular population decline; favor cash flow + early exit over multi-decade hold.
- At projected returns (-3.0% appreciation + 3.0% rent growth), your $13k cash investment doubles in ~3 years — after that, you're playing with house money.
Negotiation context
- It's been on market 38 days — a 3% lower offer ($44k) is reasonable based on typical stale-listing flexibility.
Risks & watch-outs
- Climate carrying-cost: extreme-heat days projected 7→20/yr by 2055 (HVAC capex compounding) — expect insurance premiums to compound above CPI over the hold.
Questions for the listing agent
- It's been on market 38 days. Have you received any prior offers? Is the seller open to a 3% concession, seller financing, or rate buy-down credit?
- Built in 1962 — when were the roof, HVAC, electrical panel, plumbing, and water heater last replaced?
- Is there a deadline driving the sale (1031 exchange, divorce, estate, relocation)? That informs how much negotiation room exists.
- Schools are D-rated, which usually means shorter tenancies and higher turnover. Who's the typical renter profile here, and what's been the actual vacancy rate?
- What's the average days-on-market for RENTAL listings here right now (not sales)? A rising rental-DOM trend means longer vacancies and softer asking-rent achievability than the comps imply.
- What's the recent tenant-quality profile in this submarket — average credit score on applications, eviction rate, late-payment / NSF rate, and stable-employment percentage? A property-management company in the area should have these aggregated.
- How much new for-sale + rental construction is in the pipeline within 1–3 miles? Heavy new supply typically softens prices + rents 12–24 months out; constrained supply supports both.
Investment metrics
- 1% rule
- 2.36% ✓
- Cap rate
- 21.03%
- Cash-on-cash
- 52.63%
- DSCR
- 3.34
- GRM
- 3.5
CMA / ARV
- ARV (median comp)
- $84,330
- List price
- $45,000
- Delta
- -46.64%
- Verdict
- UNDERPRICED
- Comps
- 14 within 1.0 mi
Show comp detail 4 sales within ~0.75 mi
| Address | Dist | Beds/Ba | Sqft | Sold | Price | $/sf | Match |
|---|---|---|---|---|---|---|---|
| 313 Roy Benton Dr | 0.67mi | 2/1.0 | 925 (-1%) | 3mo | $65,000 | $70 | 64 |
| 112 Olympia St | 0.21mi | 3/1.0 (+1) | 1,028 (+10%) | 24mo | $80,000 | $78 | 49 |
| 316 Roy Benton Dr | 0.65mi | 2/1.0 | 825 (-12%) | 3mo | $65,000 | $79 | 48 |
| 314 S Boston St | 0.53mi | 2/1.0 | 1,072 (+14%) | 16mo | $85,000 | $79 | 38 |
Match score weights: distance 35% · size 25% · config 20% · recency 20%. Top-matched comps best support the ARV.
Projected returns pro-forma
-3.0% appreciation · 3.0% rent growth · sell at horizon
- IRR
- 50.6%
- Equity multiple
- 3.21×
- Total profit
- $27,903
- Equity at exit
- $6,710
- IRR
- 56.0%
- Equity multiple
- 6.53×
- Total profit
- $69,620
- Equity at exit
- $3,891
Cash invested: $12,600 (down + closing). Projections, not guarantees.
Landlord ↔ Tenant lean methodology
- Overall (STATE)
- 92 Strongly Landlord-Friendly
- State Arkansas
- 92 Strongly Landlord-Friendly · R+14
- County
- — inherits STATE
- City
- — inherits STATE
ZIP-level market 72442
- Home prices YoY
- -17.8%
- Active inventory
- 61
- Price-to-rent
- 3.5×
Monthly cashflow live
- Estimated rent
- $1,063 medium interval (Pro) →
- Mortgage (P&I)
- −$236
- Tax from tax record
- −$32 /mo · $388/yr
- Insurance
- −$19
- HOA
- −$0
- Vacancy / Maint / Mgmt
- −$223
- Net cashflow
- $553
Break-even live
UW: 25.0% down · 7.5% · 30yr · 1.5% tax · 5.0% vac · 8.0% maint · 8.0% mgmt
Financing live
Cash to close
- Down payment
- $11,250
- Closing costs
- $1,350
- Reserves months
- —
- Total cash needed
- —
Loan-product check · same deal, 3 products live
Conventional
25% down · 7.5% · 30yr
- Down + closing
- —
- Monthly P&I
- —
- Monthly cashflow
- —
- DSCR
- —
- Eligible?
- —
Personal DTI + credit; lowest rate.
DSCR
20% down · 8.5% · 30yr
- Down + closing
- —
- Monthly P&I
- —
- Monthly cashflow
- —
- DSCR
- —
- Eligible?
- —
No personal income docs; deal must DSCR.
Hard money
10% down · 12.0% · 12mo
- Down + closing
- —
- Monthly P&I
- —
- Monthly cashflow
- —
- DSCR
- —
- Eligible?
- —
Short-term bridge; refi at stabilization.
Rent comps 2 comps
| Address | Beds | Baths | Sqft | Rent | $/sqft | DOM | Units | Dist |
|---|---|---|---|---|---|---|---|---|
| 132 First Unit A Manila, AR | 2.0 | 1.0 | 950 | $900 | $0.95 | 15d | 1 | 0.49mi |
| 1057 E Olympia St Unit A Manila, AR | 3.0 | 1.0 | 1100 | $1,400 | $1.27 | 23d | 1 | 0.88mi |
Listing history 9 events
-
2026-06-08days on market $45,000 Active 38 DOM
-
2026-06-07days on market $45,000 Active 37 DOM
-
2026-06-07pricedays on market $45,000 Active 36 DOM
-
2026-06-04days on market $48,900 Active 33 DOM
-
2026-06-02days on market $48,900 Active 32 DOM
-
2026-06-01days on market $48,900 Active 31 DOM
-
2026-05-31days on market $48,900 Active 30 DOM
-
2026-05-31days on market $48,900 Active 29 DOM
-
2026-05-01$54,800 Active 787-char remark
ⓘ Source: listings_history table (triggers on properties + properties_extension) + one-shot
backfill from property_details.listing_events for pre-trigger history.
Tax reassessment forecast AR · Resets to sale price
- Current annual tax
- $388 · $32/mo
- Projected year-2 tax
- $388 · $32/mo
- Expected delta
- $0/yr ($0/mo · 0.0%)
ⓘ Screening estimate from a state-policy table — verify with the county assessor before closing.
Climate risk First Street
- Flood 1/10 Low FEMA zone X (shaded) · 0% chance over 30 yrs
- Wildfire 1/10 Low
- Heat 6/10 Major 7 d/yr ≥109°F today · 20 d/yr by 30 yrs out
- Wind 4/10 Moderate 10% chance of damaging wind over 30 yrs
- Air quality 1/10 Low 0 unhealthy d/yr today · 0 by 30 yrs out
Nearby sold comps map
Loading sold comps map…
Walkable amenities ~0.75 mi
Loading nearby amenities…
Taxation est. · year 1
- Rental income
- $12,754
- − Mortgage interest
- −$2,521
- − Property taxes
- −$388
- − Insurance
- −$225
- − Repairs & maintenance
- −$1,020
- − Management
- −$1,020
- − Depreciation
- −$1,309
- Taxable income
- $6,271
- Est. tax owed @ 24.0%
- −$1,505
- After-tax cash flow
- $5,126/yr
For passive investors: Depreciation is non-cash, so a rental often shows a tax loss while cash-flowing — sheltering income. Rental losses are passive: they offset passive income freely, and up to $25,000/yr can offset ordinary (W-2) income if you actively participate and your MAGI is under $100k (phasing out to $0 by $150k); unused losses carry forward. On sale, claimed depreciation is recaptured at up to 25%, and gains may owe capital-gains tax (a 1031 exchange can defer both). Figures are a year-1 estimate at your 24.0% rate — not tax advice; consult a CPA.
Schools (NCES district)
- District
- Manila School District
- NCES district ID
- 0500046
- Math proficiency
- 39% ▼ -17.00%
- Reading proficiency
- 37% ▼ -15.00%
- Median HH income
- $38,252
- Composite
- 31.73/100
- National rank
- #5906
- State rank
- #94 of 238 in AR
Livability — Manila
- Score
- 69/100
- State rank
- #62
- US rank
- #8265
Category grades
Schools grade is shown separately in the Schools card above.
Census & demographics
- Census place
- Manila, AR
- Population (ZIP)
- 4,641
Population outlook (Mississippi County) Hauer SSP2
- Today (2025)
- 38,959 people
- By 2030
- 36,401 · -6.6%
- By 2040
- 31,526 · -19.1%
- By 2050
- 27,058 · -30.5%
- By 2075
- 17,847 · -54.2%
- By 2100
- 11,024 · -71.7%
Race, ethnicity, and origin ACS 2023
- Neighborhood character
- Predominantly White (96%)
- Race & ethnicity
- White 96% Two or more races 3%
- Common ancestry
- Iranian 4% Slovak 3% Italian 2%
- Foreign-born
- 1% · Canada
- Languages at home
- 98% English-only · Other Asian/Pacific 1% German/W. Germanic 1%
Political lean MEDSL · Mississippi
- 2024 margin
- Solid R (+31.6) · D 33.4% · R 65.0% · Other 1.7%
- 2008→2024 swing
- -29.4pp toward R · 2008: -2.2pp · 2024: -31.6pp
- All cycles
- 2024: R+31.6 2020: R+22.2 2016: R+10.5 2012: R+1.1 2008: R+2.2
Not yet ingested
- Civics
- —
Market trends
- HPI YoY
- ▼ -38.49%
- Current HPI
- 178.1683
- Rent YoY
- —
- Metro
- —
- State GDP YoY
- ▲ 3.80%
- F500 in state
- 10
Industry mix (Fortune 500 HQ in AR)
| Industry | F500 HQs | Revenue |
|---|---|---|
| Retail | 1 | $681B |
|
||
| Food / Agriculture | 1 | $53B |
|
||
| Retail / Energy | 1 | $22B |
|
||
| Transportation / Logistics | 1 | $12B |
|
||
| Energy | 1 | $4B |
|
||
Price history
-17.9% since first listed3 events — show timeline
- 2026-06-05 Price Changed $45,000 NEABOR MLS
- 2026-05-27 Price Changed $48,900 NEABOR MLS
- 2026-05-01 Listed $54,800 NEABOR MLS
Property tax history
+0.2%/yrLatest (2025): $388 · +0.2% YoY. Source: county tax records.
Cash-flow waterfall
monthlySold comps — $/sqft
last 12 mo · ≤1 miLoading sold comps…