 Fourplex
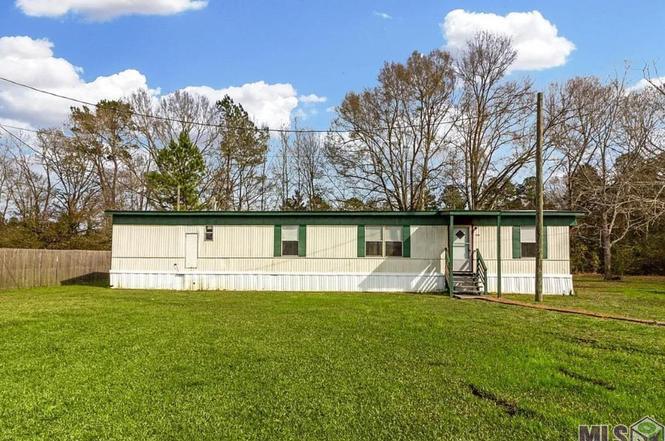
35680 Bonnebell Dr · Watson, LA
Flood risk 1/10 · Minimal
- FEMA flood zone
- X (unshaded)
- Chance of flooding over 30 yrs
- 0.0%
- Est. flood insurance / yr
- $507 – $1,088
Fire risk 3/10 · Minor
- Est. fire insurance / yr
- $1,269 – $2,357
Heat risk 8/10 · Major
- Hot days now (above 108°F)
- 7 days/yr
- Hot days in 30 yrs
- 20 days/yr
Wind risk 8/10 · Major
- Chance of severe wind over 30 yrs
- 99.0%
Air-quality risk 3/10 · Minor
- Unhealthy air days now
- 2 days/yr
- Unhealthy air days in 30 yrs
- 3 days/yr
Risk factors via First Street. Map © Google.
Why this score? — see what drove the B grade
The composite is a weighted blend of 9 inputs, each scored 0–100. Each bar is that input's sub-score; the figure is the points it added to the 100-point composite (weight × sub-score).
- Cash flow +30.0/30.0
- 1% rule +10.0/10.0
- DSCR +10.0/10.0
- ARV discount +7.6/15.0
- Schools +4.0/10.0
- Livability +3.6/5.0
- Rent growth +2.5/5.0
- Condition / age +2.5/5.0
- Appreciation +0.0/10.0
$375,000
🖨 Deal sheet 📄 Offer letter ✓ Due diligence
Multi-family units
County records classify this as Multi-Family (2-4 Unit). Listing-text estimate: 4 units. confirmed
Listing remarks MLS
Come check out this Income-Producing Mobile Home Portfolio Investment! This is a great cash-flowing investment opportunity featuring four tenant-occupied mobile homes across five lots, with a fifth lot currently vacant and ready for expansion. The vacant lot has already been approved through the permit office, allowing a buyer to add an additional mobile home and increase future rental income. Current rents are $1,050 per month for three of the units and $975 per month for the fourth unit, with the fifth lot vacant. The mobile homes were built in 1978, 1982, 1995, and 1999, and three of the four units have had new A/C systems installed within the last three years, offering added value and reduced near-term maintenance. This portfolio is ideal for an investor seeking immediate income with upside potential through additional development.
Key facts
- 1.39 acre lot
- 3 parking spots
- Listed 68 days
Tags
Neighborhood map
What this means for you Summary
Snapshot
- This is a 4 × 3-bed/1.5-bath units multifamily listed at $375k.
Deal economics
- At list price, monthly cash flow is $2k ($29k/yr) — positive. Per door: $604/mo.
- The deal already cash-flows at list — no discount required.
- Meets the 1% rule at list price ($6k rent vs $375k).
- Recommended offer: $352k (6.0% below list) — sets the bar for market timing.
- Cap rate 14.0% vs local median 4.8% in Watson — top-decile yield for the area; either an underpriced asset or a hidden risk that comps aren't pricing in. Stress-test before assuming the spread holds.
Location & tenants
- Location reads 71/100 on livability (#50 in LA) — a middle-class / working-renter tenant base. Strengths: schools A+, crime A+, employment A+; Watch: amenities F, commute F, health & safety F.
- Livingston Parish (suburban): math 40% / reading 52% proficiency, ranked #13 of 98 in LA (top 13%) — families likely to look elsewhere, expect single-tenant / working-renter base with shorter leases.
- Market conditions: 342 active listings in the ZIP; 794 units permitted in Livingston Parish in 2024 (99 in 5+ unit buildings).
Forward outlook
- Local home prices are declining (-3.0%/yr); year-one equity from $3k of loan paydown is wiped out by about $11k of value loss. Plan a longer hold.
- Livingston County population projected at +27% by 2050 — long-run rental-demand tailwind backs the buy-and-hold thesis.
- At projected returns (-3.0% appreciation + 3.0% rent growth), your $105k cash investment doubles in ~5 years — after that, you're playing with house money.
Negotiation context
- It's been on market 68 days — a 6% lower offer ($352k) is reasonable based on typical stale-listing flexibility.
- 2 sale attempts; this cycle's ask has dropped $24k (6%) from the opening price — seller is motivated, your offer sets the floor, not the list.
Risks & watch-outs
- Climate carrying-cost: severe wind risk, 99% chance of damaging wind over 30y; extreme-heat days projected 7→20/yr by 2055 (HVAC capex compounding) — expect insurance premiums to compound above CPI over the hold.
Questions for the listing agent
- It's been on market 68 days. Have you received any prior offers? Is the seller open to a 6% concession, seller financing, or rate buy-down credit?
- Can we see the unit-by-unit rent roll, current vacancy, and any below-market leases? What's the average tenancy length?
- What capital expenditures (roof, boiler, parking lot, exteriors) have been made in the last 5 years, and what's planned in the next 2?
- Why hasn't it sold? Are there any deal-killer items the seller is aware of (foundation, flood, title, zoning, code violations)?
- Is there a deadline driving the sale (1031 exchange, divorce, estate, relocation)? That informs how much negotiation room exists.
- Schools are A-rated — typically a magnet for longer-tenancy family renters. What's the average tenant stay here, and is there a school-zone premium baked into asking?
- What's the average days-on-market for RENTAL listings here right now (not sales)? A rising rental-DOM trend means longer vacancies and softer asking-rent achievability than the comps imply.
- What's the recent tenant-quality profile in this submarket — average credit score on applications, eviction rate, late-payment / NSF rate, and stable-employment percentage? A property-management company in the area should have these aggregated.
- How much new apartment / multifamily construction is in the pipeline within 1–3 miles? Heavy new supply (>2% of stock underway) typically softens rents 12–24 months out; light construction supports rent growth.
Investment metrics
- 1% rule
- 1.69% ✓
- Cap rate
- 14.02%
- Cash-on-cash
- 27.61%
- DSCR
- 2.23
- GRM
- 4.9
CMA / ARV
- ARV (on-the-fly)
- $375,960
- Comps found
- 1
Show comp detail 1 sale within ~0.75 mi
| Address | Dist | Beds/Ba | Sqft | Sold | Price | $/sf | Match |
|---|---|---|---|---|---|---|---|
| 35680 Bonnebell Dr | 0.00mi | —/— | 3,615 (0%) | 1mo | $375,000 | $104 | 99 |
Match score weights: distance 35% · size 25% · config 20% · recency 20%. Top-matched comps best support the ARV.
Projected returns pro-forma
-3.0% appreciation · 3.0% rent growth · sell at horizon
- IRR
- 21.7%
- Equity multiple
- 1.89×
- Total profit
- $93,223
- Equity at exit
- $55,914
- IRR
- 29.8%
- Equity multiple
- 3.66×
- Total profit
- $279,728
- Equity at exit
- $32,423
Cash invested: $105,000 (down + closing). Projections, not guarantees.
Landlord ↔ Tenant lean methodology
- Overall (STATE)
- 90 Strongly Landlord-Friendly
- State Louisiana
- 90 Strongly Landlord-Friendly · R+12
- County
- — inherits STATE
- City
- — inherits STATE
ZIP-level market 70706
- Active inventory
- 342
- Price-to-rent
- 19.7×
Monthly cashflow live
- Estimated rent
- $6,339 medium interval (Pro) →
- Mortgage (P&I)
- −$1,967
- Tax est. 1.5%
- −$469 /mo · $5,625/yr
- Insurance
- −$156
- HOA
- −$0
- Vacancy / Maint / Mgmt
- −$1,331
- Net cashflow
- $2,416
Break-even live
4-unit breakdown (identical units grouped — click to expand)
| Units | Beds | Baths | Est. rent |
|---|---|---|---|
| 4× units | 3 | 1.5 | $6,340 |
| #1 | 3 | 1.5 | $1,585 |
| #2 | 3 | 1.5 | $1,585 |
| #3 | 3 | 1.5 | $1,585 |
| #4 | 3 | 1.5 | $1,585 |
| Total (4 units) | $6,339 | ||
UW: 25.0% down · 7.5% · 30yr · 1.5% tax · 5.0% vac · 8.0% maint · 8.0% mgmt
Financing live
Cash to close
- Down payment
- $93,750
- Closing costs
- $11,250
- Reserves months
- —
- Total cash needed
- —
Loan-product check · same deal, 3 products live
Conventional
25% down · 7.5% · 30yr
- Down + closing
- —
- Monthly P&I
- —
- Monthly cashflow
- —
- DSCR
- —
- Eligible?
- —
Personal DTI + credit; lowest rate.
DSCR
20% down · 8.5% · 30yr
- Down + closing
- —
- Monthly P&I
- —
- Monthly cashflow
- —
- DSCR
- —
- Eligible?
- —
No personal income docs; deal must DSCR.
Hard money
10% down · 12.0% · 12mo
- Down + closing
- —
- Monthly P&I
- —
- Monthly cashflow
- —
- DSCR
- —
- Eligible?
- —
Short-term bridge; refi at stabilization.
Listing history 6 events
-
2026-04-01status Pending 847-char remark
Show marketing remark (847 chars)
Come check out this Income-Producing Mobile Home Portfolio Investment! This is a great cash-flowing investment opportunity featuring four tenant-occupied mobile homes across five lots, with a fifth lot currently vacant and ready for expansion. The vacant lot has already been approved through the permit office, allowing a buyer to add an additional mobile home and increase future rental income. Current rents are $1,050 per month for three of the units and $975 per month for the fourth unit, with the fifth lot vacant. The mobile homes were built in 1978, 1982, 1995, and 1999, and three of the four units have had new A/C systems installed within the last three years, offering added value and reduced near-term maintenance. This portfolio is ideal for an investor seeking immediate income with upside potential through additional development.
-
2026-04-01status Pending
Show marketing remark (847 chars)
Come check out this Income-Producing Mobile Home Portfolio Investment! This is a great cash-flowing investment opportunity featuring four tenant-occupied mobile homes across five lots, with a fifth lot currently vacant and ready for expansion. The vacant lot has already been approved through the permit office, allowing a buyer to add an additional mobile home and increase future rental income. Current rents are $1,050 per month for three of the units and $975 per month for the fourth unit, with the fifth lot vacant. The mobile homes were built in 1978, 1982, 1995, and 1999, and three of the four units have had new A/C systems installed within the last three years, offering added value and reduced near-term maintenance. This portfolio is ideal for an investor seeking immediate income with upside potential through additional development.
-
2026-01-30price $375,000 847-char remark
Show marketing remark (847 chars)
Come check out this Income-Producing Mobile Home Portfolio Investment! This is a great cash-flowing investment opportunity featuring four tenant-occupied mobile homes across five lots, with a fifth lot currently vacant and ready for expansion. The vacant lot has already been approved through the permit office, allowing a buyer to add an additional mobile home and increase future rental income. Current rents are $1,050 per month for three of the units and $975 per month for the fourth unit, with the fifth lot vacant. The mobile homes were built in 1978, 1982, 1995, and 1999, and three of the four units have had new A/C systems installed within the last three years, offering added value and reduced near-term maintenance. This portfolio is ideal for an investor seeking immediate income with upside potential through additional development.
-
2026-01-30price $375,000
Show marketing remark (847 chars)
Come check out this Income-Producing Mobile Home Portfolio Investment! This is a great cash-flowing investment opportunity featuring four tenant-occupied mobile homes across five lots, with a fifth lot currently vacant and ready for expansion. The vacant lot has already been approved through the permit office, allowing a buyer to add an additional mobile home and increase future rental income. Current rents are $1,050 per month for three of the units and $975 per month for the fourth unit, with the fifth lot vacant. The mobile homes were built in 1978, 1982, 1995, and 1999, and three of the four units have had new A/C systems installed within the last three years, offering added value and reduced near-term maintenance. This portfolio is ideal for an investor seeking immediate income with upside potential through additional development.
-
2026-01-23$399,000 Active 847-char remark
Show marketing remark (847 chars)
Come check out this Income-Producing Mobile Home Portfolio Investment! This is a great cash-flowing investment opportunity featuring four tenant-occupied mobile homes across five lots, with a fifth lot currently vacant and ready for expansion. The vacant lot has already been approved through the permit office, allowing a buyer to add an additional mobile home and increase future rental income. Current rents are $1,050 per month for three of the units and $975 per month for the fourth unit, with the fifth lot vacant. The mobile homes were built in 1978, 1982, 1995, and 1999, and three of the four units have had new A/C systems installed within the last three years, offering added value and reduced near-term maintenance. This portfolio is ideal for an investor seeking immediate income with upside potential through additional development.
-
2026-01-23$399,000 Active
Show marketing remark (847 chars)
Come check out this Income-Producing Mobile Home Portfolio Investment! This is a great cash-flowing investment opportunity featuring four tenant-occupied mobile homes across five lots, with a fifth lot currently vacant and ready for expansion. The vacant lot has already been approved through the permit office, allowing a buyer to add an additional mobile home and increase future rental income. Current rents are $1,050 per month for three of the units and $975 per month for the fourth unit, with the fifth lot vacant. The mobile homes were built in 1978, 1982, 1995, and 1999, and three of the four units have had new A/C systems installed within the last three years, offering added value and reduced near-term maintenance. This portfolio is ideal for an investor seeking immediate income with upside potential through additional development.
ⓘ Source: listings_history table (triggers on properties + properties_extension) + one-shot
backfill from property_details.listing_events for pre-trigger history.
Climate risk First Street
- Flood 1/10 Low FEMA zone X (unshaded) · 0% chance over 30 yrs
- Wildfire 3/10 Moderate
- Heat 8/10 Severe 7 d/yr ≥108°F today · 20 d/yr by 30 yrs out
- Wind 8/10 Severe 99% chance of damaging wind over 30 yrs
- Air quality 3/10 Moderate 2 unhealthy d/yr today · 3 by 30 yrs out
Nearby sold comps map
Loading sold comps map…
Walkable amenities ~0.75 mi
Loading nearby amenities…
Taxation est. · year 1
- Rental income
- $76,068
- − Mortgage interest
- −$21,006
- − Property taxes
- −$5,625
- − Insurance
- −$1,875
- − Repairs & maintenance
- −$6,085
- − Management
- −$6,085
- − Depreciation
- −$10,909
- Taxable income
- $24,482
- Est. tax owed @ 24.0%
- −$5,876
- After-tax cash flow
- $23,120/yr
For passive investors: Depreciation is non-cash, so a rental often shows a tax loss while cash-flowing — sheltering income. Rental losses are passive: they offset passive income freely, and up to $25,000/yr can offset ordinary (W-2) income if you actively participate and your MAGI is under $100k (phasing out to $0 by $150k); unused losses carry forward. On sale, claimed depreciation is recaptured at up to 25%, and gains may owe capital-gains tax (a 1031 exchange can defer both). Figures are a year-1 estimate at your 24.0% rate — not tax advice; consult a CPA.
Schools (NCES district)
- District
- Livingston Parish
- NCES district ID
- 2201020
- Math proficiency
- 40% ▼ -38.00%
- Reading proficiency
- 52% ▼ -32.00%
- Median HH income
- $56,755
- Composite
- 40.07/100
- National rank
- #3811
- State rank
- #13 of 98 in LA
Livability — Watson
- Score
- 71/100
- State rank
- #50
- US rank
- #7247
Category grades
Schools grade is shown separately in the Schools card above.
Census & demographics
- Population (ZIP)
- 22,621
Population outlook (Livingston County) Hauer SSP2
- Today (2025)
- 158,511 people
- By 2030
- 168,241 · +6.1%
- By 2040
- 186,252 · +17.5%
- By 2050
- 201,516 · +27.1%
- By 2075
- 231,217 · +45.9%
- By 2100
- 241,697 · +52.5%
Race, ethnicity, and origin ACS 2023
- Neighborhood character
- Predominantly White (86%)
- Race & ethnicity
- White 86% Black 6% Hispanic / Latino 5% Two or more races 4%
- Hispanic origin (detail)
- Common ancestry
- Lithuanian 15% Slovak 2% Italian 1%
- Foreign-born
- 1% · Canada, China
Political lean MEDSL · Livingston
- 2024 margin
- Solid R (+68.5) · D 15.1% · R 83.6% · Other 1.3%
- 2008→2024 swing
- +3.4pp toward D · 2008: -71.9pp · 2024: -68.5pp
- All cycles
- 2024: R+68.5 2020: R+70.0 2016: R+72.5 2012: R+70.4 2008: R+71.9
Not yet ingested
- Civics
- —
Market trends
- HPI YoY
- ▼ -88.82%
- Current HPI
- 160.2185
- Rent YoY
- —
- Metro
- —
- State GDP YoY
- ▲ 3.29%
- F500 in state
- 10
Industry mix (Fortune 500 HQ in LA)
| Industry | F500 HQs | Revenue |
|---|---|---|
| Telecommunications | 2 | $23B |
|
||
| Utilities | 1 | $12B |
|
||
| Wholesale / Distribution | 1 | $5B |
|
||
| Advertising | 1 | $2B |
|
||
Price history
-6.0% since first listed6 events — show timeline
- 2026-04-01 Pending — AcadianaMLS
- 2026-04-01 Pending — GBRMLS
- 2026-01-30 Price Changed $375,000 AcadianaMLS
- 2026-01-30 Price Changed $375,000 GBRMLS
- 2026-01-23 Listed $399,000 GBRMLS
- 2026-01-23 Listed $399,000 AcadianaMLS
Cash-flow waterfall
monthlySold comps — $/sqft
last 12 mo · ≤1 miLoading sold comps…