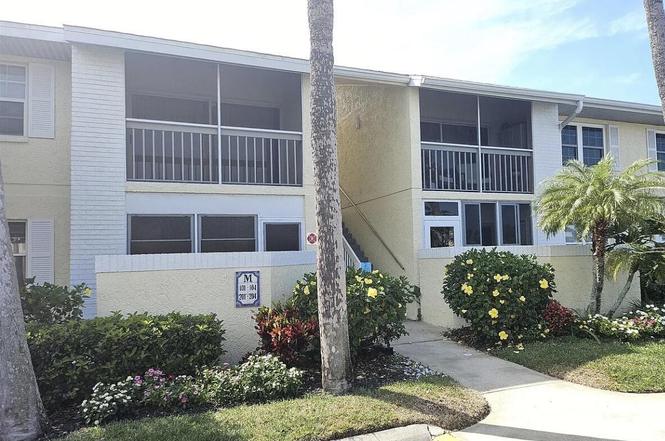
915 Sonesta Ave NE #102 · Palm Bay, FL
Flood risk 1/10 · Minimal
- FEMA flood zone
- X (unshaded)
- Chance of flooding over 30 yrs
- 0.0%
- Est. flood insurance / yr
- $507 – $1,088
Fire risk 2/10 · Minimal
- Est. fire insurance / yr
- $947 – $1,759
Heat risk 10/10 · Severe
- Hot days now (above 106°F)
- 7 days/yr
- Hot days in 30 yrs
- 23 days/yr
Wind risk 10/10 · Severe
- Chance of severe wind over 30 yrs
- 99.0%
Air-quality risk 1/10 · Minimal
- Unhealthy air days now
- 0 days/yr
- Unhealthy air days in 30 yrs
- 0 days/yr
Risk factors via First Street. Map © Google.
Why this score? — see what drove the C+ grade
The composite is a weighted blend of 9 inputs, each scored 0–100. Each bar is that input's sub-score; the figure is the points it added to the 100-point composite (weight × sub-score).
- Cash flow +22.6/30.0
- 1% rule +9.1/10.0
- ARV discount +7.5/15.0
- DSCR +7.3/10.0
- Schools +4.7/10.0
- Livability +3.6/5.0
- Condition / age +2.5/5.0
- Rent growth +2.4/5.0
- Appreciation +2.2/10.0
$110,000
🖨 Deal sheet 📄 Offer letter ✓ Due diligence
Listing remarks
2 Bedroom 2 Bathroom Condo. Needs repair being sold AS/IS. HOA doesn't not allow unit to be rented for 3 years after purchase. Probate sale.
Key facts
- $373 HOA
- Community pool
- Built 1986
Neighborhood map
What this means for you Summary
Snapshot
- This is a 2-bed/2.0-bath condo listed at $110k.
Deal economics
- At list price, monthly cash flow is $188 ($2k/yr) — positive.
- The deal already cash-flows at list — no discount required.
- Meets the 1% rule at list price ($2k rent vs $110k).
Location & tenants
- Location reads 72/100 on livability (#366 in FL) — a middle-class / working-renter tenant base. Strengths: cost of living A+, housing A+; Watch: employment D+, amenities F, health & safety D-.
- Brevard (suburban): math 53% / reading 57% proficiency, ranked #19 of 73 in FL (top 26%) — acceptable for families but not a draw, mixed tenant base, ~2y average lease.
- Zoned schools: Riviera Elementary School (math 56% / reading 48%, grade C-, #990 of 2,144 statewide, top 48%, 696 students, 72% FRL); Stone Magnet Middle School (math 33% / reading 35%, grade F, #426 of 571 statewide, top 75%, 670 students, 69% FRL); Palm Bay Magnet Senior High School (math 25% / reading 37%, grade F, #429 of 667 statewide, top 65%, 1,486 students, 63% FRL) — zoned schools average 68% FRL vs 43% district-wide (25 pts higher); higher-poverty schools than district average — tighter screening recommended.
- Zoned-school proficiency averages 39% at this address vs 55% district-wide (-16 pts) — the specific schools serving this property underperform the Brevard average; the district grade overstates school quality for this exact location.
- Market conditions: Rents soft (-0.5%/yr); 321 active listings in the ZIP; 33 comparable units currently listed for rent nearby; rentals at typical pace (median 24d on market — plan ~3-4 weeks tenant-placement turnaround); 4,602 units permitted in Brevard County in 2024 (702 in 5+ unit buildings).
- This rent runs 33% of the median local income ($56k/yr) — at the standard rent-burdened threshold; future hikes will face affordability resistance.
Forward outlook
- Local home prices are declining (-3.0%/yr); year-one equity from $761 of loan paydown is wiped out by about $3k of value loss. Plan a longer hold.
- Brevard County population projected at +15% by 2050 — modest demand growth; plan on rents tracking national, not racing it.
Negotiation context
- Only 5 days on market — expect competitive offers; lowballing is unlikely to land.
- Current owner paid $44k; list at $110k implies a 150% gain — meaningful room to come down on a strong offer.
Risks & watch-outs
- Watch-outs: HOA is 24% of rent.
- Climate carrying-cost: severe wind risk, 99% chance of damaging wind over 30y; extreme-heat days projected 7→23/yr by 2055 (HVAC capex compounding) — expect insurance premiums to compound above CPI over the hold.
Questions for the listing agent
- What does the HOA fee cover, when was the last increase, and are there any pending special assessments or reserve-fund shortfalls?
- Any open or pending special assessments — roof, HVAC, plumbing, elevator, façade? What's the per-unit balance and payoff schedule, and is the seller paying it off at close or rolling it to the buyer?
- Is there a deadline driving the sale (1031 exchange, divorce, estate, relocation)? That informs how much negotiation room exists.
- What's the average days-on-market for RENTAL listings here right now (not sales)? A rising rental-DOM trend means longer vacancies and softer asking-rent achievability than the comps imply.
- What's the recent tenant-quality profile in this submarket — average credit score on applications, eviction rate, late-payment / NSF rate, and stable-employment percentage? A property-management company in the area should have these aggregated.
- How much new apartment / multifamily construction is in the pipeline within 1–3 miles? Heavy new supply (>2% of stock underway) typically softens rents 12–24 months out; light construction supports rent growth.
Investment metrics
- 1% rule
- 1.41% ✓
- Cap rate
- 8.34%
- Cash-on-cash
- 7.32%
- DSCR
- 1.33
- GRM
- 5.9
CMA / ARV
No comps found within radius.
Projected returns pro-forma
-3.0% appreciation · 0.0% rent growth · sell at horizon
- IRR
- -9.4%
- Equity multiple
- 0.67×
- Total profit
- $-10,215
- Equity at exit
- $16,401
- IRR
- -6.3%
- Equity multiple
- 0.67×
- Total profit
- $-10,300
- Equity at exit
- $9,511
Cash invested: $30,800 (down + closing). Projections, not guarantees.
Landlord ↔ Tenant lean methodology
- Overall (STATE)
- 87 Strongly Landlord-Friendly
- State Florida
- 87 Strongly Landlord-Friendly · R+3
- County
- — inherits STATE
- City
- — inherits STATE
ZIP-level market 32905
- Home prices YoY
- -1.8%
- Rents YoY
- -0.5%
- Active inventory
- 321
- Price-to-rent
- 5.9×
Monthly cashflow live
- Estimated rent
- $1,555 high interval (Pro) →
- Mortgage (P&I)
- −$577
- Tax from tax record
- −$45 /mo · $542/yr
- Insurance
- −$46
- HOA
- −$373
- Vacancy / Maint / Mgmt
- −$327
- Net cashflow
- $188
Break-even live
UW: 25.0% down · 7.5% · 30yr · 1.5% tax · 5.0% vac · 8.0% maint · 8.0% mgmt
Financing live
Cash to close
- Down payment
- $27,500
- Closing costs
- $3,300
- Reserves months
- —
- Total cash needed
- —
Loan-product check · same deal, 3 products live
Conventional
25% down · 7.5% · 30yr
- Down + closing
- —
- Monthly P&I
- —
- Monthly cashflow
- —
- DSCR
- —
- Eligible?
- —
Personal DTI + credit; lowest rate.
DSCR
20% down · 8.5% · 30yr
- Down + closing
- —
- Monthly P&I
- —
- Monthly cashflow
- —
- DSCR
- —
- Eligible?
- —
No personal income docs; deal must DSCR.
Hard money
10% down · 12.0% · 12mo
- Down + closing
- —
- Monthly P&I
- —
- Monthly cashflow
- —
- DSCR
- —
- Eligible?
- —
Short-term bridge; refi at stabilization.
Rent comps 33 comps
| Address | Beds | Baths | Sqft | Rent | $/sqft | DOM | Units | Dist |
|---|---|---|---|---|---|---|---|---|
| 915 Sonesta Ave NE #203 Palm Bay, FL | 2.0 | 2.0 | 825 | $1,450 | $1.76 | 23d | 1 | 0.02mi |
| 915 Sonesta Ave NE Palm Bay, FL | 2.0 | 2.0 | 825 | $1,425 | $1.73 | 21d | 2 | 0.05mi |
| 969 Sonesta Ave NE #208 Palm Bay, FL | 1.0 | 1.0 | 624 | $1,475 | $2.36 | 23d | 1 | 0.09mi |
| 987 Sonesta Ave NE #207 Palm Bay, FL | 1.0 | 1.0 | 644 | $1,200 | $1.86 | 14d | 1 | 0.11mi |
| 993 Sonesta Ave NE Unit A-103 Palm Bay, FL | 2.0 | 2.0 | 825 | $1,350 | $1.64 | 23d | 1 | 0.12mi |
| 918 Aventine Dr West Melbourne, FL | 1.0–2.0 | 1.0–2.0 | 907 | $2,202 | $2.43 | 13d | 33 | 0.21mi |
| 100 Larch Cir NE Palm Bay, FL | 1.0–2.0 | 1.0–2.0 | 1013 | $1,775 | $1.75 | 14d | 16 | 0.23mi |
| 1440 Sheafe Ave NE #112 Palm Bay, FL | 2.0 | 2.0 | 793 | $1,500 | $1.89 | 23d | 1 | 0.29mi |
| 1440 Sheafe Ave NE Palm Bay, FL | 2.0 | 2.0 | 793 | $1,500 | $1.89 | 21d | 1 | 0.29mi |
| 4714 Crosswind Ct Melbourne, FL | 1.0–3.0 | 1.0–2.0 | 1071 | $1,725 | $1.61 | 13d | 19 | 0.53mi |
| 4881 Dairy Rd Melbourne, FL | 1.0–2.0 | 1.0–2.0 | 954 | $2,491 | $2.61 | 14d | 12 | 0.53mi |
| 1245 Palm Bay Rd Palm Bay, FL | 1.0–2.0 | 1.0–2.0 | 807 | $1,425 | $1.76 | 23d | 6 | 0.64mi |
| 1070 Luminary Cir #104 Melbourne, FL | 2.0 | 2.0 | 1008 | $1,850 | $1.84 | 23d | 1 | 0.65mi |
| 1311 Cindy Cir NE Palm Bay, FL | 2.0 | 2.0 | 865 | $1,700 | $1.97 | 23d | 1 | 0.69mi |
| 1030 Luminary Cir Unit 106 Melbourne, FL | 2.0 | 2.0 | 1008 | $1,800 | $1.79 | 21d | 1 | 0.71mi |
| 1501 Harvard Cir Melbourne, FL | 1.0–3.0 | 1.0–2.0 | 1075 | $1,765 | $1.64 | 23d | 3 | 0.89mi |
| 790 Luminary Cir #104 Melbourne, FL | 2.0 | 2.0 | 1008 | $1,850 | $1.84 | 23d | 1 | 0.93mi |
| 4152 Merrillville Dr West Melbourne, FL | 1.0–3.0 | 1.0–3.0 | 1106 | $1,764 | $1.59 | 23d | 1 | 0.94mi |
| 1701 Forest Knoll Dr NE Palm Bay, FL | 2.0–3.0 | 2.0 | 1200 | $1,499 | $1.25 | 14d | 5 | 1.28mi |
| 1123 Tree Ridge Ln NE Palm Bay, FL | 2.0 | 1.0 | 870 | $1,350 | $1.55 | 23d | 1 | 1.34mi |
| 2130 Forest Knoll Dr NE #202 Palm Bay, FL | 2.0 | 2.0 | 1069 | $1,450 | $1.36 | 23d | 1 | 1.38mi |
| 2190 Forest Knoll Dr NE Unit 90-202 Palm Bay, FL | 2.0 | 2.0 | 1069 | $1,400 | $1.31 | 23d | 1 | 1.40mi |
| 2160 Forest Knoll Dr NE Unit 60-102 Palm Bay, FL | 2.0 | 2.0 | 1069 | $1,350 | $1.26 | 23d | 1 | 1.40mi |
| 2100 Forest Knoll Dr NE #202 Palm Bay, FL | 2.0 | 2.0 | 1069 | $1,600 | $1.50 | 14d | 1 | 1.41mi |
| 1608 Sunny Brook Ln Palm Bay, FL | 1.0–3.0 | 1.0–2.0 | 1040 | $1,412 | $1.36 | 23d | 6 | 1.43mi |
| 1601 Sunny Brook Ln NE Unit D101 Palm Bay, FL | 2.0 | 2.0 | 846 | $1,550 | $1.83 | 23d | 1 | 1.46mi |
| 1649 Sunny Brook Ln NE Palm Bay, FL | 1.0–2.0 | 1.0–2.0 | 760 | $1,950 | $2.57 | 14d | 2 | 1.46mi |
| 1625 Sunny Brook Ln NE Unit G103 Palm Bay, FL | 3.0 | 2.0 | 914 | $1,700 | $1.86 | 23d | 1 | 1.46mi |
| 1641 Sunny Brook Ln NE Palm Bay, FL | 2.0 | 2.0 | 862 | $1,500 | $1.74 | 14d | 3 | 1.46mi |
| 1625 Par St NE Unit 1104 Palm Bay, FL | 2.0 | 2.0 | 1025 | $2,100 | $2.05 | 23d | 1 | 1.47mi |
| 1625 Par St NE Unit 1107 Palm Bay, FL | 2.0 | 2.0 | 1025 | $1,875 | $1.83 | 23d | 1 | 1.47mi |
| 1605 Par St NE Unit 3102 Palm Bay, FL | 2.0 | 2.0 | 1025 | $2,100 | $2.05 | 23d | 1 | 1.48mi |
| 1656 Sunny Brook Ln NE Unit L102 Palm Bay, FL | 3.0 | 2.0 | 914 | $1,690 | $1.85 | 21d | 1 | 1.49mi |
HOA detail condo
- Monthly dues
- $373 · $4,476/yr
- Assessments
- None detected in remarks — confirm with the listing agent.
Listing history 11 events
-
2026-06-18days on market $110,000 Active 5 DOM
-
2026-06-17days on market $110,000 Active 4 DOM
-
2026-06-16days on market $110,000 Active 3 DOM
-
2026-06-15days on market $110,000 Active 2 DOM
-
2026-06-14remarks 140-char remark
-
2026-06-14status $110,000 Active 1 DOM
-
2025-09-24status Pending
-
2025-09-24price $110,000
-
2025-09-23$100,000 Active
-
1996-01-17soldstatus $44,000
-
1986-12-01soldstatus $70,200
ⓘ Source: listings_history table (triggers on properties + properties_extension) + one-shot
backfill from property_details.listing_events for pre-trigger history.
Tax reassessment forecast FL · Resets to sale price
- Current annual tax
- $542 · $45/mo
- Projected year-2 tax
- $913 · $76/mo
- Expected delta
- +$371/yr (+$31/mo · 68.4%)
ⓘ Screening estimate from a state-policy table — verify with the county assessor before closing.
Climate risk First Street
- Flood 1/10 Low FEMA zone X (unshaded) · 0% chance over 30 yrs
- Wildfire 2/10 Low
- Heat 10/10 Extreme 7 d/yr ≥106°F today · 23 d/yr by 30 yrs out
- Wind 10/10 Extreme 99% chance of damaging wind over 30 yrs
- Air quality 1/10 Low 0 unhealthy d/yr today · 0 by 30 yrs out
Nearby sold comps map
Loading sold comps map…
Walkable amenities ~0.75 mi
Loading nearby amenities…
Taxation est. · year 1
- Rental income
- $18,666
- − Mortgage interest
- −$6,162
- − Property taxes
- −$542
- − Insurance
- −$550
- − Repairs & maintenance
- −$1,493
- − Management
- −$1,493
- − HOA
- −$4,476
- − Depreciation
- −$3,200
- Taxable income
- $749
- Est. tax owed @ 24.0%
- −$180
- After-tax cash flow
- $2,076/yr
For passive investors: Depreciation is non-cash, so a rental often shows a tax loss while cash-flowing — sheltering income. Rental losses are passive: they offset passive income freely, and up to $25,000/yr can offset ordinary (W-2) income if you actively participate and your MAGI is under $100k (phasing out to $0 by $150k); unused losses carry forward. On sale, claimed depreciation is recaptured at up to 25%, and gains may owe capital-gains tax (a 1031 exchange can defer both). Figures are a year-1 estimate at your 24.0% rate — not tax advice; consult a CPA.
Schools (NCES district)
- District
- Brevard
- NCES district ID
- 1200150
- Math proficiency
- 53% ▼ -9.00%
- Reading proficiency
- 57% ▼ -4.00%
- Median HH income
- $49,426
- Composite
- 46.86/100
- National rank
- #2370
- State rank
- #19 of 73 in FL
Livability — Palm Bay
- Score
- 72/100
- State rank
- #366
- US rank
- #6458
Category grades
Schools grade is shown separately in the Schools card above.
Census & demographics
- Census place
- Palm Bay, FL
- County
- Brevard County · 602,871 people
- City population
- 132,211
- Metro
- Palm Bay-Melbourne-Titusville, FL
- Population (ZIP)
- 24,792
- Household income
- $56,411
- Rent vs Own
- Severe rent burden
- 1962.0
Population outlook (Brevard County) Hauer SSP2
- Today (2025)
- 623,254 people
- By 2030
- 648,420 · +4.0%
- By 2040
- 690,009 · +10.7%
- By 2050
- 715,669 · +14.8%
- By 2075
- 775,744 · +24.5%
- By 2100
- 776,687 · +24.6%
Race, ethnicity, and origin ACS 2023
- Neighborhood character
- Diverse neighborhood (Simpson 0.57)
- Race & ethnicity
- White 61% Hispanic / Latino 16% Black 16% Two or more races 11% Asian 2%
- Hispanic origin (detail)
- Mexican 1% Puerto Rican 4% Cuban 4%
- Common ancestry
- Romanian 2% Hispanic 2% Slovak 2%
- Foreign-born
- 13% · Canada, Jamaica
- Languages at home
- 83% English-only · Spanish 12% French/Haitian/Cajun 2% Other Indo-European 2%
Political lean MEDSL · Brevard
- 2024 margin
- Strong R (+20.8) · D 39.1% · R 59.9% · Other 1.0%
- 2008→2024 swing
- -10.4pp toward R · 2008: -10.4pp · 2024: -20.8pp
- All cycles
- 2024: R+20.8 2020: R+16.4 2016: R+19.8 2012: R+12.7 2008: R+10.4
Not yet ingested
- Civics
- —
Market trends
- HPI YoY
- ▼ -5.59%
- Current HPI
- 309.8748
- Rent YoY
- ▼ -0.52%
- Metro
- Palm Bay-Melbourne-Titusville, FL
- State GDP YoY
- ▲ 3.28%
- F500 in state
- 36
Industry mix (Fortune 500 HQ in FL)
| Industry | F500 HQs | Revenue |
|---|---|---|
| Industrial Technology | 2 | $29B |
|
||
| Insurance | 2 | $17B |
|
||
| Retail | 1 | $60B |
|
||
| Technology Distribution | 1 | $58B |
|
||
| Homebuilding | 1 | $35B |
|
||
| Technology Manufacturing | 1 | $35B |
|
||
Price history
+56.7% since first listed5 events — show timeline
- 2025-09-24 Pending — SCMLS
- 2025-09-24 Price Changed $110,000 SCMLS
- 2025-09-23 Listed $100,000 SCMLS
- 1996-01-17 Sold (Public Records) $44,000 Public Records
- 1986-12-01 Sold (Public Records) $70,200 Public Records
Property tax history
+2.2%/yrLatest (2025): $542 · +1.4% YoY. Source: county tax records.
Cash-flow waterfall
monthlySold comps — $/sqft
last 12 mo · ≤1 miLoading sold comps…