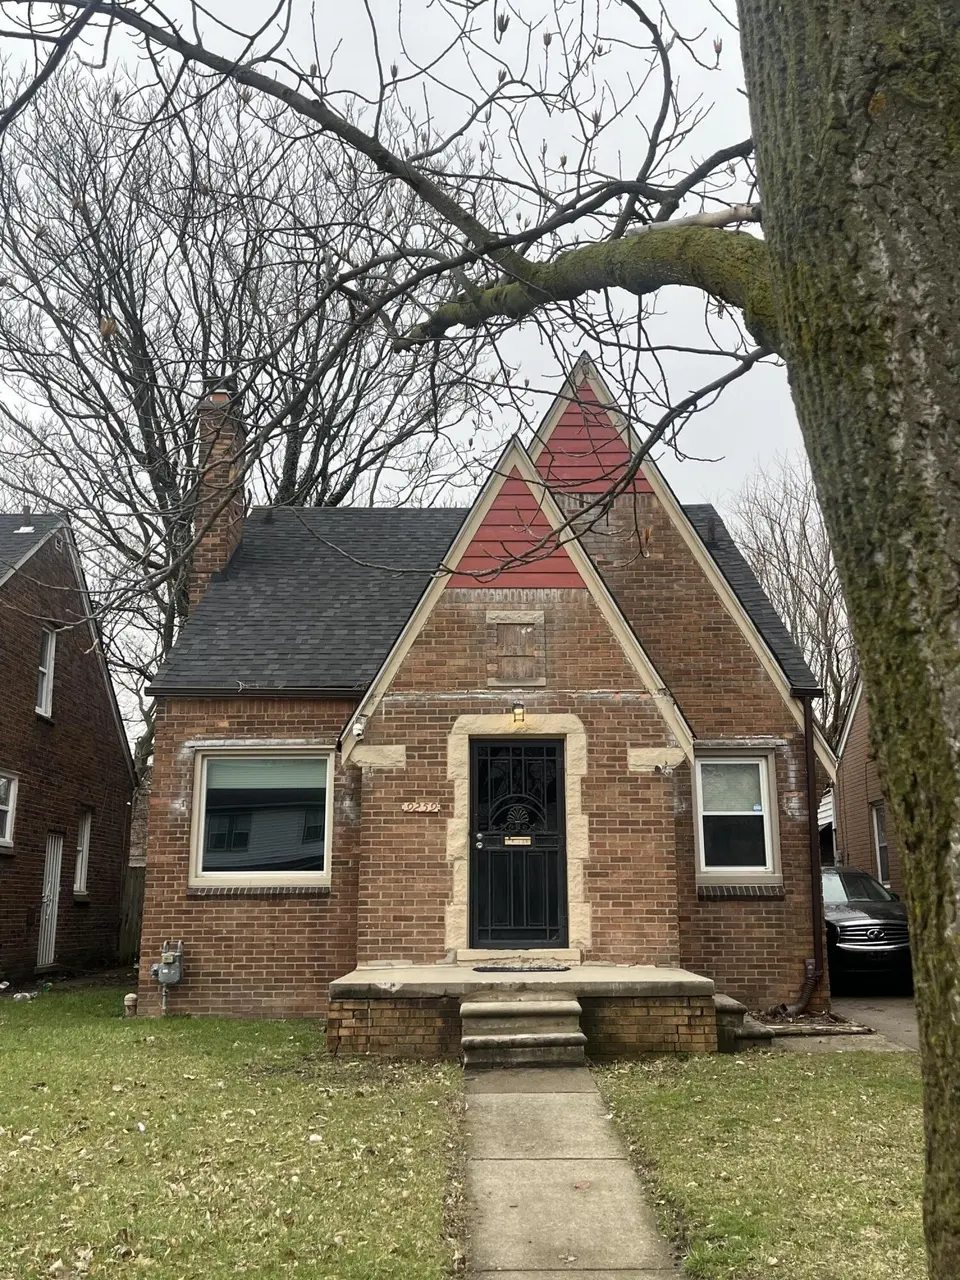
9259 Cheyenne St · Detroit, MI
Flood risk 3/10 · Minor
- FEMA flood zone
- X (unshaded)
- Chance of flooding over 30 yrs
- 0.2%
- Est. flood insurance / yr
- $473 – $860
Fire risk 1/10 · Minimal
- Est. fire insurance / yr
- $784 – $1,456
Heat risk 3/10 · Minor
- Hot days now (above 97°F)
- 7 days/yr
- Hot days in 30 yrs
- 15 days/yr
Wind risk 2/10 · Minimal
- Chance of severe wind over 30 yrs
- —
Air-quality risk 3/10 · Minor
- Unhealthy air days now
- 2 days/yr
- Unhealthy air days in 30 yrs
- 5 days/yr
Risk factors via First Street. Map © Google.
Why this score? — see what drove the B grade
The composite is a weighted blend of 9 inputs, each scored 0–100. Each bar is that input's sub-score; the figure is the points it added to the 100-point composite (weight × sub-score).
- Cash flow +30.0/30.0
- ARV discount +12.3/15.0
- 1% rule +10.0/10.0
- DSCR +10.0/10.0
- Livability +3.7/5.0
- Condition / age +2.5/5.0
- Rent growth +1.9/5.0
- Schools +1.3/10.0
- Appreciation +0.0/10.0
$80,000
🖨 Deal sheet 📄 Offer letter ✓ Due diligence
Listing remarks MLS
Back on the market potential off market sale with tenant didn't materialize. Serious investor looking for an income property in Barton McFarland less than two miles to Joe Louis Greenway and Cody High School undergoing an 86 million dollar renovation. This brink bungalow has good structure, minor updates, and some original features. Great opportunity to rehab, refi, and hold as the equity increases. First time buyer with City of Detroit down payment assistance up to 25K
Key facts
- 4,356 sq ft lot
- Built 1939
- Listed 18 days
Property features AI
Exterior
- Utilities: Public water; Natural gas available and connected
- Home design: Single-family residence; Residential property
- Construction: Brick construction; Asphalt roof; Built in 1939
- Exterior features: Sidewalk
Interior
- Kitchen: Kitchen (8 x 6)
- Bedrooms: Primary bedroom (20 x 10); Bedroom 2 (9 x 8); Bedroom 3 (9 x 8)
- Bathrooms: 1 full bathroom; 1 half bathroom; Primary bathroom (6 x 5); Second bathroom (4 x 3)
- Heating & cooling: Forced air heating; Heating present
- Interior features: Fireplace; Replacement windows; Total of 5 rooms; Full Michigan basement
- Laundry & utility: Natural gas water heater
Neighborhood map
What this means for you Summary
Snapshot
- This is a 3-bed/1.0-bath single-family listed at $80k.
Deal economics
- At list price, monthly cash flow is $470 ($6k/yr) — positive.
- The deal already cash-flows at list — no discount required.
- Meets the 1% rule at list price ($1k rent vs $80k).
- Recommended offer: $79k (1.5% below list) — sets the bar for market timing.
- Cap rate 13.3% vs local median 10.2% in Detroit — top-decile yield for the area; either an underpriced asset or a hidden risk that comps aren't pricing in. Stress-test before assuming the spread holds.
Location & tenants
- Location reads 73/100 on livability (#218 in MI) — a middle-class / working-renter tenant base. Strengths: amenities A+, commute A+, cost of living A+; Watch: schools F, crime F, employment F.
- Detroit Public Schools Community District (urban): math 10% / reading 24% proficiency, ranked #499 of 540 in MI (top 92%) — low school quality limits family demand, transient renter base, plan for 1-2y turnover; 90% free/reduced lunch — lower-income household profile, screen leases tightly.
- Market conditions: Rents soft (-2.3%/yr); 363 active listings in the ZIP; 40 comparable units currently listed for rent nearby; rentals lingering (median 44d on market — plan ~5-8 weeks vacancy on turnover, expect pricing pressure); 58% of comp listings sitting > 30 days — soft ceiling on asking rent; lower-income renter base — watch delinquency; 2,639 units permitted in Wayne County in 2024 (1,216 in 5+ unit buildings).
- At $1,268/mo this rent would consume 50% of the median local household income ($31k/yr) (locally 4144% of renters already pay >50% of income on rent) — very limited rent-growth headroom before tenants either downsize or default.
Forward outlook
- Local home prices are declining (-3.0%/yr); year-one equity from $553 of loan paydown is wiped out by about $2k of value loss. Plan a longer hold.
- Wayne County population projected at -17% by 2050 — secular population decline; favor cash flow + early exit over multi-decade hold.
- At projected returns (-3.0% appreciation + 0.0% rent growth), your $22k cash investment doubles in ~6 years — after that, you're playing with house money.
Negotiation context
- It's been on market 18 days — a 2% lower offer ($79k) is reasonable based on typical stale-listing flexibility.
- 9 sale attempts since 22y ago with the ask held roughly flat each time — persistent listings suggest the price (not the market) is what's stuck; bring a comps-based counter.
- Current owner paid $6k; list at $80k implies a 1211% gain — meaningful room to come down on a strong offer.
Risks & watch-outs
- Watch-outs: built in 1939 — expect roof / HVAC / electrical / plumbing capex.
Questions for the listing agent
- Built in 1939 — when were the roof, HVAC, electrical panel, plumbing, and water heater last replaced?
- Is there a deadline driving the sale (1031 exchange, divorce, estate, relocation)? That informs how much negotiation room exists.
- Schools are F-rated, which usually means shorter tenancies and higher turnover. Who's the typical renter profile here, and what's been the actual vacancy rate?
- Crime grade is F in this area — have there been break-ins, vandalism, or insurance claims at this property in the last 3 years? What carrier currently insures it and at what premium?
- What's the average days-on-market for RENTAL listings here right now (not sales)? A rising rental-DOM trend means longer vacancies and softer asking-rent achievability than the comps imply.
- What's the recent tenant-quality profile in this submarket — average credit score on applications, eviction rate, late-payment / NSF rate, and stable-employment percentage? A property-management company in the area should have these aggregated.
- How much new for-sale + rental construction is in the pipeline within 1–3 miles? Heavy new supply typically softens prices + rents 12–24 months out; constrained supply supports both.
Investment metrics
- 1% rule
- 1.58% ✓
- Cap rate
- 13.35%
- Cash-on-cash
- 25.19%
- DSCR
- 2.12
- GRM
- 5.3
CMA / ARV
- ARV (on-the-fly)
- $89,462
- Comps found
- 12
Show comp detail 12 sales within ~0.75 mi
| Address | Dist | Beds/Ba | Sqft | Sold | Price | $/sf | Match |
|---|---|---|---|---|---|---|---|
| 9222 Hartwell St | 0.11mi | 3/1.0 | 1,000 (-8%) | 5mo | $70,000 | $70 | 77 |
| 8938 Hartwell St | 0.20mi | 3/1.5 | 1,042 (-4%) | 7mo | $100,000 | $96 | 76 |
| 9180 Hartwell St | 0.12mi | 3/1.5 | 1,174 (+8%) | 5mo | $62,000 | $53 | 76 |
| 9393 Meyers Rd | 0.34mi | 3/1.5 | 1,108 (+2%) | 8mo | $75,000 | $68 | 72 |
| 9248 Manor St | 0.40mi | 3/1.0 | 1,147 (+5%) | 9mo | $150,000 | $131 | 65 |
| 9982 Littlefield St | 0.45mi | 3/1.0 | 1,152 (+6%) | 8mo | $47,000 | $41 | 64 |
| 8875 Manor St | 0.44mi | 3/1.0 | 1,176 (+8%) | 8mo | $125,000 | $106 | 60 |
| 8590 Littlefield St | 0.40mi | 3/1.5 | 1,218 (+12%) | 1mo | $100,000 | $82 | 59 |
| 8234 Meyers Rd | 0.70mi | 3/1.5 | 1,087 (-0%) | 8mo | $78,000 | $72 | 58 |
| 8220 Hartwell St | 0.63mi | 3/1.0 | 1,122 (+3%) | 10mo | $155,000 | $138 | 58 |
| 8999 Griggs St | 0.64mi | 3/2.0 | 1,196 (+10%) | 0mo | $190,000 | $159 | 50 |
| 9145 Pinehurst St | 0.45mi | 3/1.5 | 1,240 (+14%) | 5mo | $66,000 | $53 | 50 |
Match score weights: distance 35% · size 25% · config 20% · recency 20%. Top-matched comps best support the ARV.
Projected returns pro-forma
-3.0% appreciation · 0.0% rent growth · sell at horizon
- IRR
- 15.3%
- Equity multiple
- 1.59×
- Total profit
- $13,275
- Equity at exit
- $11,928
- IRR
- 21.7%
- Equity multiple
- 2.60×
- Total profit
- $35,789
- Equity at exit
- $6,917
Cash invested: $22,400 (down + closing). Projections, not guarantees.
Landlord ↔ Tenant lean methodology
- Overall (STATE)
- 62 Landlord-Friendly
- State Michigan
- 62 Landlord-Friendly · EVEN
- County
- — inherits STATE
- City
- — inherits STATE
ZIP-level market 48228
- Rents YoY
- -2.3%
- Active inventory
- 363
- Price-to-rent
- 5.3×
Monthly cashflow live
- Estimated rent
- $1,268 high interval (Pro) →
- Mortgage (P&I)
- −$420
- Tax from tax record
- −$78 /mo · $940/yr
- Insurance
- −$33
- HOA
- −$0
- Vacancy / Maint / Mgmt
- −$266
- Net cashflow
- $470
Break-even live
UW: 25.0% down · 7.5% · 30yr · 1.5% tax · 5.0% vac · 8.0% maint · 8.0% mgmt
Financing live
Cash to close
- Down payment
- $20,000
- Closing costs
- $2,400
- Reserves months
- —
- Total cash needed
- —
Loan-product check · same deal, 3 products live
Conventional
25% down · 7.5% · 30yr
- Down + closing
- —
- Monthly P&I
- —
- Monthly cashflow
- —
- DSCR
- —
- Eligible?
- —
Personal DTI + credit; lowest rate.
DSCR
20% down · 8.5% · 30yr
- Down + closing
- —
- Monthly P&I
- —
- Monthly cashflow
- —
- DSCR
- —
- Eligible?
- —
No personal income docs; deal must DSCR.
Hard money
10% down · 12.0% · 12mo
- Down + closing
- —
- Monthly P&I
- —
- Monthly cashflow
- —
- DSCR
- —
- Eligible?
- —
Short-term bridge; refi at stabilization.
Rent comps 40 comps
| Address | Beds | Baths | Sqft | Rent | $/sqft | DOM | Units | Dist |
|---|---|---|---|---|---|---|---|---|
| 9355 Ward St Detroit, MI | 3.0 | 1.0 | 1200 | $1,327 | $1.11 | 43d | 1 | 0.12mi |
| 9340 Hartwell St Detroit, MI | 3.0 | 1.0 | 1000 | $1,364 | $1.36 | 43d | 1 | 0.14mi |
| 9558 Meyers Rd Detroit, MI | 3.0 | 1.0 | 950 | $1,150 | $1.21 | 43d | 1 | 0.42mi |
| 13717 Keal St Detroit, MI | 2.0 | 1.0 | 799 | $1,000 | $1.25 | 43d | 1 | 0.54mi |
| 10002 Manor Unit 1 Detroit, MI | 2.0 | 1.0 | 1000 | $1,050 | $1.05 | 43d | 1 | 0.63mi |
| 10002 Manor Unit 2 Detroit, MI | 3.0 | 1.0 | 1100 | $1,150 | $1.05 | 43d | 1 | 0.63mi |
| 10359 Violetlawn St Unit 1 Detroit, MI | 2.0 | 1.0 | 1200 | $985 | $0.82 | 43d | 1 | 0.65mi |
| 10303 Morley St #1 Detroit, MI | 2.0 | 1.0 | 950 | $950 | $1.00 | 43d | 1 | 0.67mi |
| 10345 Crocuslawn Ave Unit 2 Detroit, MI | 2.0 | 1.0 | 850 | $950 | $1.12 | 43d | 1 | 0.68mi |
| 8283 Pinehurst St Unit 2 Detroit, MI | 2.0 | 1.0 | 1000 | $900 | $0.90 | 43d | 1 | 0.69mi |
| 12775 Plymouth Rd Unit 16 Detroit, MI | 2.0 | 1.0 | 1009 | $825 | $0.82 | 43d | 1 | 0.74mi |
| 9590 Marlowe St Detroit, MI | 2.0 | 1.0 | 877 | $1,430 | $1.63 | 43d | 1 | 0.78mi |
| 14740 W Chicago Unit B Detroit, MI | 2.0 | 1.0 | 900 | $845 | $0.94 | 43d | 1 | 0.81mi |
| 9501 Lauder St Detroit, MI | 3.0 | 2.0 | 1152 | $1,350 | $1.17 | 43d | 1 | 0.83mi |
| 9353 Kentucky St Detroit, MI | 2.0 | 1.0 | 800 | $999 | $1.25 | 17d | 1 | 0.87mi |
| 9386 Coyle St Detroit, MI | 3.0 | 1.0 | 1000 | $1,300 | $1.30 | 1d | 1 | 0.96mi |
| 8212 Lauder St Detroit, MI | 3.0 | 1.0 | 1026 | $1,150 | $1.12 | 43d | 1 | 1.00mi |
| 8114 Marlowe St Unit home Detroit, MI | 3.0 | 1.0 | 985 | $1,350 | $1.37 | 43d | 1 | 1.00mi |
| 11431 Marlowe St Detroit, MI | 3.0 | 1.0 | 1172 | $1,400 | $1.19 | 16d | 1 | 1.00mi |
| 9546 Sussex St Detroit, MI | 3.0 | 1.0 | 1000 | $1,400 | $1.40 | 43d | 1 | 1.04mi |
| 10015 Robson St Detroit, MI | 3.0 | 2.0 | 1000 | $1,400 | $1.40 | 17d | 1 | 1.04mi |
| 9917 Sussex St Detroit, MI | 2.0 | 1.0 | 800 | $1,375 | $1.72 | 43d | 1 | 1.10mi |
| 8604 Whitcomb St Detroit, MI | 3.0 | 2.0 | 1033 | $1,300 | $1.26 | 43d | 1 | 1.12mi |
| 9022 Northlawn St Detroit, MI | 2.0 | 1.0 | 1100 | $1,300 | $1.18 | 24d | 1 | 1.15mi |
| 8047 Robson St Detroit, MI | 3.0 | 2.0 | 1184 | $1,200 | $1.01 | 43d | 1 | 1.19mi |
| 8143 Wisconsin St Detroit, MI | 4.0 | 1.0 | 1370 | $1,800 | $1.31 | 1d | 1 | 1.19mi |
| 8331 Whitcomb St Detroit, MI | 4.0 | 1.0 | 1342 | $1,350 | $1.01 | 21d | 1 | 1.20mi |
| 12039 Lauder St Detroit, MI | 3.0 | 1.5 | 1000 | $1,500 | $1.50 | 24d | 1 | 1.20mi |
| 12014 Terry St Detroit, MI | 2.0 | 1.0 | 1361 | $1,200 | $0.88 | 43d | 1 | 1.21mi |
| 8230 Ohio St Detroit, MI | 3.0 | 1.0 | 1350 | $1,200 | $0.89 | 16d | 1 | 1.24mi |
| 11634 Sussex St Detroit, MI | 3.0 | 1.0 | 1091 | $1,326 | $1.22 | 24d | 1 | 1.25mi |
| 8544 Cloverlawn St Detroit, MI | 2.0 | 1.0 | 800 | $800 | $1.00 | 17d | 1 | 1.25mi |
| 11397 Whitcomb St Detroit, MI | 3.0 | 1.0 | 1070 | $1,400 | $1.31 | 16d | 1 | 1.26mi |
| 12144 Washburn St Detroit, MI | 3.0 | 1.0 | 1200 | $1,200 | $1.00 | 14d | 1 | 1.27mi |
| 12468 Mendota St Detroit, MI | 2.0 | 1.0 | 1100 | $1,000 | $0.91 | 24d | 1 | 1.29mi |
| 12468 Mendota St Detroit, MI | 2.0 | 1.0 | 1100 | $1,100 | $1.00 | 43d | 1 | 1.29mi |
| 11393 Prest St Detroit, MI | 3.0 | 1.0 | 900 | $1,550 | $1.72 | 16d | 1 | 1.30mi |
| 9973 Winthrop St Detroit, MI | 3.0 | 1.0 | 960 | $1,400 | $1.46 | 43d | 1 | 1.34mi |
| 11345 Greenfield Rd Detroit, MI | 2.0 | 1.0 | 700 | $1,050 | $1.50 | 12d | 1 | 1.34mi |
| 9222 Forrer St Detroit, MI | 3.0 | 1.0 | 947 | $1,450 | $1.53 | 16d | 1 | 1.34mi |
Listing history 33 events
-
2026-04-28status Pending 474-char remark
Show marketing remark (474 chars)
Back on the market potential off market sale with tenant didn't materialize. Serious investor looking for an income property in Barton McFarland less than two miles to Joe Louis Greenway and Cody High School undergoing an 86 million dollar renovation. This brink bungalow has good structure, minor updates, and some original features. Great opportunity to rehab, refi, and hold as the equity increases. First time buyer with City of Detroit down payment assistance up to 25K
-
2026-04-28status Pending
Show marketing remark (474 chars)
Back on the market potential off market sale with tenant didn't materialize. Serious investor looking for an income property in Barton McFarland less than two miles to Joe Louis Greenway and Cody High School undergoing an 86 million dollar renovation. This brink bungalow has good structure, minor updates, and some original features. Great opportunity to rehab, refi, and hold as the equity increases. First time buyer with City of Detroit down payment assistance up to 25K
-
2026-04-10$80,000 Active 474-char remark
Show marketing remark (474 chars)
Back on the market potential off market sale with tenant didn't materialize. Serious investor looking for an income property in Barton McFarland less than two miles to Joe Louis Greenway and Cody High School undergoing an 86 million dollar renovation. This brink bungalow has good structure, minor updates, and some original features. Great opportunity to rehab, refi, and hold as the equity increases. First time buyer with City of Detroit down payment assistance up to 25K
-
2026-04-10$80,000 Active
Show marketing remark (474 chars)
Back on the market potential off market sale with tenant didn't materialize. Serious investor looking for an income property in Barton McFarland less than two miles to Joe Louis Greenway and Cody High School undergoing an 86 million dollar renovation. This brink bungalow has good structure, minor updates, and some original features. Great opportunity to rehab, refi, and hold as the equity increases. First time buyer with City of Detroit down payment assistance up to 25K
-
2026-04-01historical
-
2026-03-31historical
-
2026-03-26price $80,000
-
2026-03-26price $80,000
-
2026-03-26price $80,000
-
2026-03-22price $85,000
-
2026-03-22price $85,000
-
2026-03-22price $85,000
-
2026-02-06price $90,000
-
2026-02-06price $90,000
-
2026-02-06price $90,000
-
2026-01-08price $95,000
-
2026-01-08price $95,000
-
2026-01-08price $95,000
-
2025-12-10$98,000 Active
-
2025-12-10$98,000 Active
-
2025-12-08historical
-
2012-07-25soldstatus $6,100
-
2012-07-25soldstatus $6,100
-
2012-06-05historical
-
2012-06-05historical
-
2012-05-30$5,100
-
2012-05-30$5,100
-
2005-07-31historical
-
2005-05-16$95,000
-
2005-04-01historical
-
2004-12-16$100,000
ⓘ Source: listings_history table (triggers on properties + properties_extension) + one-shot
backfill from property_details.listing_events for pre-trigger history.
Tax reassessment forecast MI · Partial reset (capped growth)
- Current annual tax
- $940 · $78/mo
- Projected year-2 tax
- $1,086 · $90/mo
- Expected delta
- +$146/yr (+$12/mo · 15.5%)
ⓘ Screening estimate from a state-policy table — verify with the county assessor before closing.
Climate risk First Street
- Flood 3/10 Moderate FEMA zone X (unshaded) · 20% chance over 30 yrs
- Wildfire 1/10 Low
- Heat 3/10 Moderate 7 d/yr ≥97°F today · 15 d/yr by 30 yrs out
- Wind 2/10 Low
- Air quality 3/10 Moderate 2 unhealthy d/yr today · 5 by 30 yrs out
Nearby sold comps map
Loading sold comps map…
Walkable amenities ~0.75 mi
Loading nearby amenities…
Taxation est. · year 1
- Rental income
- $15,211
- − Mortgage interest
- −$4,481
- − Property taxes
- −$940
- − Insurance
- −$400
- − Repairs & maintenance
- −$1,217
- − Management
- −$1,217
- − Depreciation
- −$2,327
- Taxable income
- $4,629
- Est. tax owed @ 24.0%
- −$1,111
- After-tax cash flow
- $4,531/yr
For passive investors: Depreciation is non-cash, so a rental often shows a tax loss while cash-flowing — sheltering income. Rental losses are passive: they offset passive income freely, and up to $25,000/yr can offset ordinary (W-2) income if you actively participate and your MAGI is under $100k (phasing out to $0 by $150k); unused losses carry forward. On sale, claimed depreciation is recaptured at up to 25%, and gains may owe capital-gains tax (a 1031 exchange can defer both). Figures are a year-1 estimate at your 24.0% rate — not tax advice; consult a CPA.
Schools (NCES district)
- District
- Detroit Public Schools Community District
- NCES district ID
- 2601103
- Math proficiency
- 10% ▼ -2.00%
- Reading proficiency
- 24% ▲ 6.00%
- Median HH income
- $25,815
- Composite
- 13.06/100
- National rank
- #9564
- State rank
- #499 of 540 in MI
Livability — Detroit
- Score
- 73/100
- State rank
- #218
- US rank
- #5427
Category grades
Schools grade is shown separately in the Schools card above.
Census & demographics
- Census place
- Detroit, MI
- County
- Wayne County · 1,562,939 people
- City population
- 572,865
- Metro
- Detroit-Warren-Dearborn, MI
- Population (ZIP)
- 50,117
- Household income
- $30,680
- Rent vs Own
- Severe rent burden
- 4144.0
Population outlook (Wayne County) Hauer SSP2
- Today (2025)
- 1,675,273 people
- By 2030
- 1,620,300 · -3.3%
- By 2040
- 1,502,341 · -10.3%
- By 2050
- 1,384,039 · -17.4%
- By 2075
- 1,124,592 · -32.9%
- By 2100
- 881,193 · -47.4%
Race, ethnicity, and origin ACS 2023
- Neighborhood character
- Predominantly Black (71%)
- Race & ethnicity
- Black 71% White 16% Two or more races 7% Hispanic / Latino 6%
- Hispanic origin (detail)
- Mexican 3% Puerto Rican 2%
- Common ancestry
- Arab 2% Romanian 2% Lithuanian 1%
- Foreign-born
- 11% · Canada
- Languages at home
- 82% English-only · Arabic 11% Spanish 5%
Political lean MEDSL · Wayne
- 2024 margin
- Strong D (+29.0) · D 62.7% · R 33.7% · Other 3.6%
- 2008→2024 swing
- -20.5pp toward R · 2008: 49.5pp · 2024: 29.0pp
- All cycles
- 2024: D+29.0 2020: D+38.1 2016: D+37.3 2012: D+46.9 2008: D+49.5
Not yet ingested
- Civics
- —
Market trends
- HPI YoY
- ▼ -160.81%
- Current HPI
- 168.6843
- Rent YoY
- ▼ -2.30%
- Metro
- Detroit-Warren-Dearborn, MI
- State GDP YoY
- ▲ 1.37%
- F500 in state
- 28
Industry mix (Fortune 500 HQ in MI)
| Industry | F500 HQs | Revenue |
|---|---|---|
| Automotive Parts | 3 | $48B |
|
||
| Automotive | 2 | $372B |
|
||
| Chemicals | 1 | $45B |
|
||
| Automotive Retail | 1 | $29B |
|
||
| Healthcare / Medical Devices | 1 | $23B |
|
||
| Automotive Technology | 1 | $20B |
|
||
Price history
-20.0% since first listed33 events — show timeline
- 2026-04-28 Pending — REALCOMP
- 2026-04-28 Pending — MiRealSource-MiMLS
- 2026-04-28 Pending — SW Michigan MLS
- 2026-04-10 Listed $80,000 REALCOMP
- 2026-04-10 Listed $80,000 SW Michigan MLS
- 2026-04-10 Listed $80,000 MiRealSource-MiMLS
- 2026-04-01 Listing Removed — MiRealSource-MiMLS
- 2026-03-31 Listing Removed — REALCOMP
- 2026-03-26 Price Changed $80,000 MiRealSource-MiMLS
- 2026-03-26 Price Changed $80,000 REALCOMP
- 2026-03-26 Price Changed $80,000 SW Michigan MLS
- 2026-03-22 Price Changed $85,000 MiRealSource-MiMLS
- 2026-03-22 Price Changed $85,000 REALCOMP
- 2026-03-22 Price Changed $85,000 SW Michigan MLS
- 2026-02-06 Price Changed $90,000 MiRealSource-MiMLS
- 2026-02-06 Price Changed $90,000 REALCOMP
- 2026-02-06 Price Changed $90,000 SW Michigan MLS
- 2026-01-08 Price Changed $95,000 MiRealSource-MiMLS
- 2026-01-08 Price Changed $95,000 REALCOMP
- 2026-01-08 Price Changed $95,000 SW Michigan MLS
- 2025-12-10 Listed $98,000 REALCOMP
- 2025-12-10 Listed $98,000 MiRealSource-MiMLS
- 2025-12-08 Coming Soon — MiRealSource-MiMLS
- 2012-07-25 Sold (MLS) $6,100 MiRealSource-MiMLS
- 2012-07-25 Sold (MLS) $6,100 REALCOMP
- 2012-06-05 Listing Removed — MiRealSource-MiMLS
- 2012-06-05 Listing Removed — REALCOMP
- 2012-05-30 Listed $5,100 MiRealSource-MiMLS
- 2012-05-30 Listed $5,100 REALCOMP
- 2005-07-31 Listing Removed — REALCOMP
- 2005-05-16 Listed $95,000 REALCOMP
- 2005-04-01 Listing Removed — REALCOMP
- 2004-12-16 Listed $100,000 REALCOMP
Property tax history
-4.4%/yrLatest (2025): $940 · -40.3% YoY. Source: county tax records.
Cash-flow waterfall
monthlySold comps — $/sqft
last 12 mo · ≤1 miLoading sold comps…